In 2024, measles immunization coverage was high across many reporting economies, but the global distribution also contained a substantial lower tail. World Bank indicator SH.IMM.MEAS measures the share of children ages 12–23 months who received measles vaccination. The comparison contains 217 countries and separately reported economies: 192 have a 2024 value and 25 do not have a 2024 numeric value. Missing observations remain missing rather than being converted to zero, so an unshaded economy on the map should not be interpreted as having no vaccinated children.
Across the 192 reported observations, the median is 90% and the mean is 85.76%. The middle half runs from 80.75% at the first quartile to 96% at the third quartile. The highest reported value is 99%, shared by many economies, while Montenegro is the minimum at 23%. That produces a 76-percentage-point range. The broad spread makes it more useful to examine groups of economies and the lower tail than to force a strict ranking among places tied near the top.
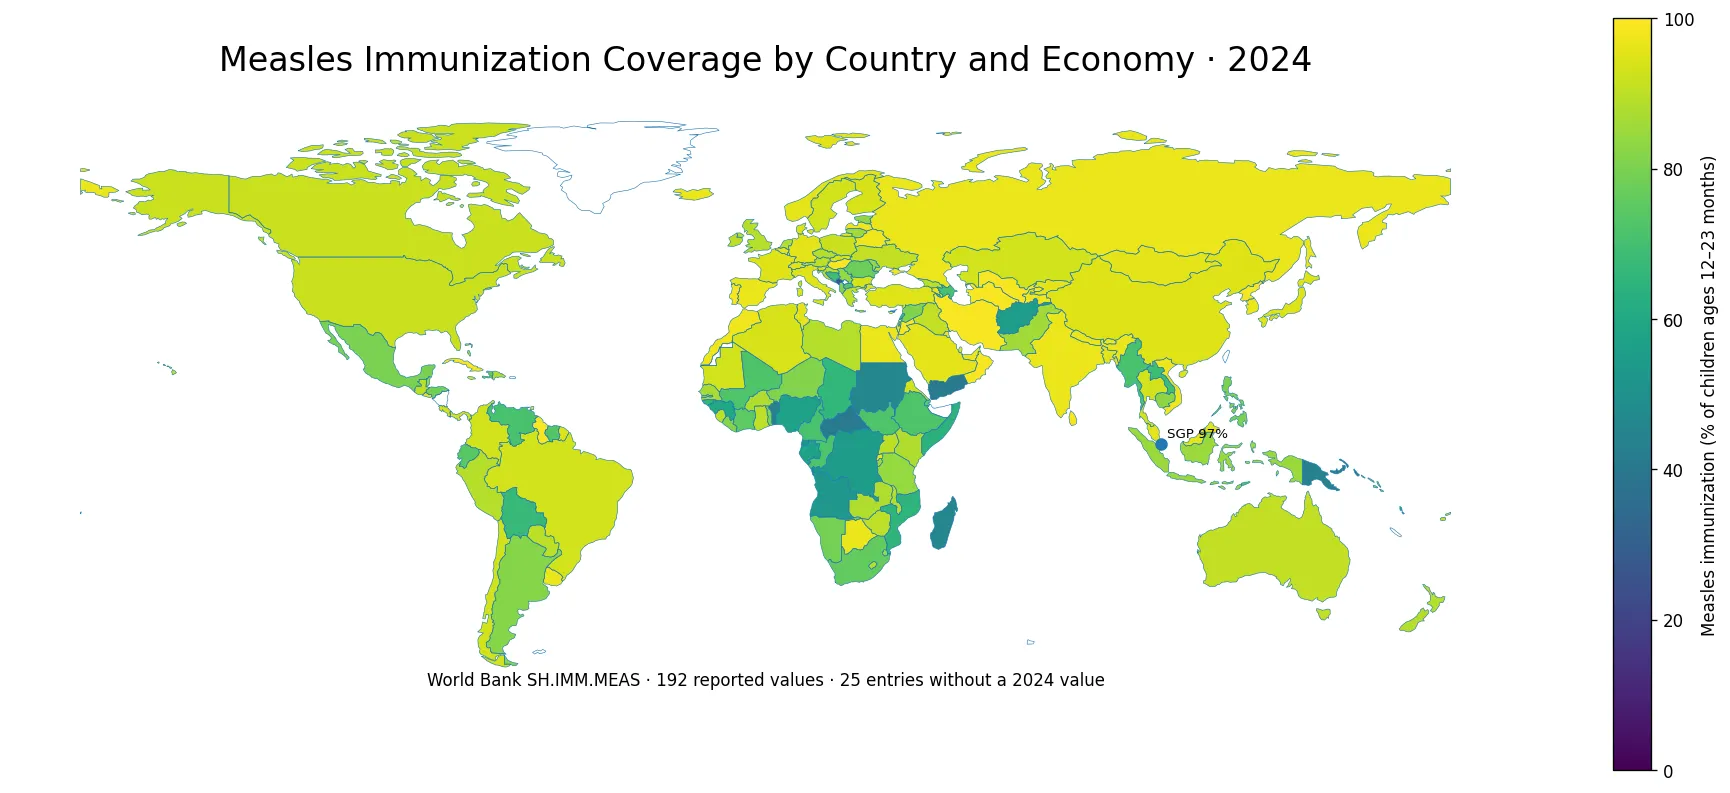
Table of Contents
More than half of reported economies were at or above 90%
Of the 192 economies with a 2024 observation, 102 reported coverage of at least 90%. Sixty-seven were at or above 95%. At the other end, 90 observations were below 90%, 45 were below 80%, 23 were below 70%, and seven were below 50%. These thresholds are descriptive guideposts rather than performance grades. They show how the distribution is divided and make it easier to compare a country with the broader set without pretending that one cutoff explains every public-health circumstance.
The median of 90% is especially informative because a relatively small group of low values pulls the arithmetic mean down to 85.76%. Looking only at the mean would obscure how much of the distribution sits in the high-coverage range. Looking only at the maximum would do the opposite and hide the lower tail. The quartiles, median, and threshold counts together provide a fuller picture of where the 2024 observations are concentrated.
| Measure | 2024 result |
|---|---|
| Reported observations | 192 countries and economies |
| No 2024 value | 25 |
| Median | 90% |
| Mean | 85.76% |
| At least 95% | 67 |
| Below 80% | 45 |
| Minimum | Montenegro 23% |
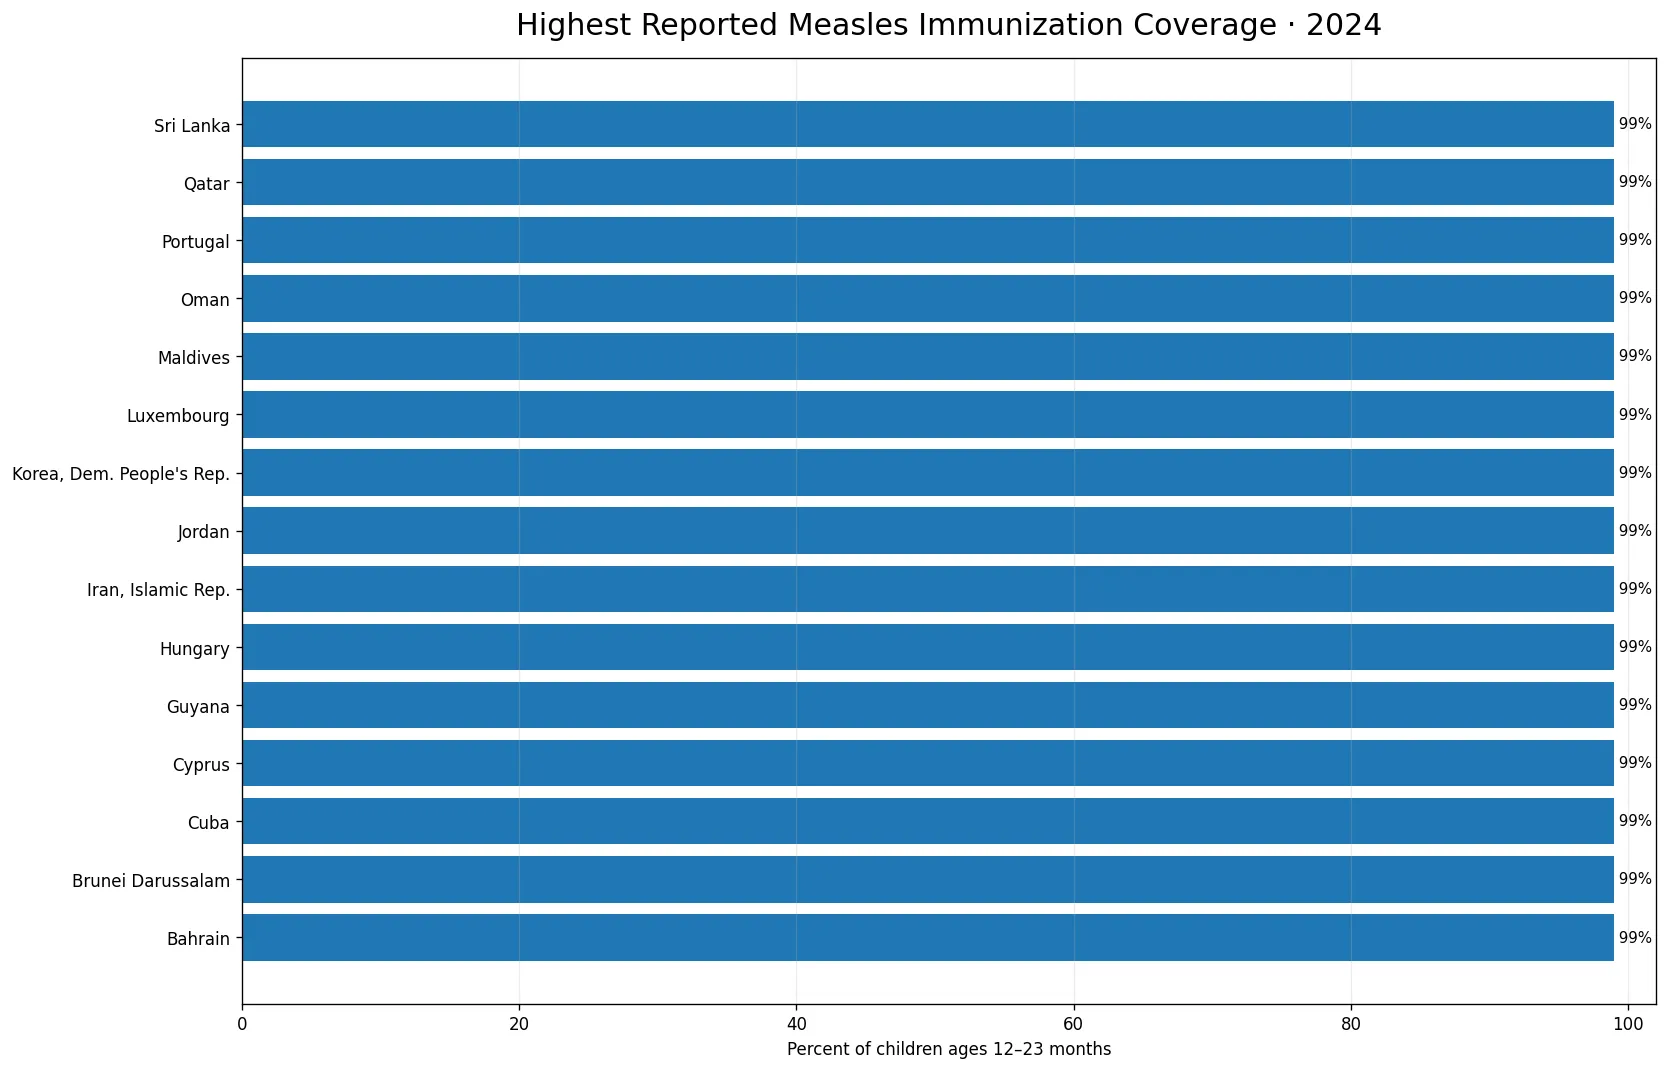
A large group shared the 99% maximum
Bahrain, Brunei Darussalam, Cuba, Cyprus, Guyana, Hungary, Iran, Jordan, Sri Lanka, Luxembourg, Maldives, Oman, Portugal, Qatar, Turkmenistan, Tonga, Uzbekistan and St. Vincent and the Grenadines are among the economies reported at 99%. Because so many places share the same maximum, listing them from first to eighteenth would imply a precision that the data do not support. It is more sensible to treat them as a high-coverage group.
A reported 99% also does not mean that every child in the country was vaccinated or that every age group has the same coverage. The indicator is limited to children ages 12–23 months and focuses on receipt of a measles vaccine dose as defined by the series. It should not be substituted for measures of second-dose coverage, population immunity, disease incidence, or outbreak risk.
The lower tail is where the largest differences appear
Montenegro is the minimum at 23%. The Central African Republic and Yemen are both at 41%; Benin and Papua New Guinea are at 44%; Madagascar and Sudan are at 46%. Angola and Equatorial Guinea report 53%, while Afghanistan and the Democratic Republic of the Congo report 55%. These values establish the lower end of the 2024 distribution, but they do not by themselves explain why coverage is lower in those places.
Access to health services, vaccine availability, population mobility, conflict, survey design, administrative reporting and denominator estimation can all matter in real-world immunization programs. SH.IMM.MEAS does not separately measure those mechanisms. Any attempt to explain a country’s value should therefore draw on that country’s official immunization and health-system evidence rather than infer causes from a single percentage.
What SH.IMM.MEAS actually measures
The World Bank description defines the indicator as the percentage of children ages 12–23 months who received measles vaccination before 12 months of age or at any time before the survey. A child is considered adequately immunized against measles after receiving one dose for purposes of this series. In practical terms, the indicator is a first-dose reach measure for a specific young-child age band.
That definition places clear limits on interpretation. A value of 95% does not say that 95% completed a two-dose measles schedule, nor does it describe vaccination of adults or older children. It also does not directly measure antibody levels or clinical protection. Those questions require different indicators. Keeping the definition visible prevents the map from being read as a broader measure than it really is.
Twenty-five missing observations are not zero coverage
The 217-row country-and-economy universe includes 25 entries without a 2024 value. They are retained as missing. Treating them as zero would produce a serious visual and statistical error because an unavailable observation is fundamentally different from a reported vaccination rate of 0%. No reported economy in the 2024 observations has a value of zero; the minimum numeric observation is 23%.
There are also two different meanings of the word coverage in this topic. Data coverage describes how many economies have an observation: 192 of 217 here. Immunization coverage describes the percentage of children vaccinated within an economy. Keeping those concepts separate avoids statements that accidentally confuse completeness of the data with reach of the vaccination program.
How to read the world map without overinterpreting area
The choropleth assigns the reported percentage to each matched country polygon. Large countries occupy more pixels, but their visual area is unrelated to the number of vaccinated children. A small island economy can have the same percentage as a very large country while appearing almost invisible at world scale. The map is therefore best for identifying geographic patterns and broad clusters, not for comparing the absolute number of children affected.
Low-resolution world boundaries also omit or greatly simplify some small territories. The underlying comparison can contain a valid value even when that economy is difficult to see on the map. For precise lookup, the numeric table or underlying indicator observation should take precedence over polygon visibility. The map and the country list serve different purposes and should be used together.
A one-year snapshot is not a trend
Every value in this comparison is tied to 2024. That makes cross-country comparison straightforward, but it does not tell whether a country’s coverage is improving, declining, or stable. A place at 82% could be recovering from a lower level or falling from a higher one. Those histories are invisible in a single-year map.
Trend analysis should follow the same indicator across several years and check that the underlying reporting approach remains comparable. Year-to-year changes can also reflect revisions or updated estimates, so large moves deserve source review. The 2024 map is strongest as a snapshot of relative position, while time-series analysis answers a different question.
High coverage should not be equated with zero measles risk
A high first-dose percentage indicates broad reach of that vaccination service, but it is not a complete model of outbreak risk. Risk can also depend on pockets of unvaccinated people, geographic clustering, second-dose coverage, importations, surveillance and other epidemiological conditions. Two countries with the same national percentage can therefore face different local circumstances.
The reverse is also important: a lower value should not be converted into a sweeping judgment about the quality of an entire health system. SH.IMM.MEAS captures one vaccination measure for one age group. Good comparative writing keeps the claim at the same level as the evidence: a reported 2024 measles immunization percentage among children ages 12–23 months.
Percentages do not reveal the number of unvaccinated children
A rate-based map gives every economy a comparable 0–100 scale, but it removes population size from the visual. Ninety percent coverage in a very large birth cohort can correspond to many more unvaccinated children than 70% coverage in a very small population. Estimating the number of children missed would require an appropriate denominator for the 12–23-month population in addition to the coverage rate.
This distinction matters for planning. Coverage percentages are useful for comparing reach and identifying gaps in proportionate terms. Absolute counts are more useful for estimating how many children need services or how much vaccine may be required. The two measures answer related but different questions and should not be substituted for one another.
A practical way to use the 2024 comparison
Start with the map to locate an economy in the global distribution, then compare its value with the 90% median. Next, use broad bands such as 95% or more, 80–94%, 70–79%, and below 70% to understand where it sits relative to peers. Finally, check whether the observation exists at all and return to the indicator definition before drawing conclusions.
If a low value warrants investigation, the next step is not to guess a cause. It is to examine that economy’s historical measles coverage, second-dose coverage, subnational data, official immunization reports and other relevant health indicators. The same discipline applies to high values: a strong one-year percentage is useful evidence, but it is not a substitute for trend, equity and outcome data.
Countries and economies are not the same as a sovereign-state count
The World Bank country master includes countries and separately reported economies, including some territories. For that reason, the 217 rows should not be described as 217 sovereign states. The wording ‘countries and economies’ or ‘countries and areas’ better matches the scope of the indicator data. The same caution applies when counting the 192 observations with values.
This distinction is also relevant to mapping. Some separately reported economies are too small to have a visible polygon in a low-resolution global boundary layer. Their numeric observations remain part of the statistical summary even when the map cannot display them clearly. Spatial visibility and data availability are separate issues.
What the 2024 distribution says—and what it does not
The headline pattern is straightforward: high first-dose measles immunization coverage was common among the 192 reporting economies, with a 90% median and 67 observations at 95% or higher. At the same time, 45 observations were below 80%, and seven were below 50%. The 76-point range between 99% and 23% shows that the global distribution still contains very large differences.
The most reliable interpretation keeps three rules in view. Missing is not zero. SH.IMM.MEAS is a specific first-dose coverage measure for children ages 12–23 months, not a general immunity index. And a one-year national percentage does not establish causation, trend, or overall health-system quality. With those limits respected, the map becomes a useful global comparison rather than an overextended ranking.
Frequently Asked Questions
What was the median measles immunization coverage in 2024?
The median across the 192 reported country-and-economy observations was 90%, while the mean was 85.76%.
Which reported economy had the lowest 2024 value?
Montenegro had the minimum reported value at 23%. The Central African Republic and Yemen were both at 41%.
Do the 25 missing observations mean zero vaccination coverage?
No. They indicate that no 2024 numeric value was available for those entries; missing data are not equivalent to 0% coverage.
Does SH.IMM.MEAS measure the second measles vaccine dose?
No. The series measures receipt of a measles vaccine dose among children ages 12–23 months as defined by the World Bank indicator.
Related Articles
Green Map creates custom-edited map images using open geographic data sources such as geoBoundaries, Natural Earth, OpenStreetMap, and government open data. These maps are edited visual materials, not raw data files, and are provided for education, documents, presentations, and graphic reference.