Winnebago County sits at the northern edge of Illinois, with Rockford anchoring the east and southeast while Loves Park, Machesney Park, Roscoe, Rockton, and South Beloit form a closely spaced chain toward the Wisconsin line. You can download the high-resolution JPG map ZIP directly from this page for closer viewing, classroom use, or printing. The maps also show how Winnebago, Pecatonica, and Durand spread across the western half, how the Rock, Pecatonica, Sugar, and Kishwaukee rivers cross different parts of the county, and how elevations vary from roughly 206 to 303 meters.
A useful way to orient yourself is to start with Rockford and work outward. US 20 crosses the county east to west and points toward Pecatonica, while IL 2 and US 251 run north through the communities along the Rock River corridor. I-39 and US 51 mark the eastern and southern side of the Rockford area, and IL 70 and IL 75 become more useful once you move toward the western and northwestern part of the county. The change is easy to see: road and settlement labels are dense around Rockford, but they spread out considerably west of the city.
The river and elevation maps add another layer to that contrast. The Rock River creates a broad low corridor through the eastern side of the county, while the Pecatonica and Sugar rivers wind through the west and northwest. The Kishwaukee River crosses the southern extension of the county, joined by smaller creeks that cut through nearby uplands. Elevation colors show the lowest ground following many of these waterways, with higher ridges appearing across the west, southwest, northwest, and parts of the eastern edge. Looking at the maps together makes the county much easier to understand than treating its cities, rivers, and terrain as separate subjects.
Table of Contents
Rockford anchors a dense eastern corridor while western towns spread out
The county reference map makes Rockford the clearest starting point. Its built-up area fills much of the southeastern portion of Winnebago County, with Loves Park immediately to the north and Machesney Park extending farther along the same general corridor. Roscoe and Rockton sit farther north near the Rock River, and South Beloit occupies the county’s northern edge near the Wisconsin line. The pattern is much looser to the west: Winnebago lies west of Rockford, Pecatonica is farther west along US 20, and Durand appears in the northwest near IL 75.
Several highways help explain the map quickly without turning it into a route guide. US 20 provides the strongest east-west reference across the middle and southern portion of the county. IL 2 follows the river-oriented north-south corridor through the Rockford region toward Rockton, while US 251 serves another north-south path through the urban side of the county. I-39 and US 51 are prominent on the east and south side of Rockford. West of the city, the network becomes simpler, with IL 70 and IL 75 serving smaller communities rather than a continuous urban area.
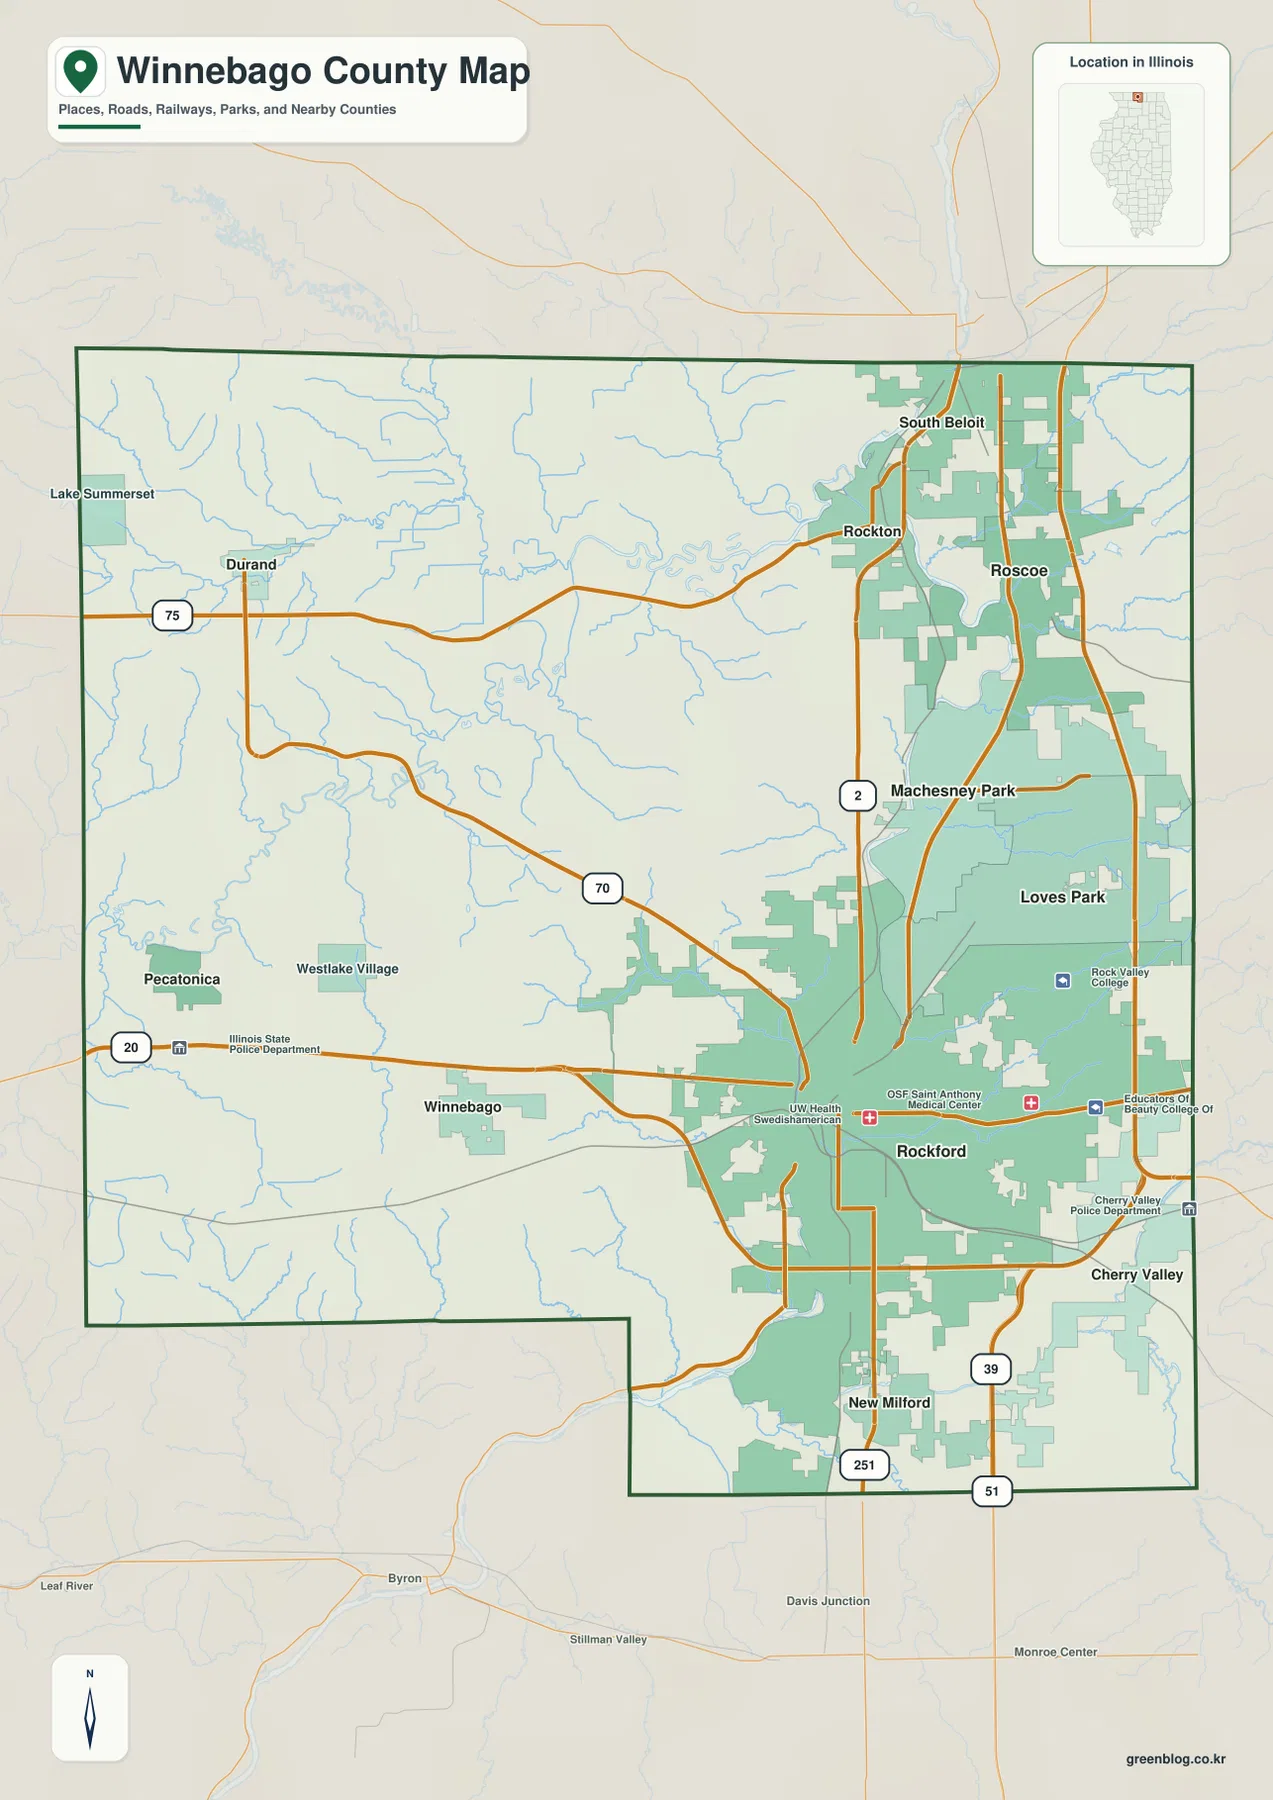
The county outline is also worth noticing because it is not a simple rectangle. Most of Winnebago County extends broadly east to west, but a narrower section drops south below the main body near New Milford. Cherry Valley lies near the southeast edge of the Rockford area, while New Milford sits within that southern extension. These shape changes matter when comparing the county map with the river and elevation maps because the Kishwaukee River crosses the southern portion rather than the central Rockford corridor.
The map labels several institutions around Rockford, including medical centers and Rock Valley College, but they are best treated as orientation points rather than the subject of the page. For most readers, the easiest strategy is to locate Rockford, follow US 20 west toward Pecatonica, then trace IL 2 or US 251 north through the chain of communities toward the state line. That simple sequence gives enough structure to understand the rest of the county without memorizing every local road.
Six leading communities form a north-south cluster on the county’s east side
The city-distribution map removes much of the road detail and ranks six major communities. Rockford is shown as number 1, followed by Loves Park, Machesney Park, Roscoe, Rockton, and South Beloit. The map package lists reference values of 147,521 for Rockford, 23,502 for Loves Park, 22,630 for Machesney Park, 10,706 for Roscoe, 7,974 for Rockton, and 7,946 for South Beloit. Those figures are useful for understanding the ranking used on this particular graphic, but they should not be treated as a substitute for the latest official population estimates.
What matters most visually is where those six places fall. Rockford occupies the southern end of the cluster, Loves Park and Machesney Park continue northward, and Roscoe and Rockton sit closer to the northern county line. South Beloit is the northernmost of the six. None of the ranked cities appears in the western half of the map, which makes the east-west imbalance immediately obvious even before you return to the more detailed county map.
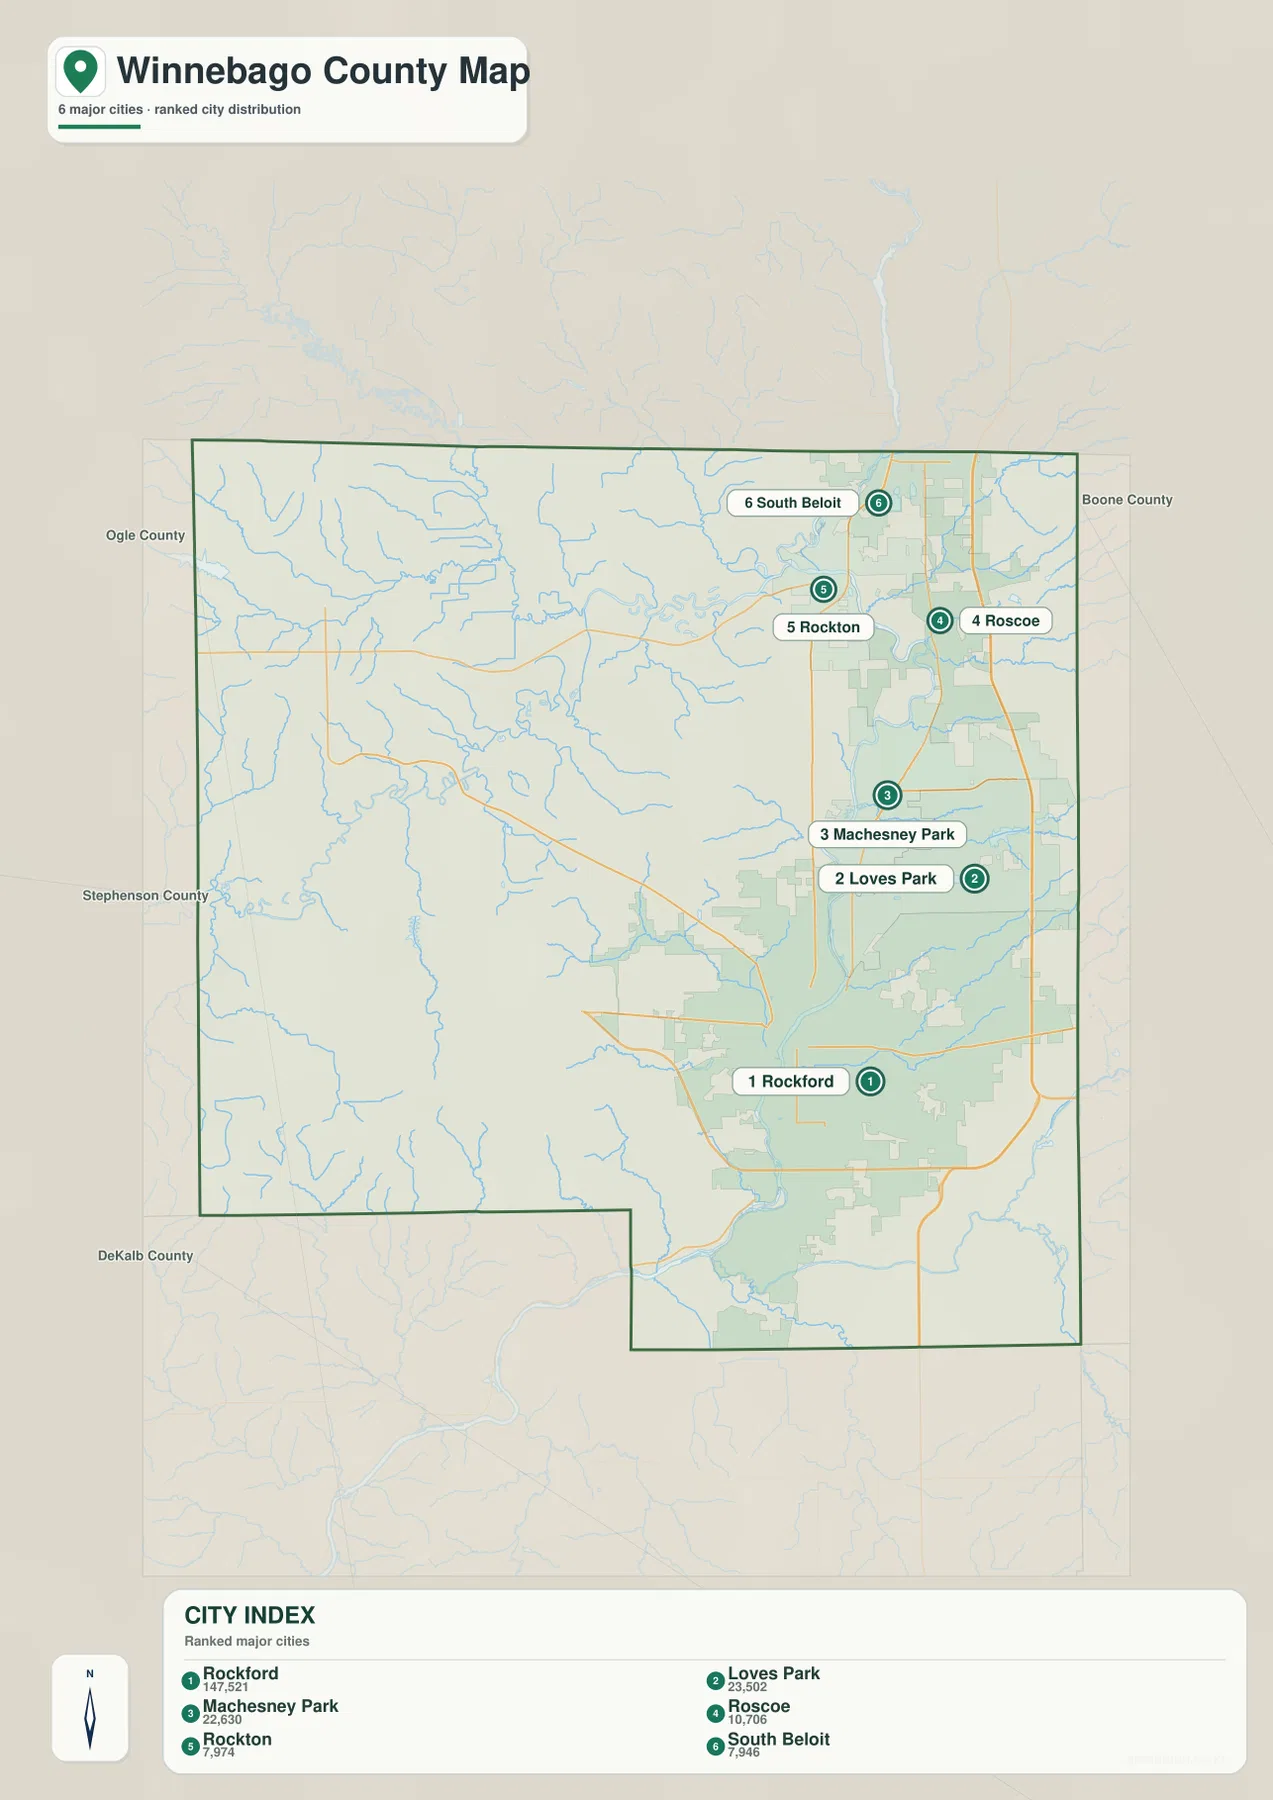
Neighboring county labels provide additional context. Boone County lies to the east, Ogle County to the south, Stephenson County to the west, and DeKalb County appears farther southeast on the reference frame. These labels are useful because Rockford and several northern communities sit relatively close to the eastern side of Winnebago County, whereas the western half has fewer large population centers on this map. Returning to the county map after viewing this simplified version makes the contrast between the Rockford corridor and the western towns much clearer.
This map does not provide driving distances or travel times between the ranked communities. It is a location-and-scale reference rather than a navigation product. If you need to compare Rockford with Roscoe or South Beloit, use this view to learn the relative positions first, then consult current road information for actual routes. The county map supplies the highways, while the city map keeps the settlement pattern uncluttered.
Four major river systems divide the county into distinct low corridors
The terrain-and-water map gives the Rock River the strongest visual presence. It enters from the north, passes the Rockton and Roscoe area, and continues south through the Rockford side of the county before leaving toward the Kishwaukee River system. In the northwest, the Sugar River forms another major channel and approaches the Pecatonica River. The Pecatonica winds across the western and north-central part of the county, creating a very different water landscape from the more urban Rock River corridor.
The southern extension of the county belongs to the Kishwaukee River network. The main Kishwaukee River crosses the lower portion of the map, while the Kishwaukee River North Branch is labeled farther east. Fork Kent Creek and Keith Creek appear closer to the Rockford area, and Mill Creek branches across the southwest. Smaller tributaries fill much of the space between the major rivers, especially in the west where settlement labels are sparse.
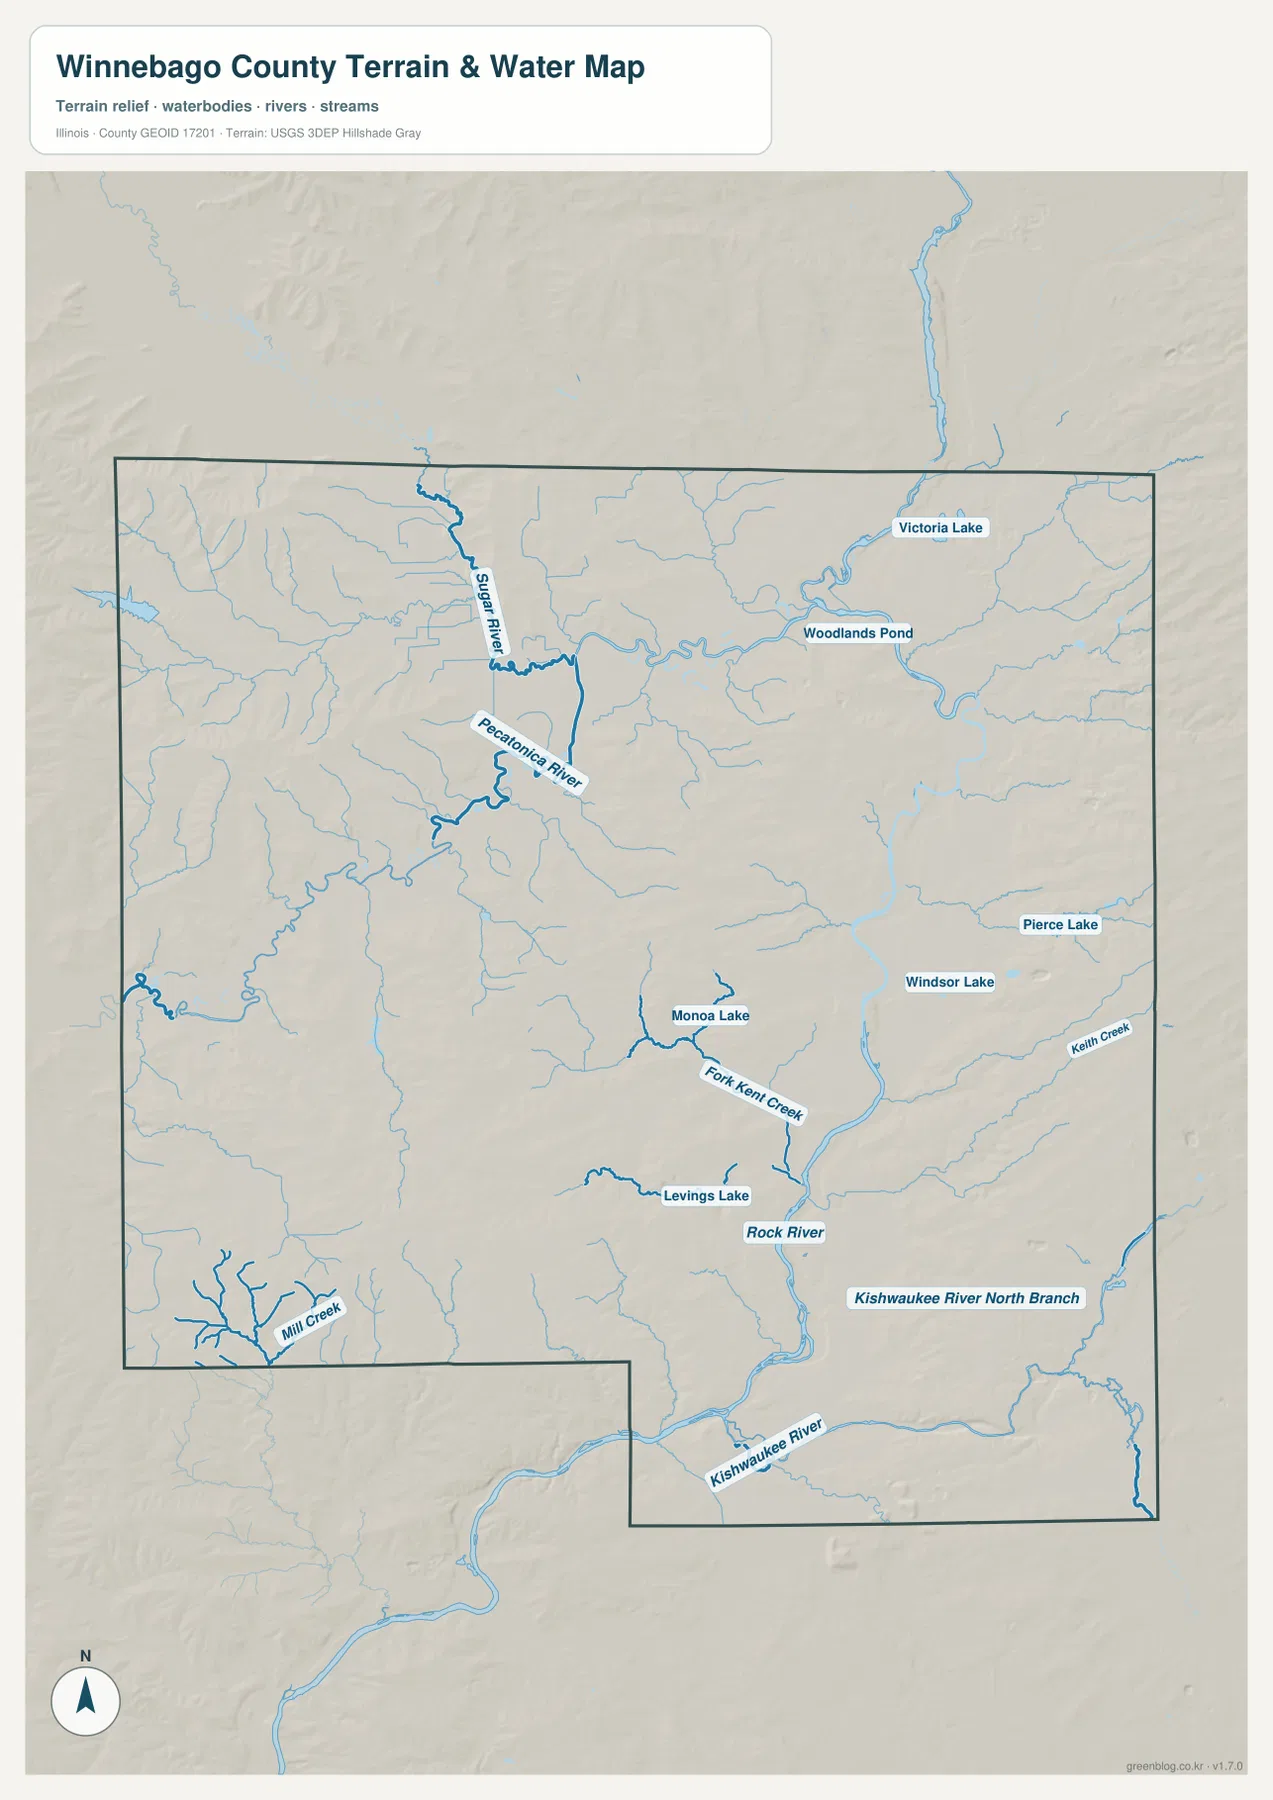
Several named lakes and ponds add local detail. Victoria Lake and Woodlands Pond appear in the northeast, Pierce Lake and Windsor Lake are farther east, Manoa Lake sits near the center, and Levings Lake is marked closer to the Rockford side of the county. These water bodies are much smaller than the main river corridors, but they are useful orientation points when comparing the water map with the settlement map. The Forest Preserves of Winnebago County also manages a large network of woods, wetlands, rivers, prairies, and ponds, which provides useful local context for the county’s many mapped waterways.
The water map should not be read as a flood-hazard, depth, navigation, parcel, or legal-boundary map. A thick blue line tells you where a major watercourse is emphasized; it does not tell you the probability of flooding or whether a channel is navigable. Use this graphic to understand the position and direction of the county’s rivers and lakes. For floodplain, engineering, water-quality, or navigation decisions, consult the current official source designed for that purpose.
The 206–303 m elevation range follows river valleys and higher western ridges
The elevation map gives an actual county range of about 206 to 303 meters, with a mean near 244 meters. Darker greens mark the lower ground, while yellow, tan, and brown identify progressively higher areas. The strongest low corridor follows the Rock River through the eastern half of the county, making the river valley visible even without the blue water layer. Another low belt crosses the south with the Kishwaukee River.
Higher terrain becomes more common in the west and southwest. Brown and tan ridges rise on both sides of the Pecatonica River valley, and the southwestern corner contains some of the most pronounced high ground on the map. The northwest also includes a sequence of elevated ridges, while parts of the eastern edge rise above the Rock River lowland. Winnebago County therefore has more topographic variation than a flat-county description would suggest.
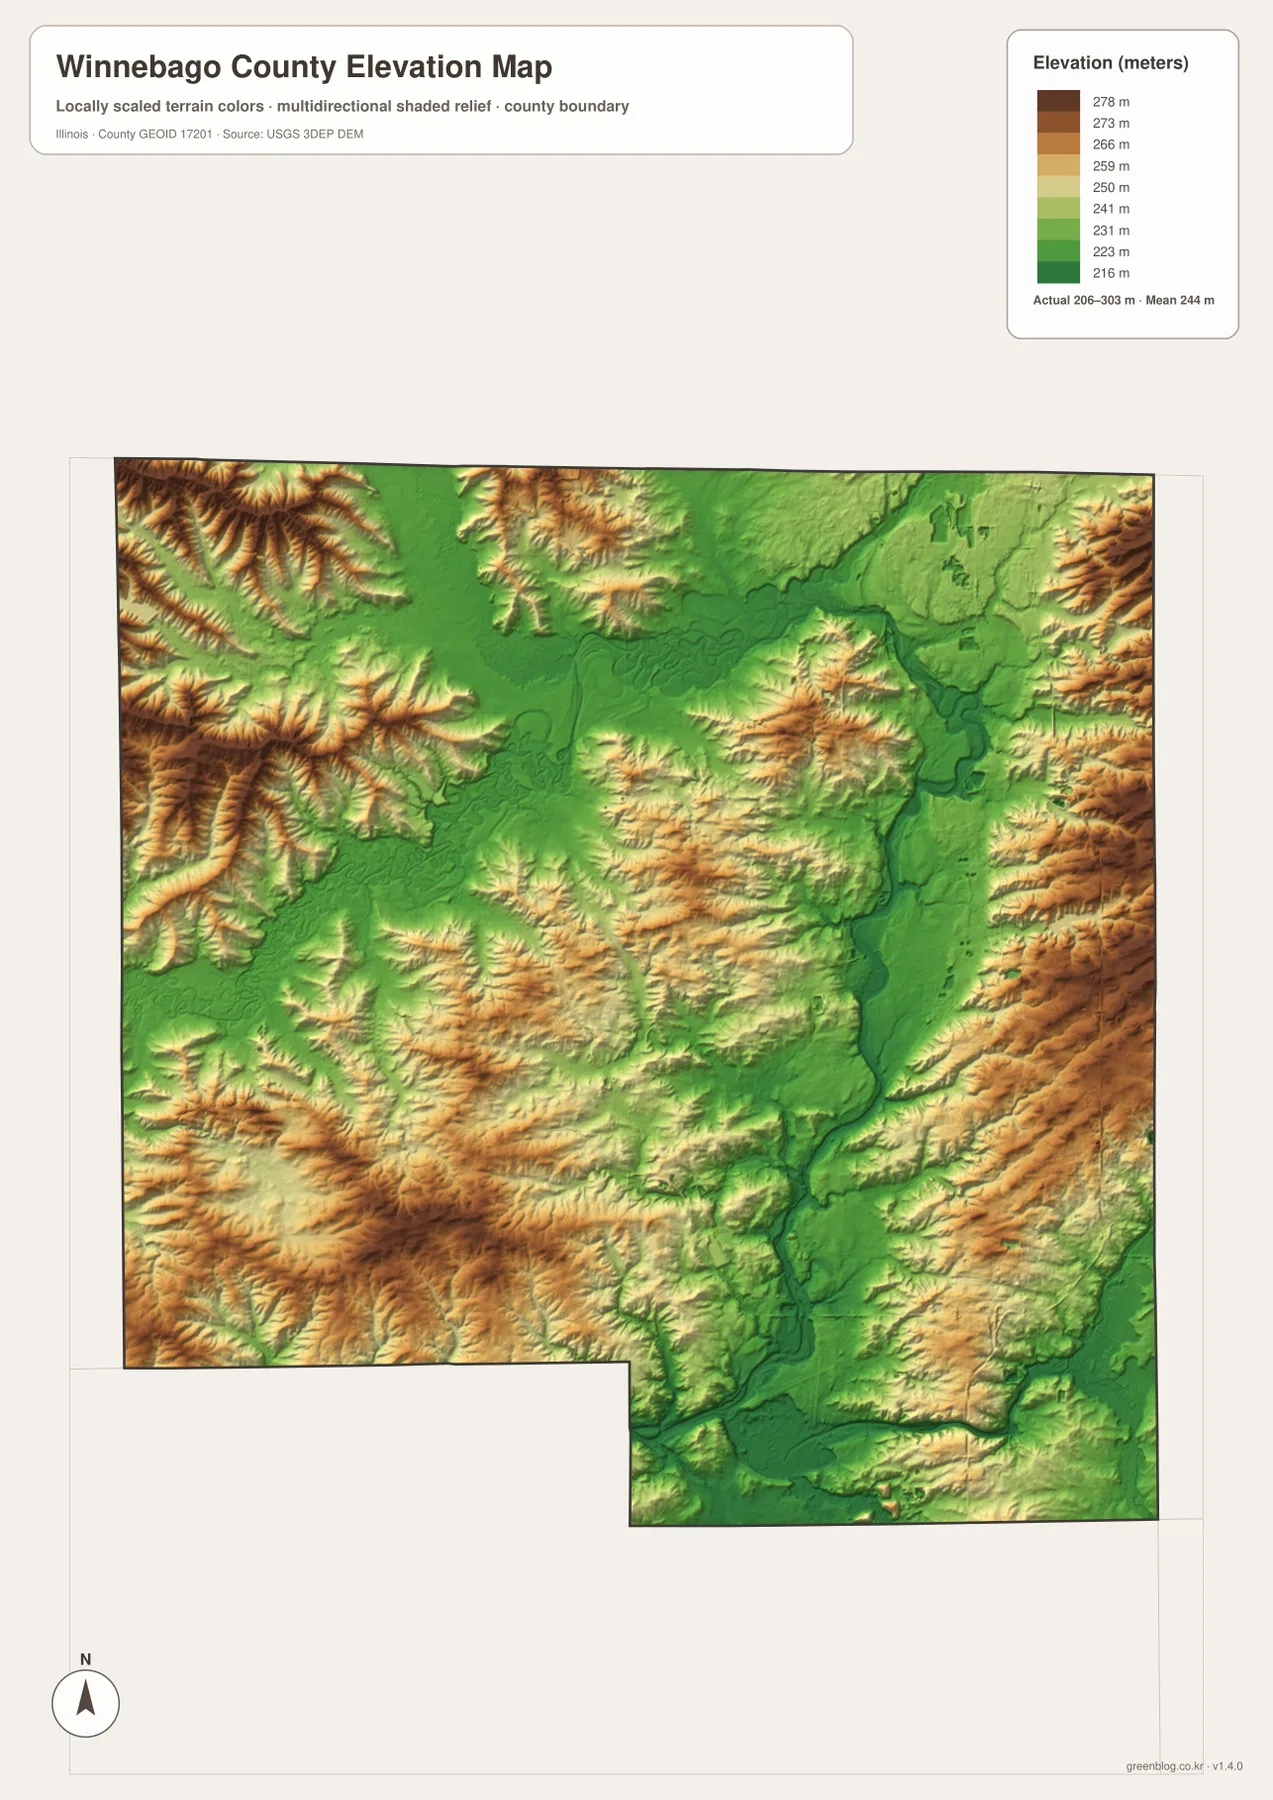
Comparing the elevation and water maps is especially useful in the west. The Pecatonica River traces a lower route between higher ridges, and the Sugar River occupies another low channel in the northwest. In the east, the Rock River runs through a broad green corridor that also contains much of the county’s largest urban area. The maps do not prove that terrain alone determined settlement, but they make it easy to see that the physical setting around Rockford differs from the ridge-and-valley pattern farther west.
This is a county-scale elevation surface, not survey-grade measurement for a particular property, road, bridge, or construction site. The 206–303 meter range is appropriate for understanding overall relief and the contrast between valleys and uplands. Engineering, drainage design, grading, or property-specific elevation work requires more detailed USGS data or a professional survey. For ordinary map reading, the county-wide color pattern is the useful part.
Choose the map by whether you need streets, cities, rivers, or relief
If your main question is how Rockford connects with Loves Park, Machesney Park, Roscoe, Rockton, South Beloit, or the western towns, start with the county map. It keeps the main roads, settlement labels, county outline, and nearby places together. The city-distribution map is better when you want a cleaner view of the six ranked communities without the surrounding road detail. Using those two maps in sequence is often faster than trying to read every label at once.
For the physical landscape, switch to the water map and elevation map. The water view separates the Rock, Pecatonica, Sugar, and Kishwaukee systems and labels several smaller lakes and creeks. The elevation map then shows which of those waterways occupy the lowest corridors and where the terrain rises around them. This pairing is particularly helpful west of Rockford, where river valleys weave through higher ridges, and along the southern Kishwaukee corridor.
The WebP images on the page are sized for quick viewing. The downloadable ZIP contains the corresponding original JPG maps at 2572 × 3638 pixels each, which is more convenient for zooming into labels or printing. Because each map emphasizes a different part of Winnebago County, it is usually better to keep all four files and choose the one that fits the task rather than expecting a single image to carry every detail.
Frequently Asked Questions
Which map is best for comparing Rockford with Loves Park, Machesney Park, and Roscoe?
Use the county map when you need roads as well as place names. It shows Rockford with Loves Park and Machesney Park immediately to the north and Roscoe and Rockton farther toward the state line. If you only need the relative positions of the major communities, the city-distribution map is cleaner because it highlights six ranked places without most of the road detail. Neither image provides live traffic conditions or travel times.
How do the Rock River and Pecatonica River differ on the county maps?
The Rock River forms the dominant north-south water corridor on the eastern side of Winnebago County and passes near the county’s largest concentration of cities. The Pecatonica River winds through the western and north-central portion, where settlement is more dispersed. The water map also shows the Sugar River and Kishwaukee River, while the elevation map reveals lower terrain following many of these river valleys.
Does the 206–303 m elevation range give the exact height of a property?
No. That range summarizes the county-wide terrain represented on this map. It is useful for comparing the lower Rock and Kishwaukee river corridors with higher ridges in the west and southwest, but it is not a survey for an individual parcel or structure. Property, engineering, drainage, and construction work should use detailed authoritative elevation data or a professional survey.
Map File Information
The ZIP contains the high-resolution JPG versions of the Winnebago County reference map, city-distribution map, terrain-and-water map, and elevation map shown on this page.
- Included Files: 4 high-resolution JPG maps
- Printable Size: 2572 × 3638 px each
Related Maps
Sources and References
- Winnebago County – official county government information
- Forest Preserves of Winnebago County – local preserves, rivers, wetlands, prairies, and ponds
- U.S. Census Bureau TIGER/Line Shapefiles – county boundaries, roads, and place references
- USGS National Hydrography – rivers, streams, and water features
- USGS 3D Elevation Program – elevation data
Green Map creates custom-edited map images using open geographic data sources such as geoBoundaries, Natural Earth, OpenStreetMap, and government open data.
These maps are edited visual materials, not raw data files, and are provided for education, documents, presentations, and graphic reference.