Industrial coal-related carbon dioxide emissions were highly concentrated across U.S. states in 2021. Adding the 50 states and the District of Columbia in the EIA state file gives 97.26 million metric tons of CO₂. Pennsylvania leads at 15.16 million metric tons, narrowly ahead of Indiana at 14.37 million. Together those two jurisdictions account for 30.4% of the state-row sum, while the top five account for 55.5%. The pattern makes U.S. industrial coal CO₂ emissions by state a concentration story as much as a ranking story.
The measure is narrower than total industrial greenhouse gas emissions and narrower than all energy-related emissions in a state. It is the coal component of EIA industrial-sector CO₂ emissions from energy consumption. EIA notes that the industrial sector includes industrial combined-heat-and-power plants and industrial electricity-only plants. The numbers therefore answer where energy-related CO₂ associated with industrial coal use was largest in 2021; they do not measure coal production, coal reserves, all manufacturing emissions, or the electricity sector as a whole.
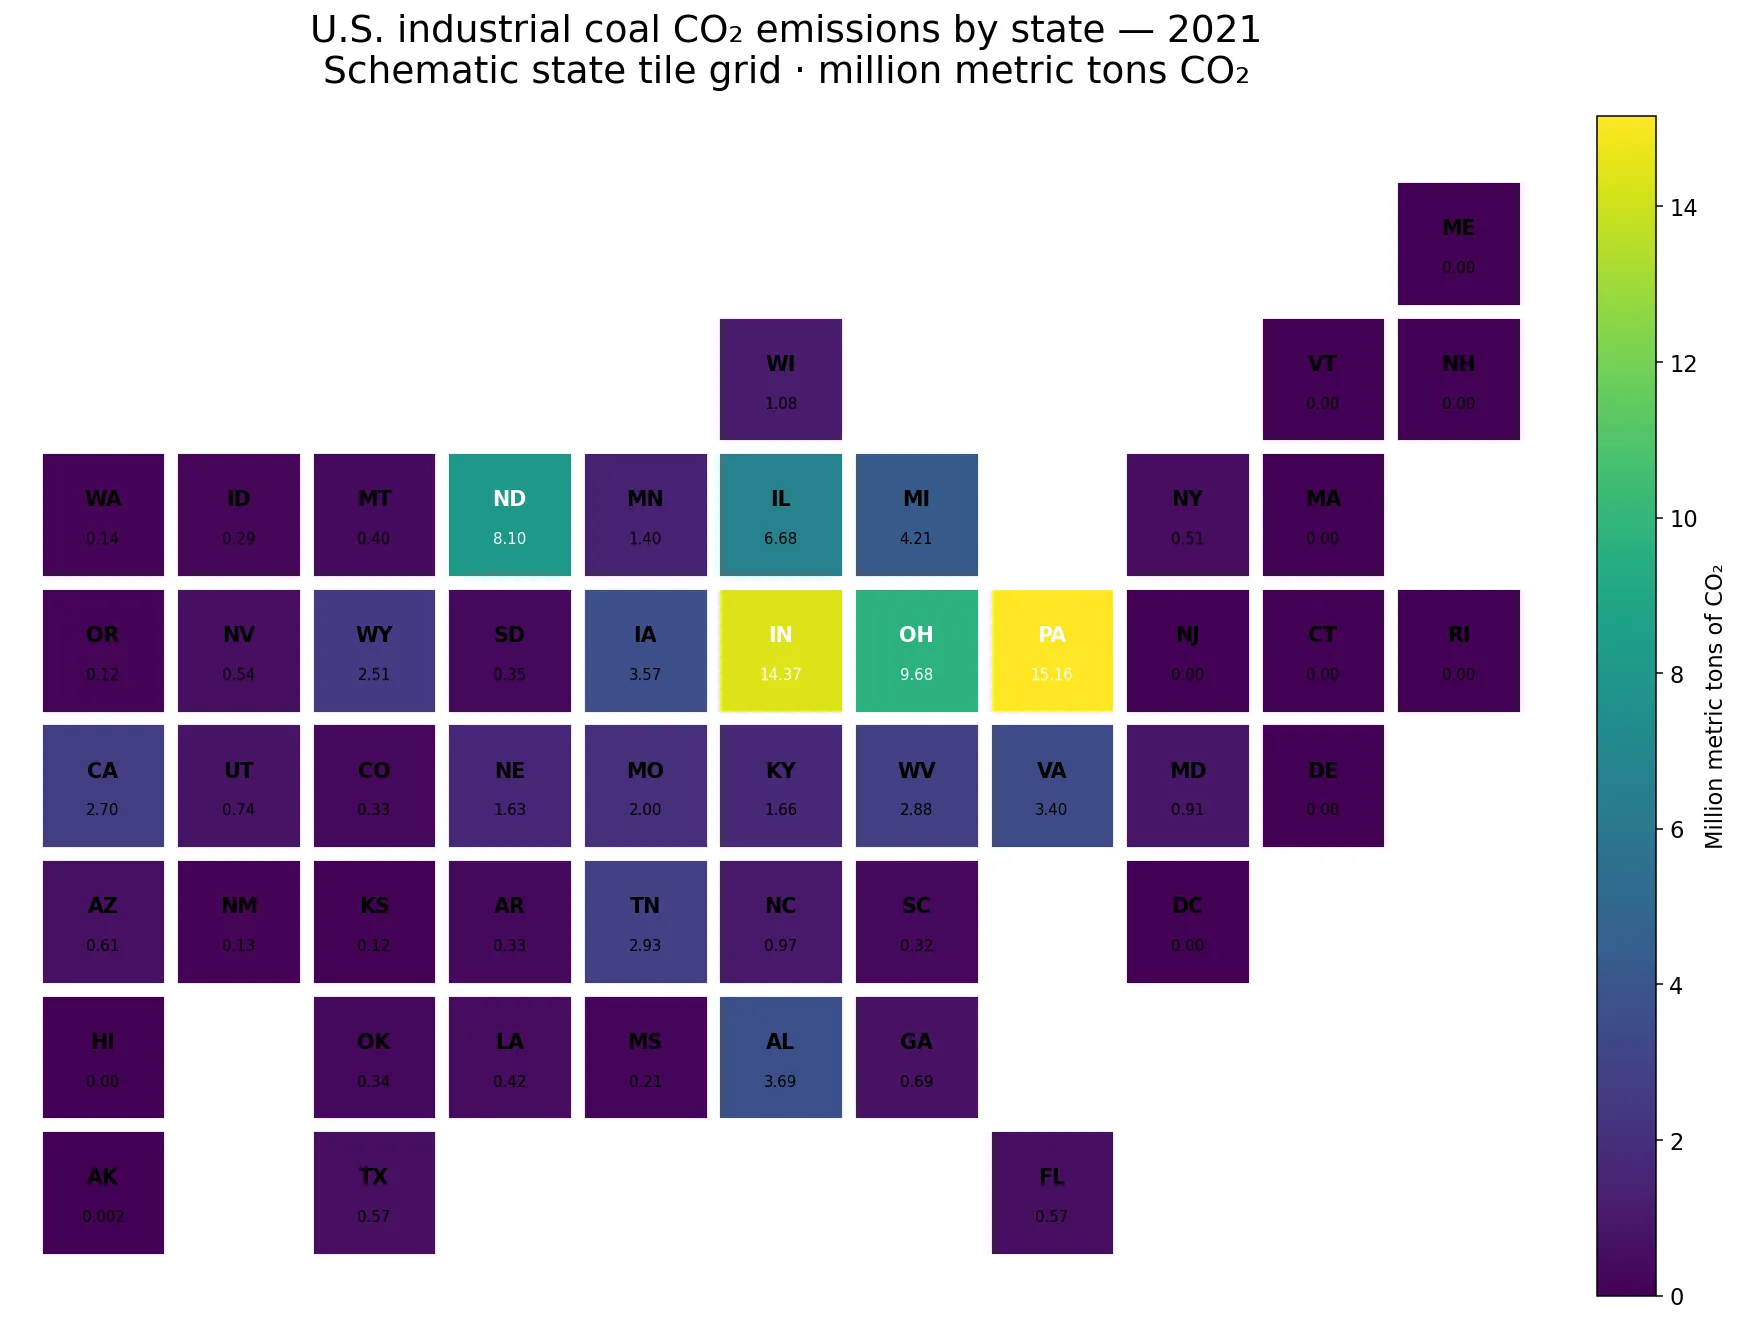
Table of Contents
Pennsylvania and Indiana stand apart at the top of the ranking
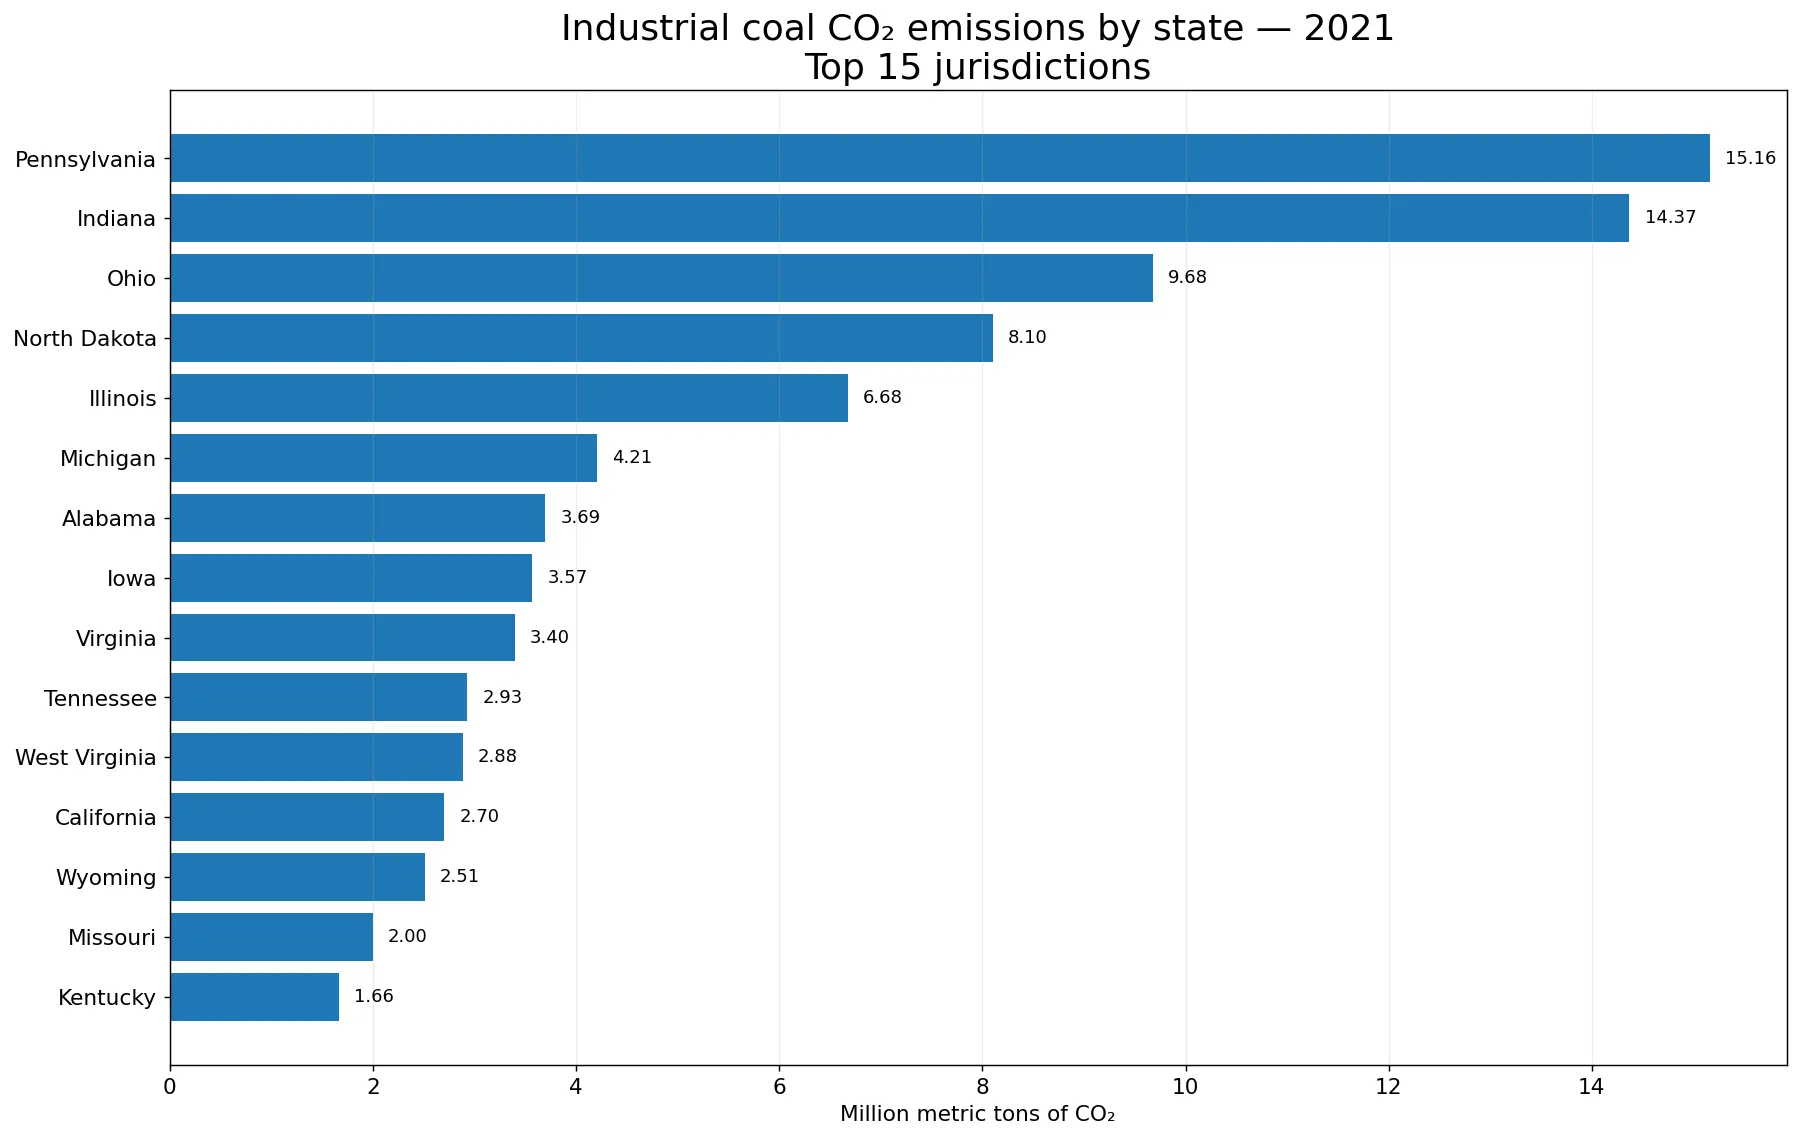
Pennsylvania records 15.16 million metric tons and Indiana 14.37 million, making them the only two jurisdictions above 10 million metric tons in the state file. Ohio is third at 9.68 million, followed by North Dakota at 8.10 million and Illinois at 6.68 million. The drop from Indiana to Ohio is about 4.69 million metric tons, so the top of the distribution is not a smooth staircase. The leading pair forms a distinct upper tier before the next group begins.
Michigan follows at 4.21 million metric tons, then Alabama at 3.69, Iowa at 3.57, Virginia at 3.40, and Tennessee at 2.93. West Virginia, California, and Wyoming are also above 2 million metric tons. These states have very different industrial profiles, which is a reason not to infer a single cause from the ranking. The file contains the outcome variable—coal-related industrial CO₂—not the plant mix, industrial output, technology, fuel switching history, or sector-specific production measures needed to explain why each state is high or low.
| Rank | State / jurisdiction | 2021 emissions (million metric tons CO₂) |
|---|---|---|
| 1 | Pennsylvania | 15.16 |
| 2 | Indiana | 14.37 |
| 3 | Ohio | 9.68 |
| 4 | North Dakota | 8.10 |
| 5 | Illinois | 6.68 |
| 6 | Michigan | 4.21 |
| 7 | Alabama | 3.69 |
| 8 | Iowa | 3.57 |
| 9 | Virginia | 3.40 |
| 10 | Tennessee | 2.93 |
| 11 | West Virginia | 2.88 |
| 12 | California | 2.70 |
| 13 | Wyoming | 2.51 |
| 14 | Missouri | 2.00 |
| 15 | Kentucky | 1.66 |
The top five account for 55.5% of the state-row sum
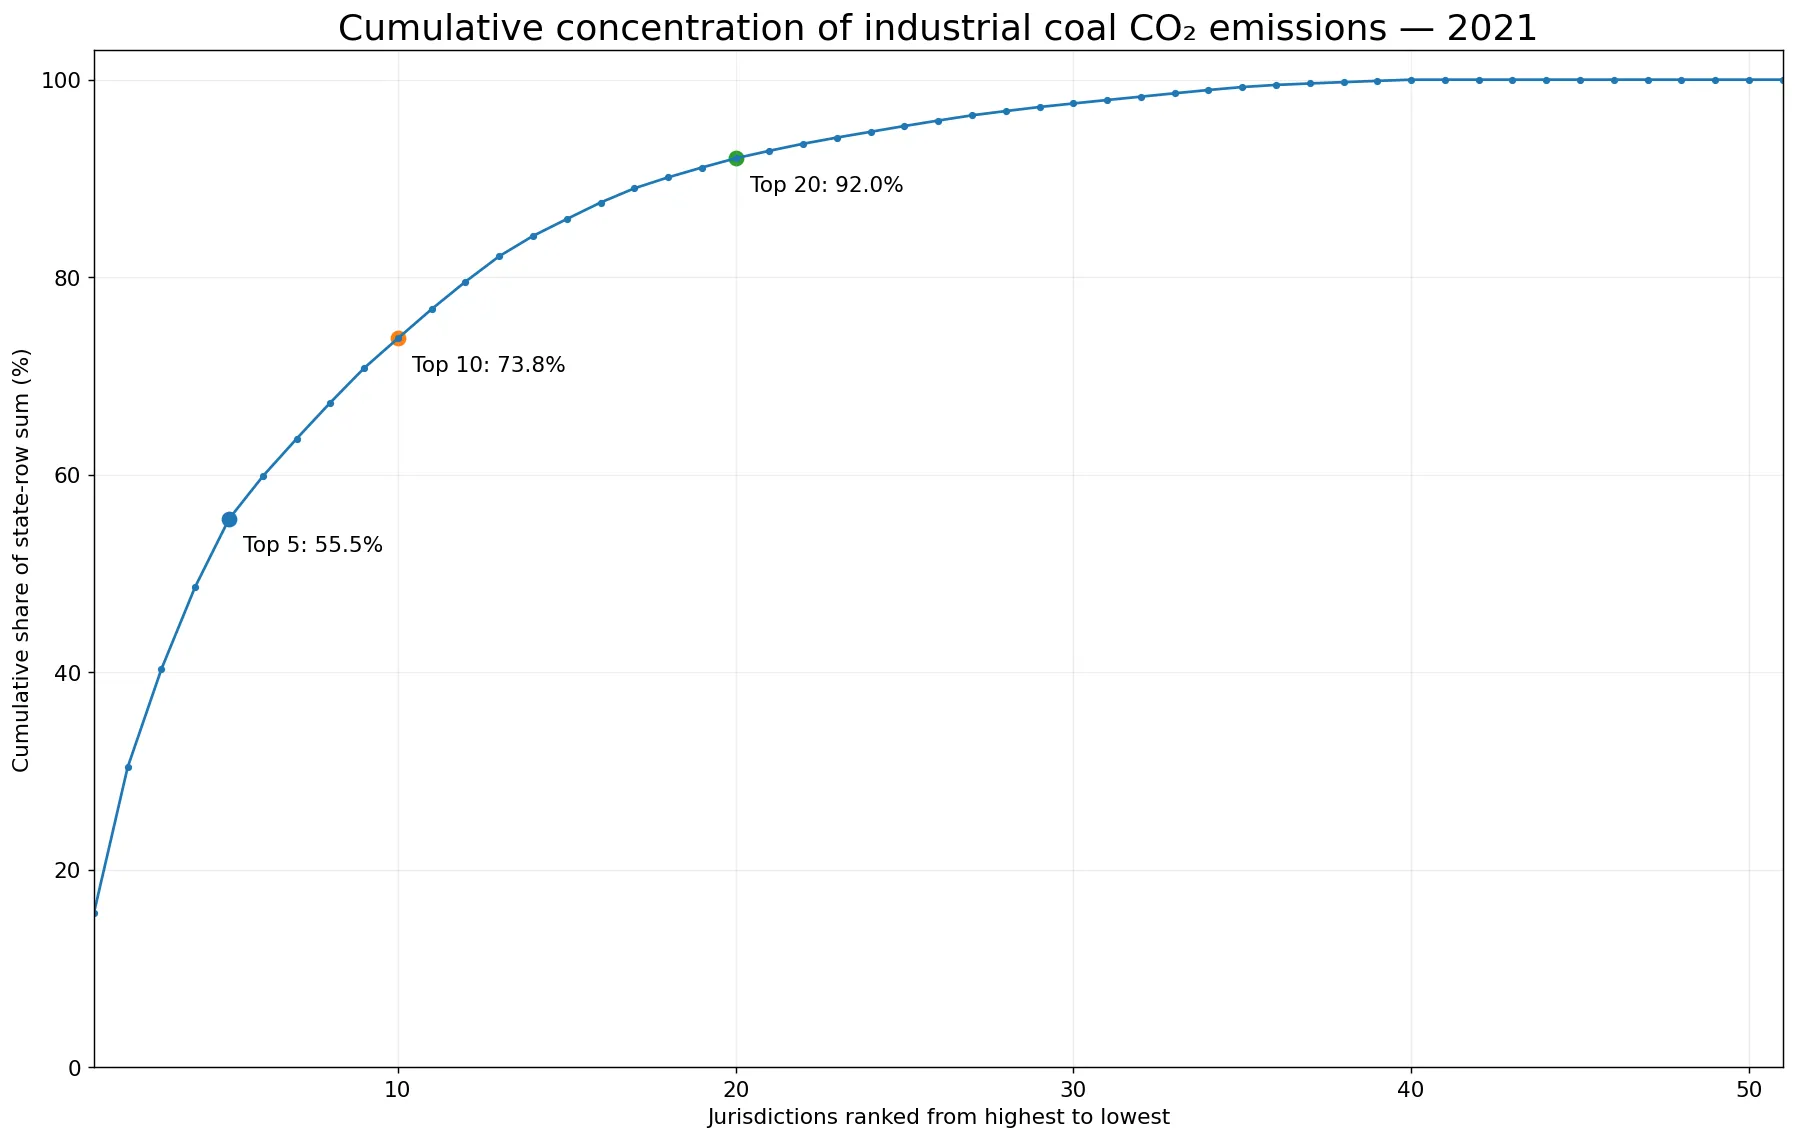
Concentration rises quickly when the states are sorted from highest to lowest. The top five contribute 55.5% of the 51-row sum, the top ten 73.8%, and the top twenty 92.0%. That means fewer than one-fifth of the jurisdictions—the top ten—account for almost three-quarters of the coal-related industrial CO₂ represented by the state rows. By the time the top twenty are included, only about 8.0% of the state-row total remains across the other 31 jurisdictions.
These shares are based on absolute emissions, not on population, industrial GDP, manufacturing value added, or physical output. A high position therefore does not automatically mean that a state has the highest emissions intensity. An intensity comparison would need an appropriate denominator. Here, the cumulative shares have a simpler purpose: they show how strongly U.S. industrial coal CO₂ emissions by state are concentrated in a relatively small group of jurisdictions.
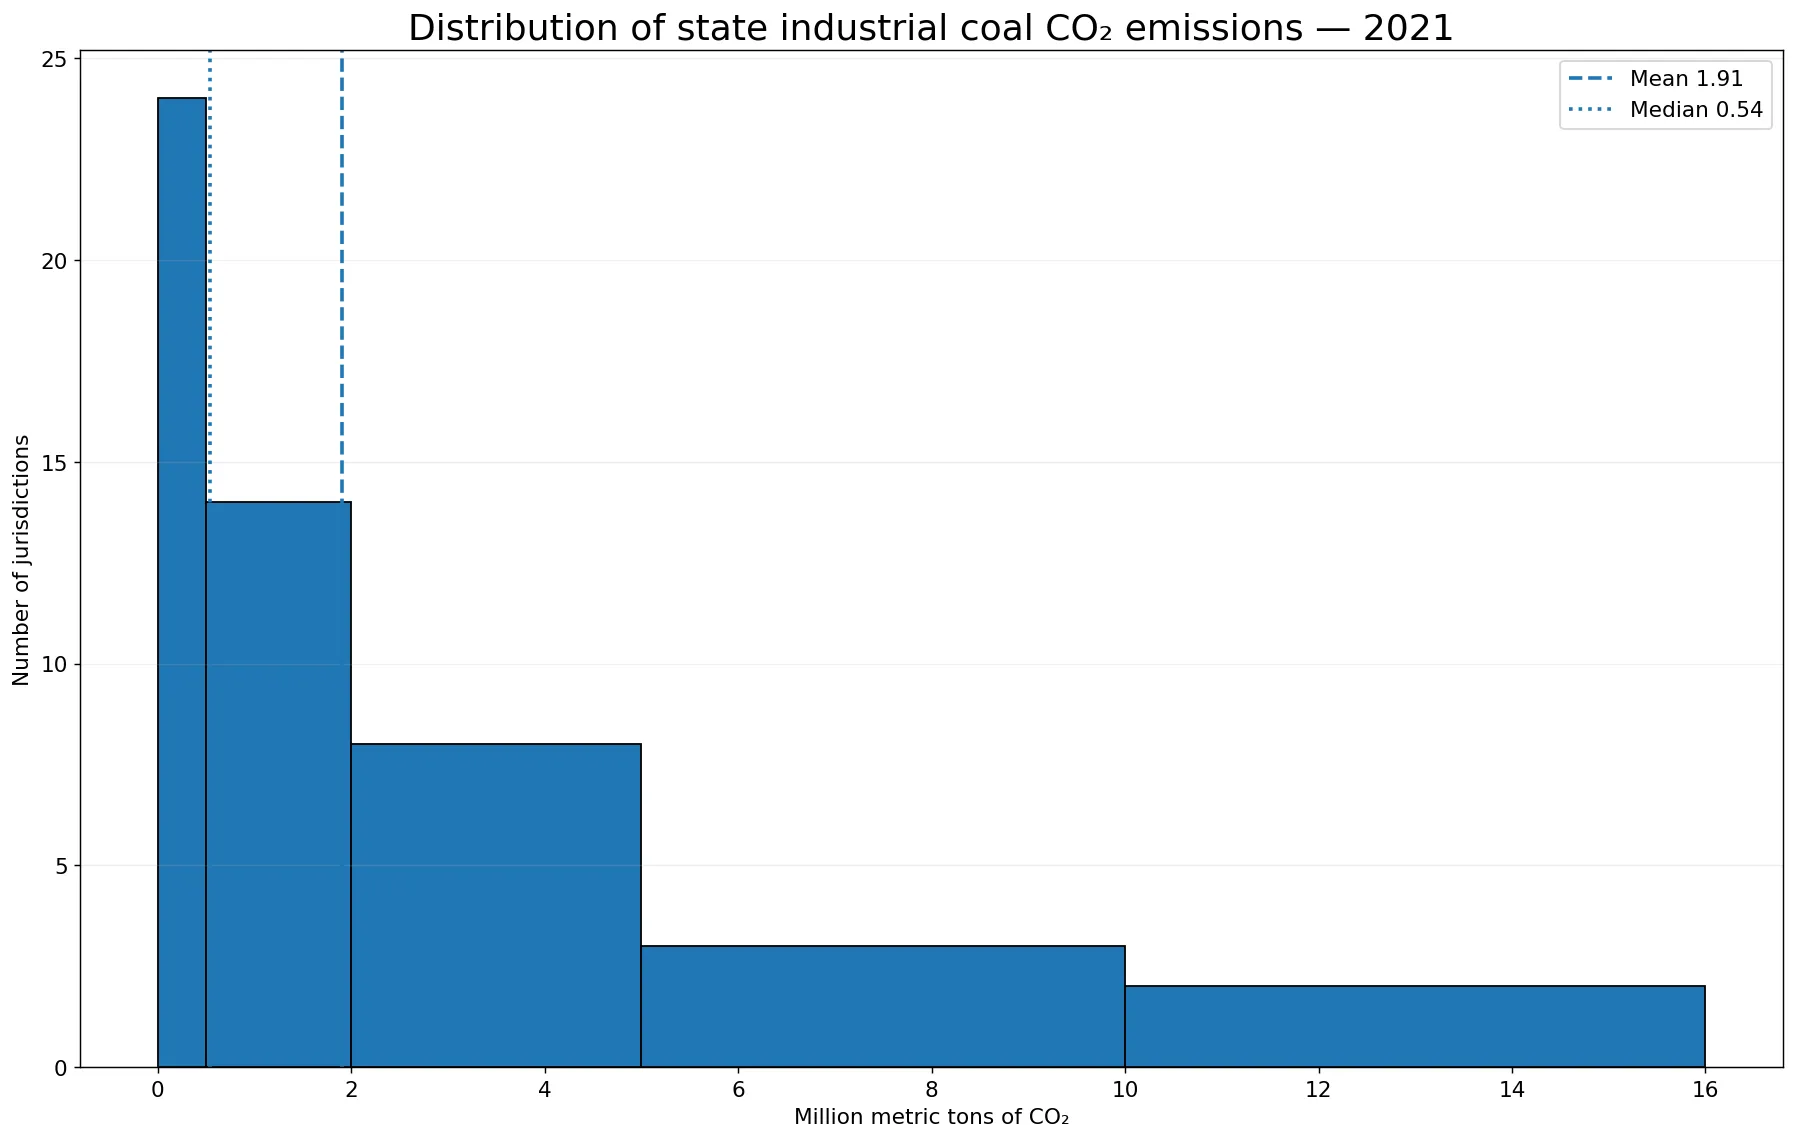
The 1.91 million-ton mean is far above the 0.54 million-ton median
The simple mean across the 51 jurisdictions is 1.91 million metric tons, while the median is only 0.54 million. The mean is about 3.5 times the median because a small number of large observations pull the average upward. The first quartile is 0.13 million metric tons and the third quartile is 2.25 million, so the middle half of the observations falls roughly between those two values. Pennsylvania alone is about 28.1 times the median.
The band counts tell the same story. There are 10 exact zeros, 14 positive observations below 0.5 million metric tons, 14 from 0.5 to below 2 million, 8 from 2 to below 5 million, 3 from 5 to below 10 million, and only 2 at 10 million or more. Nearly half of the jurisdictions are below 0.5 million metric tons, yet the leading two are near 15 million. A single average therefore overstates what a typical middle observation looks like.
| 2021 emissions band (million metric tons CO₂) | Jurisdictions |
|---|---|
| 0 | 10 |
| >0 to <0.5 | 14 |
| 0.5 to <2 | 14 |
| 2 to <5 | 8 |
| 5 to <10 | 3 |
| 10+ | 2 |
Ten reported zeros are observations, not missing data
Ten jurisdictions report exactly 0.0 in the 2021 file: Connecticut, District of Columbia, Delaware, Hawaii, Massachusetts, Maine, New Hampshire, New Jersey, Rhode Island, Vermont. There are no missing values among the 51 rows. That distinction matters because a numeric zero should remain in distributions and counts, whereas a missing value should not be silently converted to zero. EIA tables also distinguish no consumption from suppressed or very small quantities through their published notation, so treating every blank-looking case as the same category would distort the source.
The file also contains positive values very close to zero. Alaska is about 0.002 million metric tons, and several other states fall below 0.5 million. Examples include Alaska 0.00, Kansas 0.12, Oregon 0.12, New Mexico 0.13, Washington 0.14, Mississippi 0.21, Idaho 0.29, South Carolina 0.32 million metric tons. Those are not equivalent to an exact zero. Preserving the distinction between zero, near-zero, and missing values is especially important for maps or rankings because otherwise the lower end of the distribution becomes artificially flat.
The high-emission group clusters partly in the Midwest and Appalachia, but the dataset does not identify causes
Several of the largest observations lie in or near the industrial Midwest and Appalachia: Pennsylvania, Indiana, Ohio, Illinois, Michigan, and West Virginia all rank in the upper group. North Dakota is also prominent, while Alabama, Iowa, Virginia, Tennessee, California, and Wyoming add geographic variety. The state pattern is therefore spatially structured, but not confined to a single region. The tile grid is useful for seeing where values cluster, yet the geographic pattern by itself is not evidence of a specific causal mechanism.
EIA’s industrial definition is broader than a single manufacturing industry because it includes industrial CHP and industrial electricity-only plants. A high state value cannot be assigned to steel, cement, chemicals, mining, or any other industry without additional evidence. Facility-level emissions, fuel consumption by industry, or production data would be needed for that step. This article keeps the interpretation at the level the data can actually support: cross-state differences in coal-related industrial CO₂.
Why the 97.26 million-ton state sum is not the same as the EIA U.S. total of 91.718
Summing the 51 state and District of Columbia rows produces 97.260 million metric tons of CO₂. EIA’s U.S. industrial-sector table, however, reports 91.718 million metric tons for coal in 2021. The difference is about 5.542 million metric tons. This should not be treated as a failed calculation. EIA specifically notes that the U.S. total includes coal-coke net imports that are not allocated to the states, so the national series and the arithmetic sum of state rows are not required to match exactly.
That accounting distinction affects how percentages should be described. The top-five, top-ten, and top-twenty shares in this article use the 51-row sum as the denominator because they summarize the distribution of the state observations themselves. When citing the official national industrial coal total, the EIA U.S. series should be used instead. Mixing those denominators would create an apparent discrepancy where the source has already defined two different aggregation rules.
What this metric can—and cannot—tell you
The dataset directly supports rankings, distribution statistics, exact-zero counts, and concentration measures for industrial coal-related CO₂ in 2021. It can show that Pennsylvania and Indiana are the highest state observations, that the median is well below the mean, and that the leading states account for most of the state-row sum. It cannot, by itself, rank total industrial greenhouse gases, power-sector coal emissions, coal production, reserves, facility counts, or industrial productivity.
It is also a one-year cross-section. A 2021 ranking does not establish whether a state was rising or falling. EIA provides long time series, but this comparison deliberately holds every jurisdiction to the same year so geography is not mixed with timing. A trend analysis would require multiple years of the same coal-industrial series. The fixed-year design makes U.S. industrial coal CO₂ emissions by state easier to compare cleanly, but it is not a substitute for a transition timeline.
Data definition and calculation method
The primary source is the U.S. Energy Information Administration CO2 Emission Aggregates API and the State Energy Data System industrial-sector CO₂ tables. The slice fixes fuel to coal, sector to industrial, frequency to annual, and year to 2021. Units are million metric tons of CO₂. All 50 states plus the District of Columbia are present and numeric. Rankings, quartiles, band counts, cumulative shares, and all values used in the charts were calculated directly from those 51 observations.
EIA notes that the industrial sector includes industrial combined-heat-and-power and industrial electricity-only plants. It also notes that the U.S. total contains coal-coke net imports not allocated to states. Those definitions are essential for interpreting the data correctly. U.S. industrial coal CO₂ emissions by state should therefore be read as a geographic comparison of one fuel component within the industrial sector, not as a complete scorecard of industrial environmental performance.
Frequently Asked Questions
Which state had the highest industrial coal-related CO₂ emissions in 2021?
Pennsylvania was highest at about 15.16 million metric tons of CO₂, followed by Indiana at about 14.37 million.
Why does the 51-row state sum differ from EIA’s U.S. total?
EIA notes that the U.S. total includes coal-coke net imports that are not allocated to states. The national series therefore does not have to equal the arithmetic sum of the state rows.
Are the reported 0.0 values missing data?
No. All 51 rows are numeric in this dataset. Exact zeros are observations and should be kept separate from both missing values and very small positive values.
Does this measure total industrial greenhouse gas emissions?
No. It covers energy-related CO₂ associated with coal in the industrial sector. Other fuels, process emissions, and non-CO₂ greenhouse gases require separate datasets.
Related Articles
Industrial coal emissions and the share of electricity generated from coal, natural gas, or all fossil fuels answer different questions. These related Green Map articles provide fuel-mix context for the same 2021 reference year.
- Coal dependence in electricity: 2021 country comparison
- Fossil-fuel electricity share by country in 2021
- Natural gas share of electricity generation in 2021
Green Map creates custom-edited map images using open geographic data sources such as geoBoundaries, Natural Earth, OpenStreetMap, and government open data.
These maps are edited visual materials, not raw data files, and are provided for education, documents, presentations, and graphic reference.