The World Bank GDP price level index compares countries’ general GDP price levels using the relationship between purchasing power parity conversion factors and market exchange rates. In this series, the United States is set to 100. The latest non-empty file contains 204 observations, of which 185 are dated 2025, so the 2025 group provides a strong same-year basis for comparison.
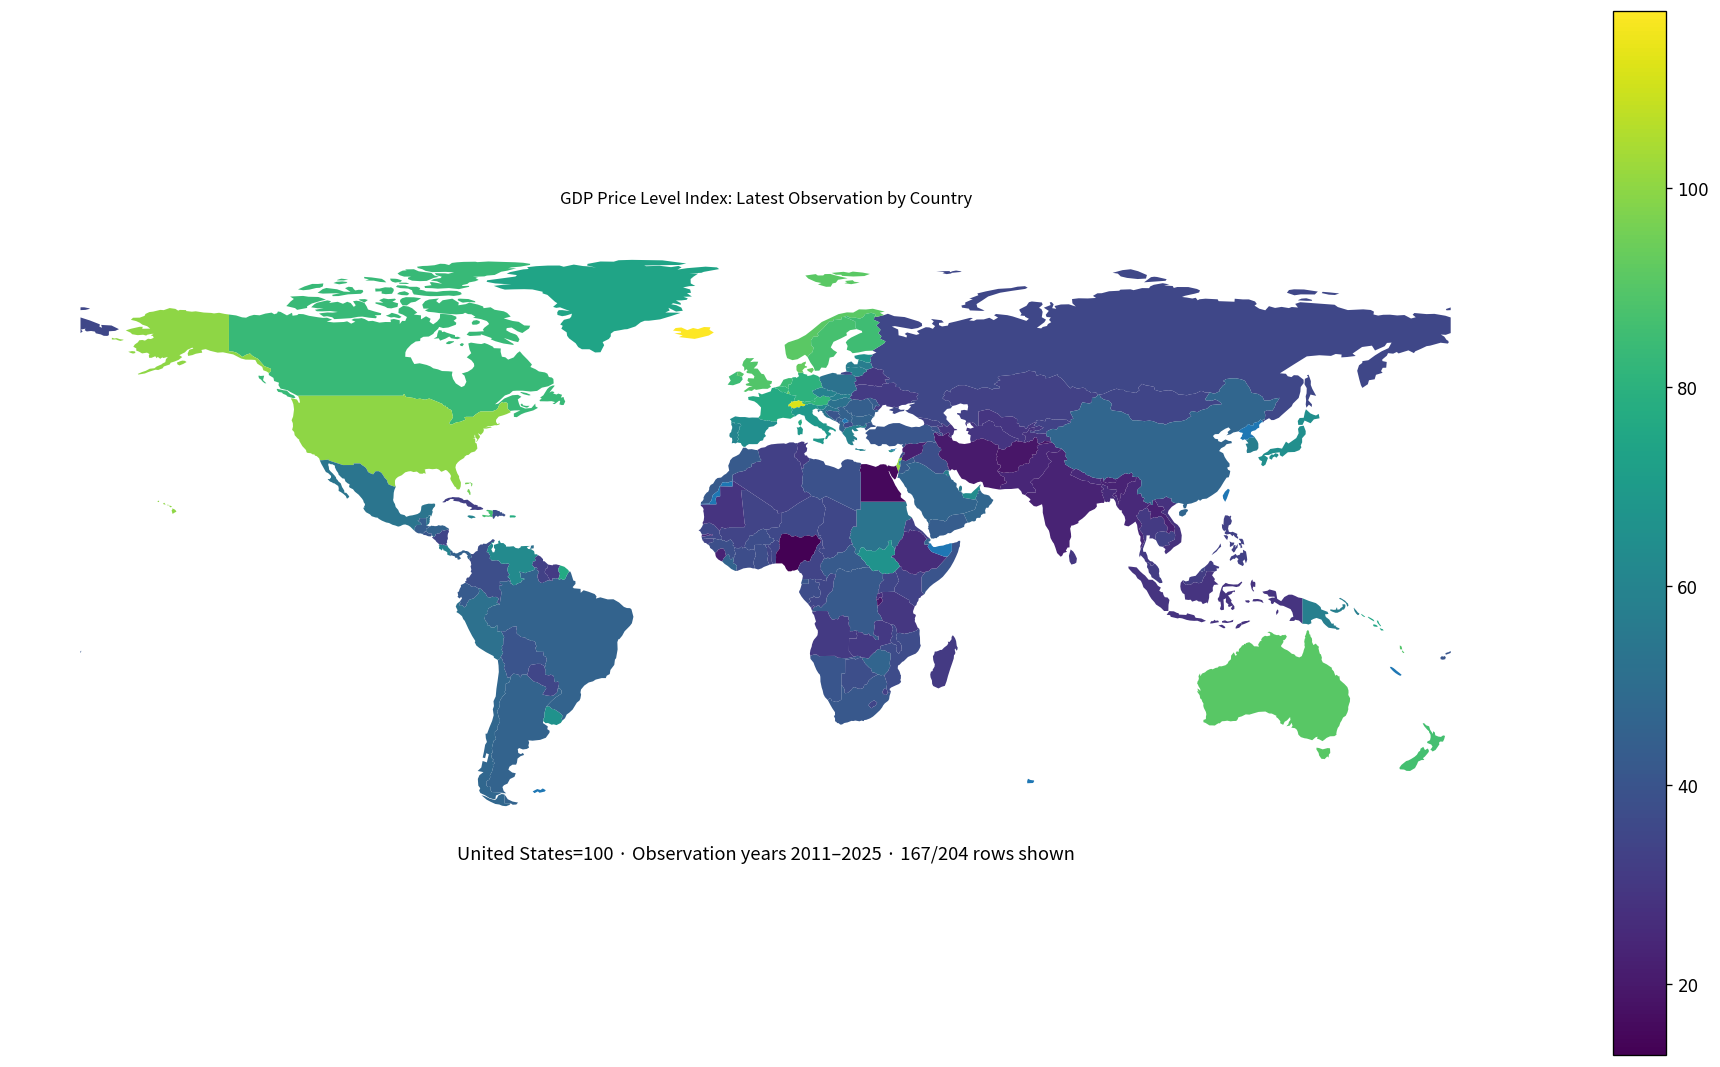
Table of Contents
What the GDP price level index means
The World Bank describes the price level index as the ratio of a PPP conversion factor to the corresponding market exchange rate, expressed relative to a base country set to 100. At the GDP level, it indicates differences in countries’ general price levels.
A value above 100 points toward a higher GDP-wide price level than the United States, while a value below 100 points toward a lower level. The interpretation is relative, not a direct price quote for a specific product or service.
This is not CPI inflation
The GDP price level index is not an inflation rate. Consumer-price inflation asks how much prices changed over time within an economy. The PLI asks how price levels compare across economies at a point in time.
A PLI of 40 does not mean inflation is 40%, and a PLI of 110 does not mean prices rose 10% during the year. A price level and a rate of change are different statistical concepts.
It is also not identical to a household cost-of-living index
This is a GDP-level measure. GDP includes household consumption but also government consumption, investment, and other components. A household cost-of-living comparison focuses more narrowly on the prices households face.
For travelers, migrants, or household purchasing-power questions, consumption-specific PPP measures can be more relevant. GDP PLI is better suited to broad macroeconomic price-level comparison.
The 2025 mean is 50.15 and the median is 43.42
The 2025 subset contains 185 economies. Its mean is 50.15 and median 43.42. The first quartile is 34.12 and the third quartile 63.02, placing the middle half roughly between 34.1 and 63.0.
6 observations are at or above the U.S. benchmark of 100, while 5 are strictly above 100. 30 are at least 75, 111 are below 50, and 12 are below 25.
Iceland is highest in 2025 at 117.85
Iceland records 117.85, followed by Switzerland at 111.96, Barbados at 109.54, Naoero at 103.09, and Israel at 101.04. The United States is exactly 100 by construction. Micronesia, Fed. Sts. is at 95.87, Marshall Islands 94.70, Luxembourg 94.07, and Denmark 92.49.
| 2025 rank | Economy/territory | GDP price level index |
|---|---|---|
| 1 | Iceland | 117.85 |
| 2 | Switzerland | 111.96 |
| 3 | Barbados | 109.54 |
| 4 | Naoero | 103.09 |
| 5 | Israel | 101.04 |
| 6 | United States | 100.00 |
| 7 | Micronesia, Fed. Sts. | 95.87 |
| 8 | Marshall Islands | 94.70 |
| 9 | Luxembourg | 94.07 |
| 10 | Denmark | 92.49 |
| 11 | Norway | 90.92 |
| 12 | Australia | 90.54 |
| 13 | Tuvalu | 89.38 |
| 14 | Vanuatu | 89.25 |
| 15 | United Kingdom | 89.16 |
| 16 | Sweden | 87.05 |
| 17 | New Zealand | 86.47 |
| 18 | Haiti | 85.97 |
| 19 | Finland | 85.22 |
| 20 | Ireland | 84.85 |
Values above 100 are valid. They indicate a GDP-wide price level estimated above the U.S. benchmark. They should not be paraphrased as proof that every consumer good costs the same percentage more than in the United States.
Nigeria is lowest in 2025 at 12.84
Nigeria records 12.84, followed by Egypt, Arab Rep. at 15.27, Burundi at 18.74, Iran, Islamic Rep. at 19.92, Lao PDR at 22.39, Sierra Leone at 22.77, Bhutan at 22.93, India at 23.00, Pakistan at 24.28, and Myanmar at 24.77.
| Low-order position in 2025 | Economy/territory | GDP price level index |
|---|---|---|
| 1 | Nigeria | 12.84 |
| 2 | Egypt, Arab Rep. | 15.27 |
| 3 | Burundi | 18.74 |
| 4 | Iran, Islamic Rep. | 19.92 |
| 5 | Lao PDR | 22.39 |
| 6 | Sierra Leone | 22.77 |
| 7 | Bhutan | 22.93 |
| 8 | India | 23.00 |
| 9 | Pakistan | 24.28 |
| 10 | Myanmar | 24.77 |
| 11 | Gambia, The | 24.80 |
| 12 | Nepal | 24.87 |
| 13 | Bangladesh | 25.58 |
| 14 | Ethiopia | 25.75 |
| 15 | Rwanda | 26.98 |
| 16 | Tajikistan | 27.64 |
| 17 | Timor-Leste | 27.88 |
| 18 | Viet Nam | 28.01 |
| 19 | Azerbaijan | 28.38 |
| 20 | Mauritania | 28.63 |
A low PLI means the general GDP price level is low relative to the U.S. benchmark. It does not directly rank income, prosperity, welfare, or the quality of goods and services.
The indicator connects PPP and market exchange rates
Purchasing power parity conversion factors are designed to compare equivalent real volumes across economies. Market exchange rates reflect currency prices in foreign-exchange markets. When the two differ substantially, dollar values converted at market exchange rates can differ greatly from local purchasing power.
This helps explain why GDP per capita rankings can change when moving from current U.S. dollars to PPP-adjusted international dollars. The PLI summarizes the price-level side of that difference.
A low PLI does not automatically mean a currency is undervalued
It is tempting to treat a gap between PPP and the market exchange rate as a direct valuation signal for a currency. That is too strong. Exchange rates are influenced by interest rates, capital flows, trade, risk, policy, and other forces.
The PLI is a price-level comparison, not an official fair-value exchange-rate model. Currency valuation requires additional evidence such as real effective exchange rates, productivity, external balances, and financial conditions.
Most latest observations are from 2025
Of the 204 latest non-empty observations, 185 are from 2025, or about 90.7%. There are 10 from 2024, 2 from 2023, 2 from 2022, and 2 from 2021, with a few older latest observations.
| Observation year | Economies/territories | Share of 204 |
|---|---|---|
| 2025 | 185 | 90.7% |
| 2024 | 10 | 4.9% |
| 2023 | 2 | 1.0% |
| 2022 | 2 | 1.0% |
| 2021 | 2 | 1.0% |
| 2013 | 1 | 0.5% |
| 2011 | 2 | 1.0% |
The latest-value collection is unusually recent compared with many international indicators, but it is still not perfectly synchronized. Same-year averages and rankings are therefore calculated from the 185 observations dated 2025.
The map displays 167 economies in the low-resolution boundary file
The featured map uses all 204 latest source observations, while 167, or about 81.9%, match polygons in the low-resolution world boundary file. Small islands and territories without polygons remain in the complete table.
The map is best used for regional patterns. Exact values for small economies such as Barbados, Naoero, and Pacific island states should be read from the tables because boundary coverage is incomplete.
Market exchange rates alone can distort cross-country purchasing-power comparisons
Converting local prices or GDP at market exchange rates does not fully account for differences in domestic price levels. PPP conversion factors are designed to compare equivalent real quantities across countries.
GDP PLI is useful because it shows the relative gap between the PPP conversion factor and the market exchange rate. It is therefore an important companion to PPP-based GDP comparisons.
Time trends require a country-level series
PLI can move from year to year as domestic prices, exchange rates, and PPP estimates change. This file contains only the latest non-empty observation for each economy and is not designed to calculate long-run change.
To determine whether an economy has become more or less expensive relative to the United States, the correct approach is to follow the same country’s PLI through time.
Complete list of the 204 latest observations
The table below lists each economy and territory’s latest non-empty observation in alphabetical order. Most observations are from 2025; older rows retain their actual year.
| Economy/territory | Observation year | GDP price level index |
|---|---|---|
| Afghanistan | 2024 | 18.64 |
| Albania | 2025 | 46.06 |
| Algeria | 2025 | 32.56 |
| Andorra | 2025 | 68.23 |
| Angola | 2025 | 30.53 |
| Antigua and Barbuda | 2025 | 69.26 |
| Argentina | 2025 | 45.72 |
| Armenia | 2025 | 38.27 |
| Aruba | 2024 | 74.63 |
| Australia | 2025 | 90.54 |
| Austria | 2025 | 81.96 |
| Azerbaijan | 2025 | 28.38 |
| Bahamas, The | 2024 | 95.63 |
| Bahrain | 2025 | 43.10 |
| Bangladesh | 2025 | 25.58 |
| Barbados | 2025 | 109.54 |
| Belarus | 2025 | 29.61 |
| Belgium | 2025 | 81.35 |
| Belize | 2025 | 52.56 |
| Benin | 2025 | 34.43 |
| Bermuda | 2024 | 119.81 |
| Bhutan | 2025 | 22.93 |
| Bolivia | 2025 | 39.99 |
| Bosnia and Herzegovina | 2025 | 40.22 |
| Botswana | 2025 | 37.58 |
| Brazil | 2025 | 45.72 |
| Brunei Darussalam | 2025 | 34.87 |
| Bulgaria | 2025 | 45.73 |
| Burkina Faso | 2025 | 37.36 |
| Burundi | 2025 | 18.74 |
| Cabo Verde | 2025 | 47.65 |
| Cambodia | 2025 | 33.62 |
| Cameroon | 2025 | 34.08 |
| Canada | 2025 | 83.45 |
| Cayman Islands | 2024 | 113.11 |
| Central African Republic | 2025 | 42.33 |
| Chad | 2025 | 35.22 |
| Chile | 2025 | 47.64 |
| China | 2025 | 47.26 |
| Colombia | 2025 | 37.82 |
| Comoros | 2025 | 48.50 |
| Congo, Dem. Rep. | 2025 | 42.02 |
| Congo, Rep. | 2025 | 34.69 |
| Costa Rica | 2025 | 59.06 |
| Cote d’Ivoire | 2025 | 37.16 |
| Croatia | 2025 | 53.20 |
| Cuba | 2011 | 32.19 |
| Curacao | 2024 | 69.74 |
| Cyprus | 2025 | 64.71 |
| Czechia | 2025 | 59.38 |
| Denmark | 2025 | 92.49 |
| Djibouti | 2025 | 46.21 |
| Dominica | 2025 | 48.38 |
| Dominican Republic | 2025 | 38.51 |
| Ecuador | 2025 | 42.52 |
| Egypt, Arab Rep. | 2025 | 15.27 |
| El Salvador | 2025 | 40.90 |
| Equatorial Guinea | 2025 | 41.00 |
| Eritrea | 2021 | 32.76 |
| Estonia | 2025 | 66.05 |
| Eswatini | 2025 | 32.79 |
| Ethiopia | 2025 | 25.75 |
| Faroe Islands | 2024 | 90.36 |
| Fiji | 2025 | 40.65 |
| Finland | 2025 | 85.22 |
| France | 2025 | 76.57 |
| Gabon | 2025 | 37.19 |
| Gambia, The | 2025 | 24.80 |
| Georgia | 2025 | 32.95 |
| Germany | 2025 | 80.23 |
| Ghana | 2025 | 37.83 |
| Greece | 2025 | 59.54 |
| Greenland | 2023 | 74.14 |
| Grenada | 2025 | 56.72 |
| Guatemala | 2025 | 43.42 |
| Guinea | 2025 | 38.04 |
| Guinea-Bissau | 2025 | 34.12 |
| Guyana | 2025 | 33.11 |
| Haiti | 2025 | 85.97 |
| Honduras | 2025 | 45.71 |
| Hong Kong SAR, China | 2025 | 70.85 |
| Hungary | 2025 | 51.98 |
| Iceland | 2025 | 117.85 |
| India | 2025 | 23.00 |
| Indonesia | 2025 | 28.65 |
| Iran, Islamic Rep. | 2025 | 19.92 |
| Iraq | 2025 | 37.92 |
| Ireland | 2025 | 84.85 |
| Israel | 2025 | 101.04 |
| Italy | 2025 | 68.96 |
| Jamaica | 2025 | 60.21 |
| Japan | 2025 | 64.87 |
| Jordan | 2025 | 42.34 |
| Kazakhstan | 2025 | 33.17 |
| Kenya | 2025 | 33.68 |
| Kiribati | 2025 | 65.00 |
| Korea, Rep. | 2025 | 57.39 |
| Kosovo | 2025 | 41.01 |
| Kuwait | 2025 | 57.22 |
| Kyrgyz Republic | 2025 | 33.42 |
| Lao PDR | 2025 | 22.39 |
| Latvia | 2025 | 57.03 |
| Lebanon | 2024 | 37.54 |
| Lesotho | 2025 | 34.20 |
| Liberia | 2025 | 46.20 |
| Libya | 2025 | 39.03 |
| Lithuania | 2025 | 57.99 |
| Luxembourg | 2025 | 94.07 |
| Macao SAR, China | 2025 | 55.39 |
| Madagascar | 2025 | 30.69 |
| Malawi | 2025 | 35.36 |
| Malaysia | 2025 | 31.63 |
| Maldives | 2025 | 51.18 |
| Mali | 2025 | 34.07 |
| Malta | 2025 | 66.34 |
| Marshall Islands | 2025 | 94.70 |
| Mauritania | 2025 | 28.63 |
| Mauritius | 2025 | 38.59 |
| Mexico | 2025 | 53.69 |
| Micronesia, Fed. Sts. | 2025 | 95.87 |
| Moldova | 2025 | 43.12 |
| Mongolia | 2025 | 34.18 |
| Montenegro | 2025 | 41.83 |
| Morocco | 2025 | 42.05 |
| Mozambique | 2025 | 36.92 |
| Myanmar | 2025 | 24.77 |
| Namibia | 2025 | 40.68 |
| Naoero | 2025 | 103.09 |
| Nepal | 2025 | 24.87 |
| Netherlands | 2025 | 84.38 |
| New Zealand | 2025 | 86.47 |
| Nicaragua | 2025 | 34.18 |
| Niger | 2025 | 35.61 |
| Nigeria | 2025 | 12.84 |
| North Macedonia | 2025 | 37.43 |
| Norway | 2025 | 90.92 |
| Oman | 2025 | 47.16 |
| Pakistan | 2025 | 24.28 |
| Palau | 2025 | 84.73 |
| Panama | 2025 | 45.08 |
| Papua New Guinea | 2025 | 57.90 |
| Paraguay | 2025 | 34.82 |
| Peru | 2025 | 51.47 |
| Philippines | 2025 | 33.16 |
| Poland | 2025 | 52.37 |
| Portugal | 2025 | 60.37 |
| Puerto Rico (US) | 2025 | 77.82 |
| Qatar | 2025 | 56.27 |
| Romania | 2025 | 44.28 |
| Russian Federation | 2025 | 35.40 |
| Rwanda | 2025 | 26.98 |
| Samoa | 2025 | 63.02 |
| San Marino | 2023 | 75.97 |
| Sao Tome and Principe | 2025 | 63.93 |
| Saudi Arabia | 2025 | 46.81 |
| Senegal | 2025 | 35.78 |
| Serbia | 2025 | 45.01 |
| Seychelles | 2025 | 54.25 |
| Sierra Leone | 2025 | 22.77 |
| Singapore | 2025 | 60.49 |
| Sint Maarten (Dutch part) | 2025 | 76.08 |
| Slovak Republic | 2025 | 57.89 |
| Slovenia | 2025 | 63.09 |
| Solomon Islands | 2025 | 74.84 |
| Somalia, Fed. Rep. | 2025 | 40.25 |
| South Africa | 2025 | 41.48 |
| South Sudan | 2021 | 66.64 |
| Spain | 2025 | 64.52 |
| Sri Lanka | 2025 | 29.31 |
| St. Kitts and Nevis | 2025 | 68.58 |
| St. Lucia | 2025 | 51.43 |
| St. Vincent and the Grenadines | 2025 | 55.10 |
| Sudan | 2025 | 53.12 |
| Suriname | 2025 | 31.21 |
| Sweden | 2025 | 87.05 |
| Switzerland | 2025 | 111.96 |
| Syrian Arab Republic | 2022 | 21.54 |
| Tajikistan | 2025 | 27.64 |
| Tanzania | 2025 | 29.50 |
| Thailand | 2025 | 30.69 |
| Timor-Leste | 2025 | 27.88 |
| Togo | 2025 | 33.92 |
| Tonga | 2025 | 75.47 |
| Trinidad and Tobago | 2025 | 51.10 |
| Tunisia | 2025 | 30.57 |
| Turkiye | 2025 | 41.07 |
| Turkmenistan | 2025 | 28.94 |
| Turks and Caicos Islands | 2024 | 98.68 |
| Tuvalu | 2025 | 89.38 |
| Uganda | 2025 | 34.59 |
| Ukraine | 2025 | 31.03 |
| United Arab Emirates | 2024 | 63.36 |
| United Kingdom | 2025 | 89.16 |
| United States | 2025 | 100.00 |
| Uruguay | 2025 | 65.81 |
| Uzbekistan | 2025 | 29.18 |
| Vanuatu | 2025 | 89.25 |
| Venezuela, RB | 2011 | 62.50 |
| Viet Nam | 2025 | 28.01 |
| Virgin Islands (U.S.) | 2022 | 89.02 |
| West Bank and Gaza | 2025 | 63.43 |
| Yemen, Rep. | 2013 | 43.57 |
| Zambia | 2025 | 30.09 |
| Zimbabwe | 2025 | 46.70 |
How to interpret the comparison
First, the United States is the base at 100. Second, this is not CPI inflation. Third, it is a GDP-wide price-level measure rather than a household-only cost-of-living index. Fourth, low values do not directly rank welfare or income.
Fifth, the PLI is not a currency fair-value model. Sixth, although 185 of 204 observations are from 2025, a small number of rows come from earlier years and should be read with their observation dates.
Source and calculation
The source is World Bank World Development Indicators PA.NUS.GDP.PLI, Price level index (GDP). The 2025 mean, median, quartiles, and rankings are calculated only from the 185 observations dated 2025. The map and complete table use the latest non-empty value for all 204 economies.
Frequently Asked Questions
What does 100 mean in the GDP price level index?
The United States is the base country at 100. Values above 100 indicate a higher GDP-wide price level relative to the U.S. benchmark, and values below 100 a lower one.
Is this an inflation rate?
No. It compares price levels across economies rather than measuring how prices changed over time within one economy.
What is the 2025 median?
The median across the 185 observations dated 2025 is 43.42, while the mean is 50.15.
Related Articles
Green Map creates custom-edited map images using open geographic data sources such as geoBoundaries, Natural Earth, OpenStreetMap, and government open data. These maps are edited visual materials, not raw data files, and are provided for education, documents, presentations, and graphic reference.