World Bank indicator TM.VAL.AGRI.ZS.UN has a reported 2024 value for 131 countries and territories inside a 217-economy comparison frame. The other 86 economies are source-missing and remain no data. Among the 131 reported values, the unweighted mean is 1.11% of merchandise imports and the median is 0.96%. Pakistan has the highest observation at 4.34% and Brunei Darussalam the lowest at 0.053%.
Agricultural raw materials do not mean all agricultural or food imports. The World Bank definition uses SITC Revision 3 section 2 for crude materials, inedible, except fuels, while excluding oil-seeds and oleaginous fruits, selected crude fertilizers and minerals, and metalliferous ores and scrap. The denominator is merchandise imports, so services are not included.
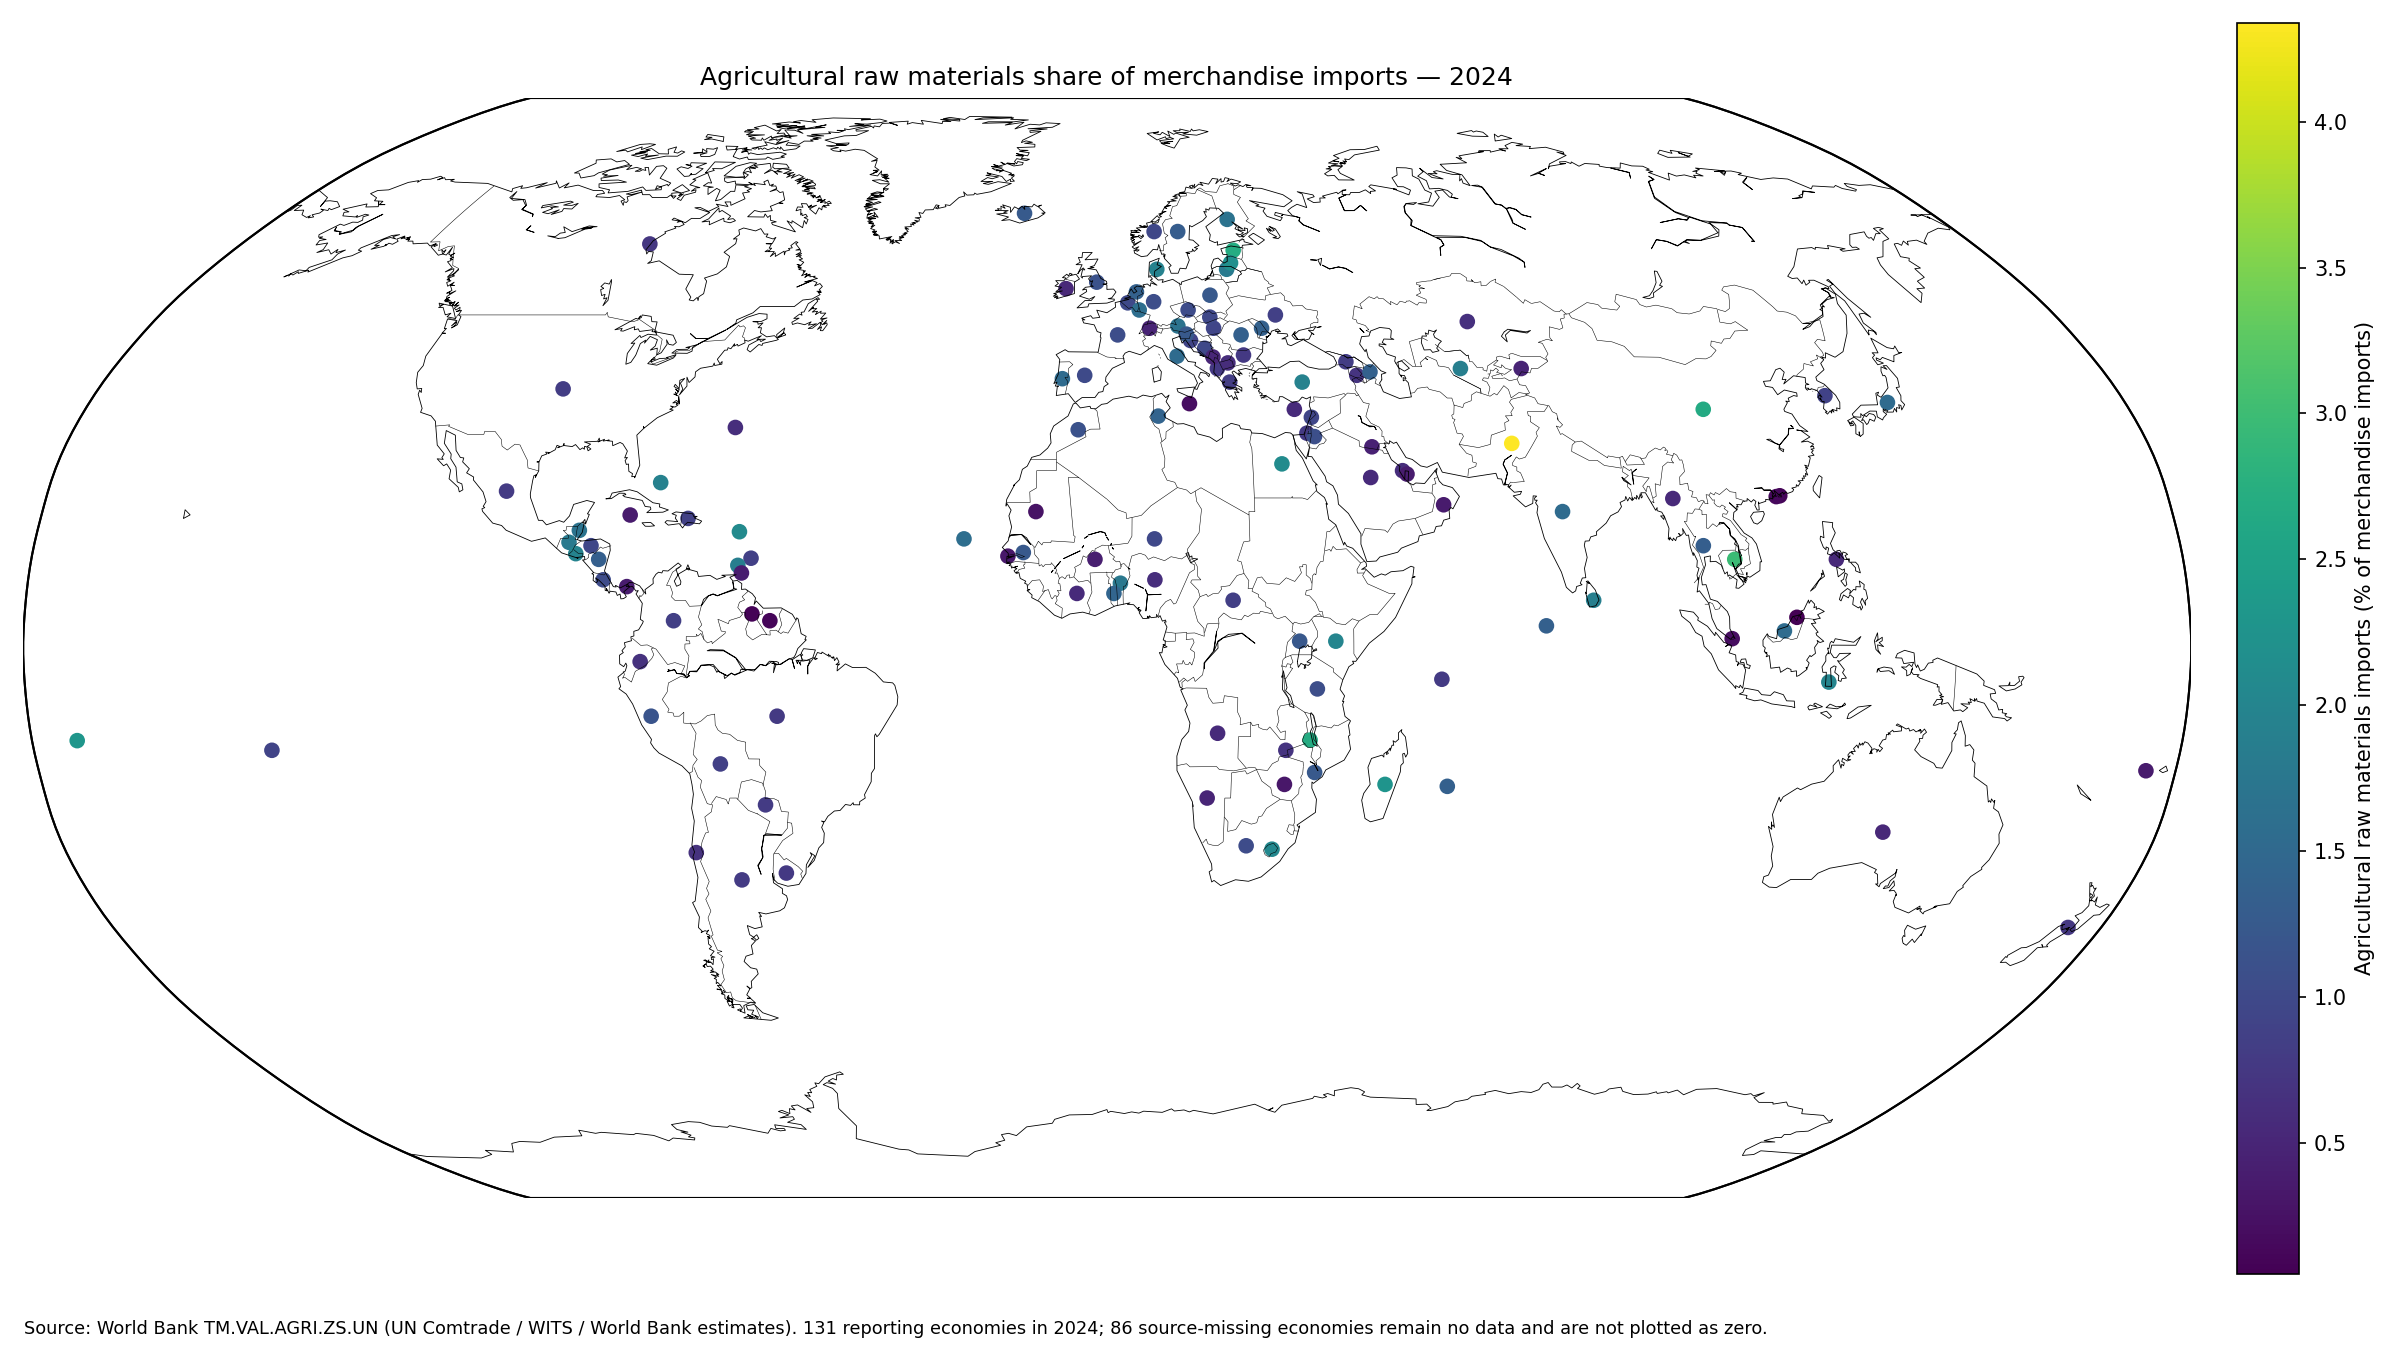
Table of Contents
What counts as agricultural raw materials
The category centers on non-food raw materials used as inputs in production. Examples can include hides and skins, natural rubber, wood and cork, pulp and waste paper, textile fibers, and other crude animal or vegetable materials. Food products as a whole are outside this indicator, and fuels and metal ores are also excluded from the agricultural-raw-material definition.
The World Bank metadata glossary specifies SITC Rev.3 section 2 with divisions 22, 27, and 28 excluded. The World Bank API provides the 2024 observations, drawing on UN Comtrade, WITS, and World Bank staff estimates.
Pakistan records the highest 2024 share
Pakistan leads the reported economies at 4.34%, followed by Cambodia at 2.97%, Estonia at 2.68%, Malawi at 2.67%, and China at 2.66%. Samoa, Madagascar, Latvia, and Egypt are also above 2%.
A 4.34% value does not mean agricultural products are 4.34% of all imports. The numerator is the narrower agricultural-raw-material category and the denominator is merchandise imports. Services imports are outside the calculation.
| Rank | Country or territory | Agricultural raw materials / merchandise imports |
|---|---|---|
| 1 | Pakistan | 4.34% |
| 2 | Cambodia | 2.97% |
| 3 | Estonia | 2.68% |
| 4 | Malawi | 2.67% |
| 5 | China | 2.66% |
| 6 | Samoa | 2.31% |
| 7 | Madagascar | 2.28% |
| 8 | Latvia | 2.20% |
| 9 | Egypt, Arab Rep. | 2.10% |
| 10 | Antigua and Barbuda | 2.09% |
| 11 | Lesotho | 2.05% |
| 12 | Kenya | 2.01% |
| 13 | Indonesia | 2.01% |
| 14 | El Salvador | 1.97% |
| 15 | Turkiye | 1.94% |
The low end is near one-tenth of one percent
Brunei Darussalam is at 0.053%, Guyana 0.077%, Hong Kong SAR 0.091%, Suriname 0.106%, and Macao SAR 0.143%. Singapore and Malta are also below 0.25%.
A low percentage does not imply a small absolute import market. A country can import large amounts of merchandise overall while agricultural raw materials occupy only a small slice. The ratio describes composition, not the dollar value of imports.
| Low-end rank | Country or territory | Agricultural raw materials / merchandise imports |
|---|---|---|
| 1 | Brunei Darussalam | 0.053% |
| 2 | Guyana | 0.077% |
| 3 | Hong Kong SAR, China | 0.091% |
| 4 | Suriname | 0.106% |
| 5 | Macao SAR, China | 0.143% |
| 6 | Singapore | 0.208% |
| 7 | Malta | 0.218% |
| 8 | Mauritania | 0.259% |
| 9 | Zimbabwe | 0.313% |
| 10 | Gambia, The | 0.338% |
| 11 | Fiji | 0.356% |
| 12 | Cayman Islands | 0.361% |
| 13 | Oman | 0.370% |
| 14 | Panama | 0.375% |
| 15 | Qatar | 0.380% |
The median is 0.96%
The median of the 131 reported observations is 0.96%. The first quartile is 0.62% and the third quartile 1.48%, so half of the reported economies lie roughly between those two values.
70 observations are below 1%, 48 are from 1% to under 2%, 12 are from 2% to under 3%, and only 1 are at 3% or more. The distribution shows that agricultural raw materials account for a relatively small share of merchandise imports in most reporting economies.
Eighty-six missing economies are not zeros
The 217-economy frame contains 86 rows marked source missing. Those rows are excluded from the mean, median, rankings, and mapped values. Converting them to zero would mix two very different states: a genuinely low reported share and the absence of a 2024 observation.
The map therefore plots only economies with a numeric 2024 value. No-data status should be interpreted as unavailable reporting in this extract, not as proof that the economy imported no agricultural raw materials.
This is not a food-import share
Food-import indicators cover a different part of merchandise trade. Agricultural raw materials are primarily inputs rather than finished food products, so an economy can have a high food-import share and a low raw-material share, or the reverse.
For example, food consumption needs can raise imports of grains, meat, dairy, or processed foods without materially increasing imports of raw textile fibers, natural rubber, or wood. The two indicators answer different structural questions.
A high share is not the same as agricultural dependence
The numerator is imported raw materials, not domestic agricultural output. Manufacturing economies that depend on imported textile fibers, rubber, wood, or similar inputs can record a relatively high share even if agriculture itself is a small part of domestic GDP.
Domestic agricultural importance is better assessed with agriculture value added, agricultural employment, land use, or production statistics. This series describes the composition of merchandise imports.
Trade hubs and small economies need separate context
Hong Kong SAR, Macao SAR, and Singapore have trade and re-export structures that differ from production-centered economies. Their low agricultural-raw-material shares cannot be reduced to a single claim about domestic agricultural demand.
Small economies such as Samoa, Antigua and Barbuda, or Lesotho can also show noticeable ratios when a limited number of raw-material categories make up a meaningful part of a smaller import basket. Denominator size matters.
A single 2024 reference year improves comparability
All 131 numeric observations refer to 2024. That is a major advantage compared with latest-value datasets that mix many years. The ranking does not suffer from one country’s value being a decade older than another’s.
Coverage is the trade-off. Because 86 economies have no 2024 observation, the results should be described as a comparison of reporting economies rather than a complete ranking of every country and territory.
A rising share does not necessarily mean larger raw-material imports
The indicator is a ratio. It can rise because agricultural raw-material imports increase, because other merchandise imports fall, or because both change at different rates. It can decline even when raw-material import value rises if total merchandise imports grow faster.
A time-series analysis would therefore benefit from raw-material import values and total merchandise-import values alongside the percentage. This package is strongest as a 2024 cross-country composition comparison.
The country mean is not a trade-weighted world share
The 1.11% simple mean gives each of the 131 reporting economies equal weight. A major importing economy and a small importer each count once. It is not the global value of agricultural raw-material imports divided by world merchandise imports.
A global trade-weighted share would require merchandise-import values as weights. The median likewise summarizes the country distribution, not the middle dollar of global trade.
Source and calculation notes
The source is World Bank World Development Indicators series TM.VAL.AGRI.ZS.UN. Statistics use only the 131 economies with reported 2024 values; the 86 source-missing rows are excluded rather than imputed. The official World Bank API provides the series.
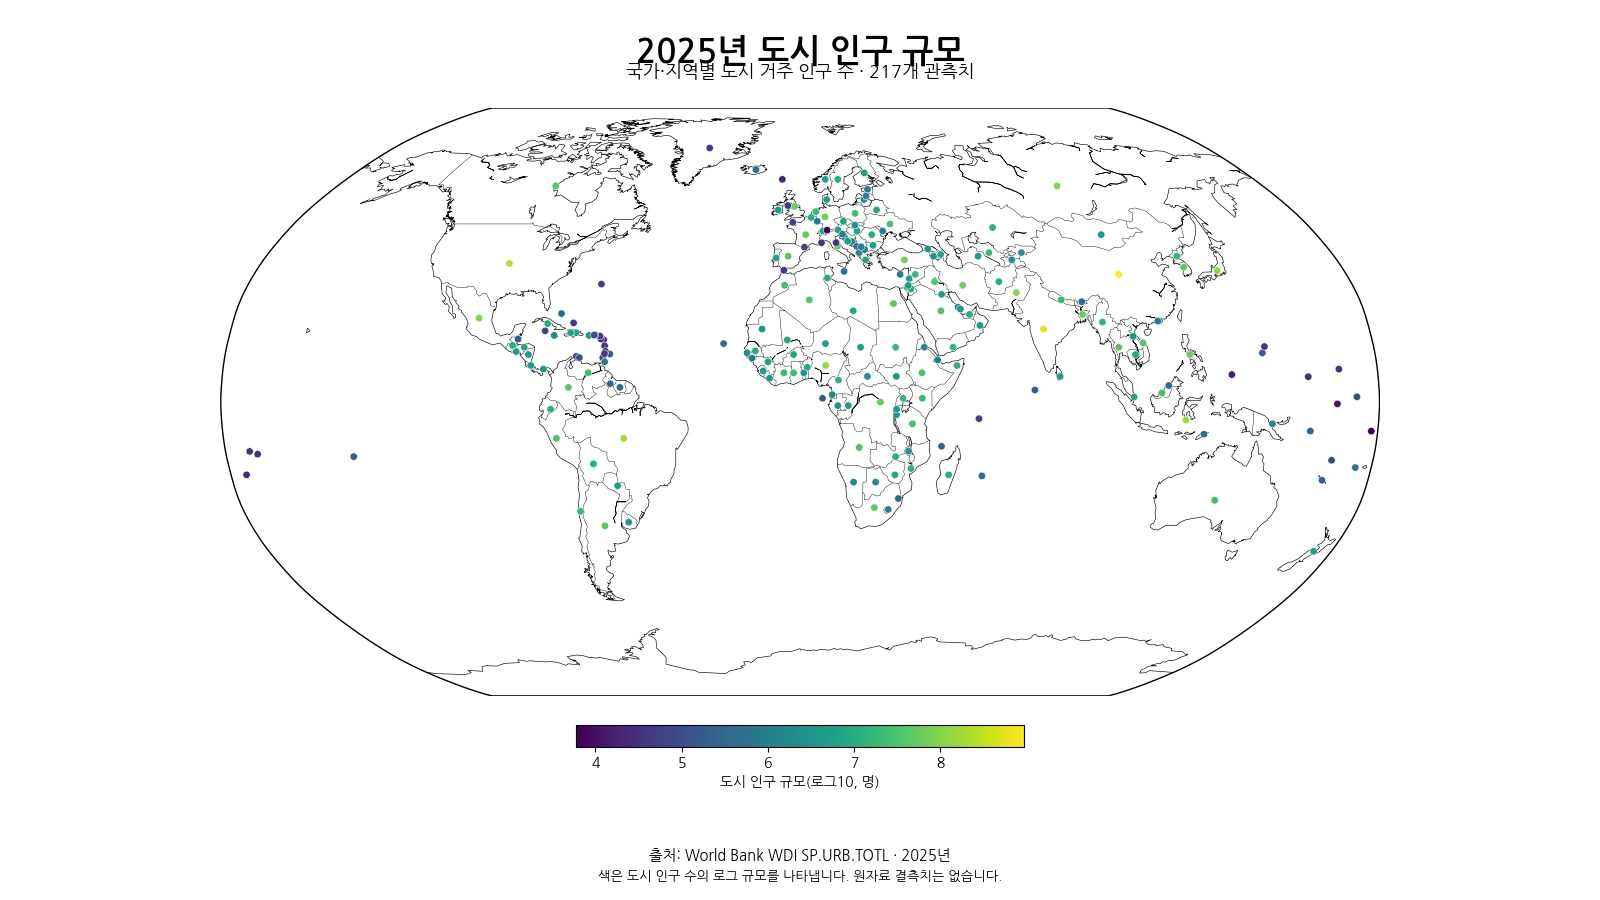
All 131 reported country codes are joined to geographic centroids for the map, producing a 100% match. Missing economies remain no data and are not plotted as zeros.
Frequently Asked Questions
Is agricultural raw materials imports the same as food imports?
No. The indicator covers a narrower SITC category of mainly non-food agricultural raw materials and excludes food imports as a whole.
Are the 86 missing economies counted as zero?
No. Source-missing rows remain no data and are excluded from the mean, median, and rankings.
Does a high share mean domestic agriculture is more important?
Not necessarily. The numerator is imported raw materials, not domestic agricultural production or agriculture value added.
Related Articles
Green Map creates custom-edited map images using open geographic data sources such as geoBoundaries, Natural Earth, OpenStreetMap, and government open data. These maps are edited visual materials, not raw data files, and are provided for education, documents, presentations, and graphic reference.