The World Bank reports a 2023 male tertiary gross enrollment ratio for 127 countries and economies; 90 of the 217 comparison rows have no value for the year. Among valid observations, the median is 44.17% and the simple mean is 45.77%. Greece has the highest figure at 159.59%, followed by Macao SAR at 123.31%, Korea at 113.60%, Turkiye at 101.94%, and Hong Kong SAR at 100.92%. At the bottom, Sint Maarten is at 2.81%, Suriname at 3.83%, and Tanzania at 5.67%. The very wide range makes the gross-enrollment definition central to interpretation.
World Bank indicator SE.TER.ENRR.MA compares all male students enrolled in tertiary education, regardless of age, with the male population in the age group officially associated with tertiary study. The numerator can include students who enter late, return after interruption, remain enrolled beyond the conventional age range, or study at advanced levels. For that reason the ratio is not bounded at 100%. A value above 100 does not mean more than every official-age male is enrolled; it means total male tertiary enrollment is larger than the size of the reference-age male population.
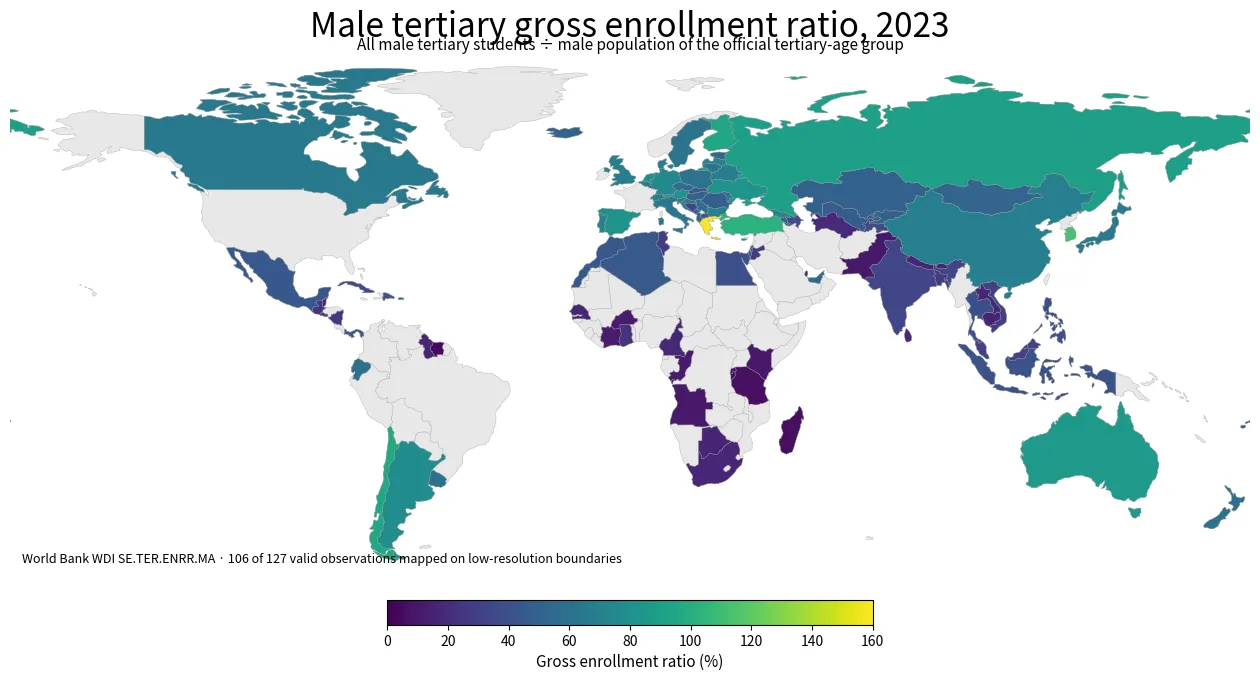
Table of Contents
Why values above 100% are valid in a gross enrollment ratio
Five reporting economies exceed 100% in 2023. Greece reaches 159.59%, Macao SAR 123.31%, Korea 113.60%, Turkiye 101.94%, and Hong Kong SAR 100.92%. These values should not be clipped or treated automatically as errors. Gross enrollment ratios intentionally allow students outside the theoretical age group into the numerator. Differences in program duration, postgraduate enrollment, return-to-study patterns, cross-border students, migration, and population estimates can all change the relationship between enrolled students and the reference-age population.
| Country or economy, 2023 | Male tertiary gross enrollment ratio |
|---|---|
| Greece | 159.59% |
| Macao SAR, China | 123.31% |
| Korea, Rep. | 113.60% |
| Turkiye | 101.94% |
| Hong Kong SAR, China | 100.92% |
| Chile | 95.76% |
| Finland | 94.04% |
| Singapore | 92.80% |
| Russian Federation | 89.62% |
| Cyprus | 87.79% |
The median and quartiles show a wide distribution
The middle half of reported values runs from roughly 20.21% to 63.85%. The median of 44.17% means half of reporting economies are above that level and half below it. The mean is slightly higher because the upper tail contains several very large observations. This is an unweighted country average: a populous country and a small island economy each count once. It should not be described as the share of all men worldwide enrolled in tertiary education. A global population-weighted rate would require aggregated student and age-group counts.
Europe and East Asia contain large internal differences
European observations span a large range even though several are high. Greece is an extreme outlier at 159.59%, while Finland is at 94.04%, Spain 81.66%, Norway 76.59%, Germany 75.24%, France 60.93%, and Italy 63.49%. This spread shows why a continental label is not enough to explain enrollment structure. Systems differ in degree length, vocational pathways, postgraduate participation, delayed entry, and the number of international students counted in domestic institutions.
Across East Asia, Macao SAR and Hong Kong SAR are above 100%, while China is at 69.30% and Japan at 65.31%. A high gross ratio can reflect a large tertiary sector relative to the reference-age population, but it is not automatically evidence of higher learning quality or stronger labor-market outcomes. It also differs from educational attainment, which asks what qualification adults have already completed rather than whether students are currently enrolled.
Latin America, South Asia, and Southeast Asia vary widely
Latin American values also vary considerably. Chile is at 95.76%, Argentina 76.92%, and Mexico 43.44%. These figures describe enrollment scale, not completion. A country can enroll many students and still experience delayed graduation, dropout, or large differences among institutions. Conversely, a lower gross ratio does not by itself identify the cause. Tuition, capacity, secondary-school completion, demographic structure, migration, work incentives, and public policy can all matter, but those explanations require additional data.
Low values do not identify a single cause
South Asia shows a broad range: India reports 33.32%, Bangladesh 28.03%, and Pakistan 10.62%. In Southeast Asia, Indonesia is at 40.12%, Thailand 38.83%, the Philippines 37.62%, and Malaysia 30.98%. Nearby economies therefore do not necessarily have similar enrollment levels. Differences can arise from the transition from secondary education, the size and composition of the college-age population, public and private capacity, study abroad, military service, labor-market entry, and how tertiary programs are classified.
| Country or economy, 2023 | Male tertiary gross enrollment ratio |
|---|---|
| Sint Maarten (Dutch part) | 2.81% |
| Suriname | 3.83% |
| Tanzania | 5.67% |
| Madagascar | 6.07% |
| Burundi | 6.78% |
| Samoa | 7.98% |
| St. Lucia | 9.73% |
| Seychelles | 10.05% |
| Rwanda | 10.06% |
| Kenya | 10.09% |
The 90 missing observations are not zeros
The lowest valid observations include Sint Maarten at 2.81%, Suriname at 3.83%, Tanzania at 5.67%, Madagascar at 6.07%, Burundi at 6.78%, Samoa at 7.98%, Saint Lucia at 9.73%, Seychelles at 10.05%, Rwanda at 10.06%, and Kenya at 10.09%. They indicate that total male tertiary enrollment is small relative to the official reference-age male population. They do not prove a single cause such as low institutional quality, poverty, or limited supply without supporting evidence.
Enrollment is different from completion and learning
The source preserves 90 missing 2023 observations. Missing is not zero. Replacing unavailable values with zero would create false bottom-ranked economies and distort the mean, median, and map. This comparison therefore uses only the 127 valid observations for descriptive statistics, while keeping missing economies visibly separate. Choosing the latest available year for every economy could increase coverage, but it would mix years and weaken same-year comparability.
A male-only series cannot establish a gender gap
Tertiary gross enrollment is useful for comparing the scale of participation, but it does not directly measure learning, completion, graduate employment, field of study, research quality, or the value of qualifications. An economy with a high ratio can still face completion or labor-market challenges. An economy with a lower ratio may have different vocational pathways or age structures. The measure is best used as one component of a broader education profile rather than as a standalone score of educational performance.
A 2023 snapshot is not a trend
This series covers males only. It cannot establish a gender gap without the corresponding female series measured for the same year and definition. A male ratio of 50% does not tell whether female enrollment is higher or lower. For gender-balance analysis, male and female gross ratios need to be compared side by side, and differences in age structure and participation patterns should be considered before drawing conclusions.
Source and interpretation rules
A single 2023 cross-section also cannot establish a trend. Enrollment can change because of university capacity, policy, economic conditions, migration, demographic shifts, postgraduate participation, or students returning after interruptions. A trend analysis would require multiple years with consistent definitions and attention to breaks in national reporting. The map is therefore a snapshot of where male tertiary enrollment stood relative to the reference-age population in 2023, not evidence of recent improvement or decline.
The source is the World Bank World Development Indicators series SE.TER.ENRR.MA, expressed as percent for 2023. Aggregate regional and income-group rows are excluded, leaving individually reported countries and economies. Three reading rules matter most: a gross ratio can exceed 100 because age is unrestricted in the numerator; missing observations are not zeros; and enrollment is not the same as completion or learning. With those rules, the 2023 distribution can be compared without turning the indicator into a misleading ranking of education quality.
Frequently Asked Questions
Can the male tertiary gross enrollment ratio exceed 100%?
Yes. Gross enrollment includes male tertiary students regardless of age, so total enrollment can exceed the size of the official reference-age male population.
Do the 90 economies without a 2023 value have a 0% ratio?
No. They are missing source observations and must remain separate from real zero or low values.
Does a higher gross enrollment ratio prove better tertiary education quality?
No. It measures enrollment scale relative to a reference-age population, not completion, learning quality, or graduate employment.
Related Articles
Green Map creates custom-edited map images using open geographic data sources such as geoBoundaries, Natural Earth, OpenStreetMap, and government open data. These maps are edited visual materials, not raw data files, and are provided for education, documents, presentations, and graphic reference.