Urban population size varies enormously across countries and areas in 2025. In the 217 World Bank observations for SP.URB.TOTL, China has the largest urban population at about 933.17 million, while Liechtenstein has the smallest at about 6.0 thousand. The median is roughly 4.17 million and the simple mean is about 21.81 million. The large gap between the mean and median reflects a highly skewed distribution in which a few very populous countries account for exceptionally large urban populations.
The key distinction is between an urban population count and an urbanization rate. The count asks how many people live in urban areas. The urbanization rate asks what percentage of the total population lives in urban areas. A large country can therefore have a much larger urban population than a small country even if the smaller country is more urbanized in percentage terms. The two indicators answer different questions and should not be used interchangeably.
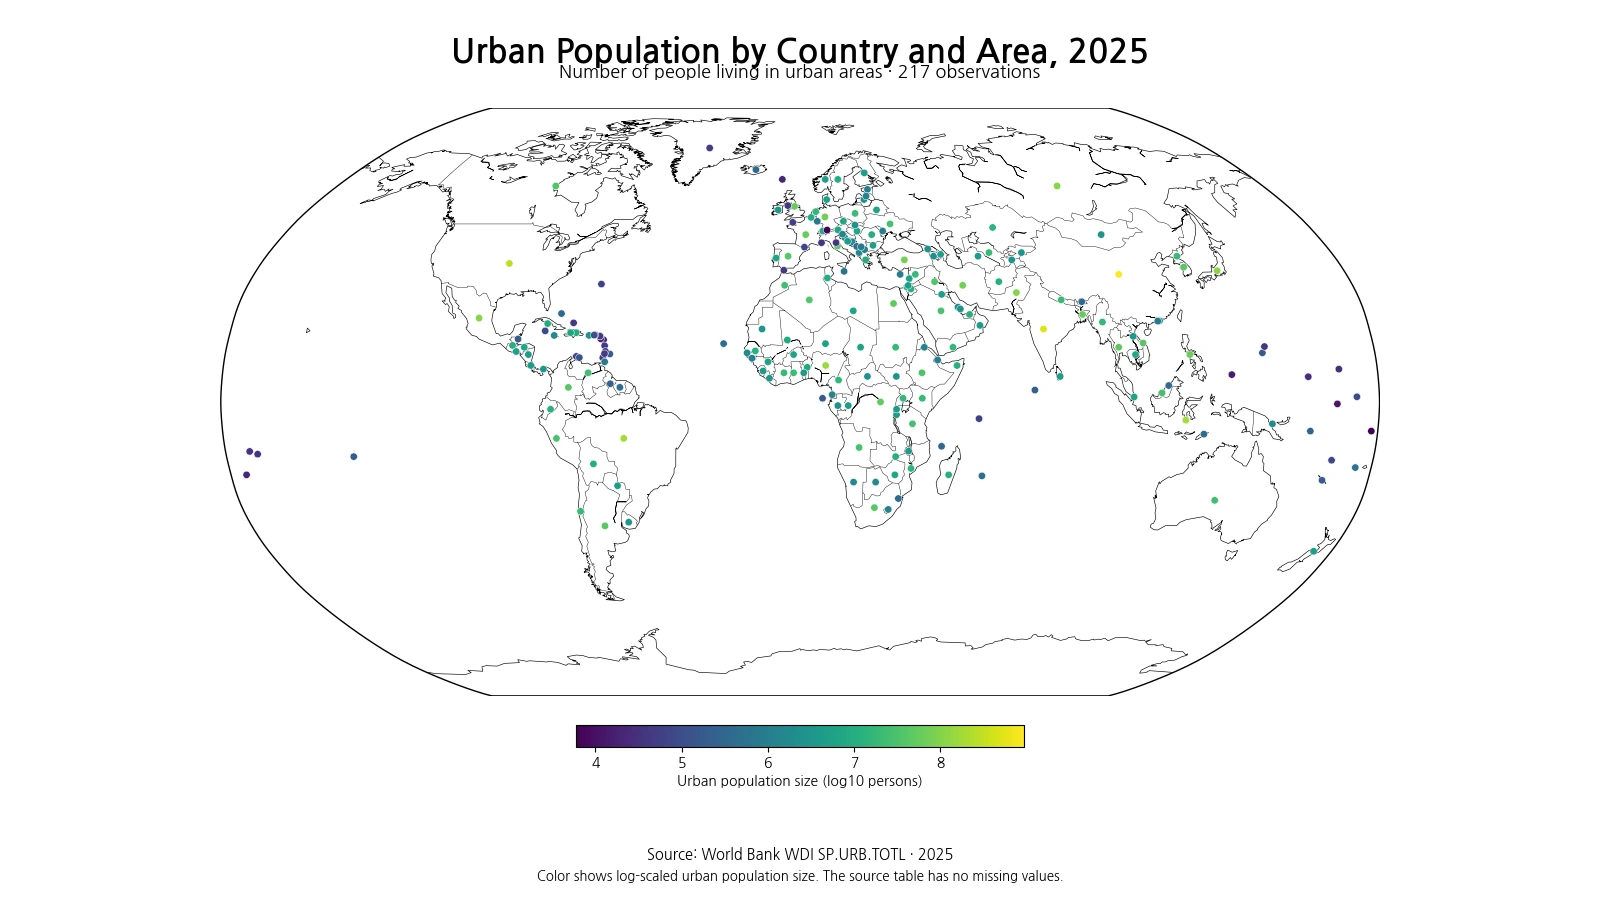
Table of Contents
Where urban populations are largest and smallest
The largest urban populations are concentrated in countries with very large national populations and extensive metropolitan systems. China and India stand far above most countries in absolute numbers. The United States, Brazil, Indonesia, Japan, Mexico, Russia and other large countries also contain very large urban populations. This ranking is primarily a count of people, not a ranking of how urbanized a society is.
| Rank | Country or area | Urban population |
|---|---|---|
| 1 | China | 933.17 million |
| 2 | India | 522.44 million |
| 3 | United States | 274.08 million |
| 4 | Brazil | 187.65 million |
| 5 | Indonesia | 169.70 million |
| 6 | Nigeria | 151.48 million |
| 7 | Japan | 113.87 million |
| 8 | Russian Federation | 107.99 million |
| 9 | Mexico | 105.61 million |
| 10 | Pakistan | 100.88 million |
At the other end of the distribution, very small states and territories dominate because their total populations are small. Liechtenstein, Monaco and San Marino can report high urban shares while still having only tens of thousands of urban residents. A low absolute urban population should therefore not be read as evidence of weak urban development or limited infrastructure quality.
| Rank | Country or area | Urban population |
|---|---|---|
| 1 | Liechtenstein | 6.0 thousand |
| 2 | Tuvalu | 6.2 thousand |
| 3 | Naoero | 12.0 thousand |
| 4 | Palau | 14.0 thousand |
| 5 | St. Kitts and Nevis | 15.0 thousand |
| 6 | Faroe Islands | 21.8 thousand |
| 7 | Tonga | 21.9 thousand |
| 8 | British Virgin Islands | 22.8 thousand |
| 9 | Antigua and Barbuda | 22.9 thousand |
| 10 | St. Martin (French part) | 24.9 thousand |
Why the mean is much larger than the median
The median observation is about 4.17 million, while the simple mean is around 21.81 million. The first quartile is roughly 420.9 thousand and the third quartile about 15.47 million. Half of the country and area observations therefore lie between those quartiles, while a small number of extremely large national urban populations pull the mean sharply upward. In a distribution like this, the median is often a better description of a typical observation than the mean alone.
Urban population size is closely related to total population but is not the same thing. Two countries with similar total populations can have different urban counts if their urbanization rates differ. Conversely, two countries with similar urbanization rates can have very different urban counts if their total populations are different. The most informative comparison uses total population, urban population and the urban share together.
Urban definitions are not identical across countries
World Bank metadata notes that urban population refers to people living in areas classified as urban by national statistical offices. Because countries do not all use exactly the same criteria, the concept of an urban area is not perfectly harmonized. Some systems rely heavily on legal or administrative status, while others place more weight on population size, density or settlement characteristics. Cross-country comparison is still useful, but very small differences should not be treated as if every observation were produced from one universal urban definition.
The indicator also does not directly measure the size of a functional metropolitan economy or the built-up footprint. A metropolitan labor market can extend beyond an official city boundary, and commuter belts may cross administrative lines. For transport planning, housing markets or metropolitan governance, additional city- or metro-level data may be needed.
A large urban population does not imply the highest urbanization rate
Absolute urban population and urbanization rate can move differently. A country with hundreds of millions of residents may have a moderate urban share and still contain several hundred million urban residents. A small country can be nearly fully urbanized but have fewer than one million urban residents. Counts are especially relevant to the scale of service demand, while percentages are more useful for describing how the national population is distributed between urban and non-urban areas.
This distinction matters for infrastructure planning. The same 80% urbanization rate can imply radically different housing, transit, school, hospital, water and waste-service demand in a country of one million people versus a country of one hundred million. At the same time, an absolute count does not reveal how much of the population remains rural. Counts and shares are complementary, not substitutes.
Urban population indicates scale, not urban quality
A large urban population can signal a large potential demand for housing, transport, water, sanitation, electricity, education, health care and waste management. But the count does not say whether those services are adequate, affordable or evenly distributed. Countries with similar urban population totals can have very different settlement patterns: one may be dominated by a few megacities, while another may spread residents across many medium-sized cities. Those structures create different policy challenges.
For this reason, urban population is a useful measure of scale but not a composite measure of urban living conditions or sustainability. Density, housing supply, commuting time, air quality, sanitation, green space, local income and city-level service coverage add information that the national urban population count cannot provide by itself.
A single 2025 snapshot cannot show the speed of urbanization
This map is a cross-section. It shows the number of urban residents in 2025 but not whether that number is rising quickly, slowly, or declining. Measuring urban growth requires a time series of the same indicator. Explaining the change requires still more evidence, because urban population can grow through natural increase, rural-to-urban migration, international migration, reclassification of settlements, or changes in statistical boundaries.
Urban growth also does not imply an equal decline in rural population. In a country with rapid total population growth, both urban and rural populations can rise at the same time. In a shrinking population, the urban share can increase even if the absolute urban population is flat or falling. Counts, shares, rural population and total population therefore provide complementary views.
How to interpret the source and the map
World Bank WDI series SP.URB.TOTL measures the number of people living in urban areas as defined by national statistical offices. The World Bank documentation explains that it combines World Bank population estimates with urban ratios from the United Nations World Urbanization Prospects. Urban and rural population aggregates may not always sum exactly to total population because country coverage can differ across source series.
All rankings, quartiles and summary statistics in this article are calculated from the same 217 observations dated 2025. No missing values were replaced with zeros and no older observation was substituted into the comparison. Because the counts range from only a few thousand to hundreds of millions, the map uses a logarithmic color scale so that small and large observations can both remain visible. The underlying population numbers in the tables and text remain the original counts.
Frequently Asked Questions
Is urban population the same as the urbanization rate?
No. Urban population is the number of people living in urban areas, while the urbanization rate is the percentage of the total population living in urban areas.
Are all 217 observations from 2025?
Yes. All 217 country and area observations used here are dated 2025, and the source table has no missing values.
Does the largest urban population mean the country is the most urbanized?
No. A very populous country can have a larger urban population even if its urban share is lower than that of a small country.
Related Maps
Green Map creates custom-edited map images using open geographic data sources such as geoBoundaries, Natural Earth, OpenStreetMap, and government open data.
These maps are edited visual materials, not raw data files, and are provided for education, documents, presentations, and graphic reference.