Electricity production from coal sources measures the share of total electricity generation produced from coal and related coal-category fuels. The World Bank EG.ELC.COAL.ZS series contains 209 latest non-empty observations, but the years are mixed: 33 are from 2024, 54 from 2023, and 120 from 2021. The 2024 group is used as the most recent same-year comparison, while the larger 2023 group provides additional context.
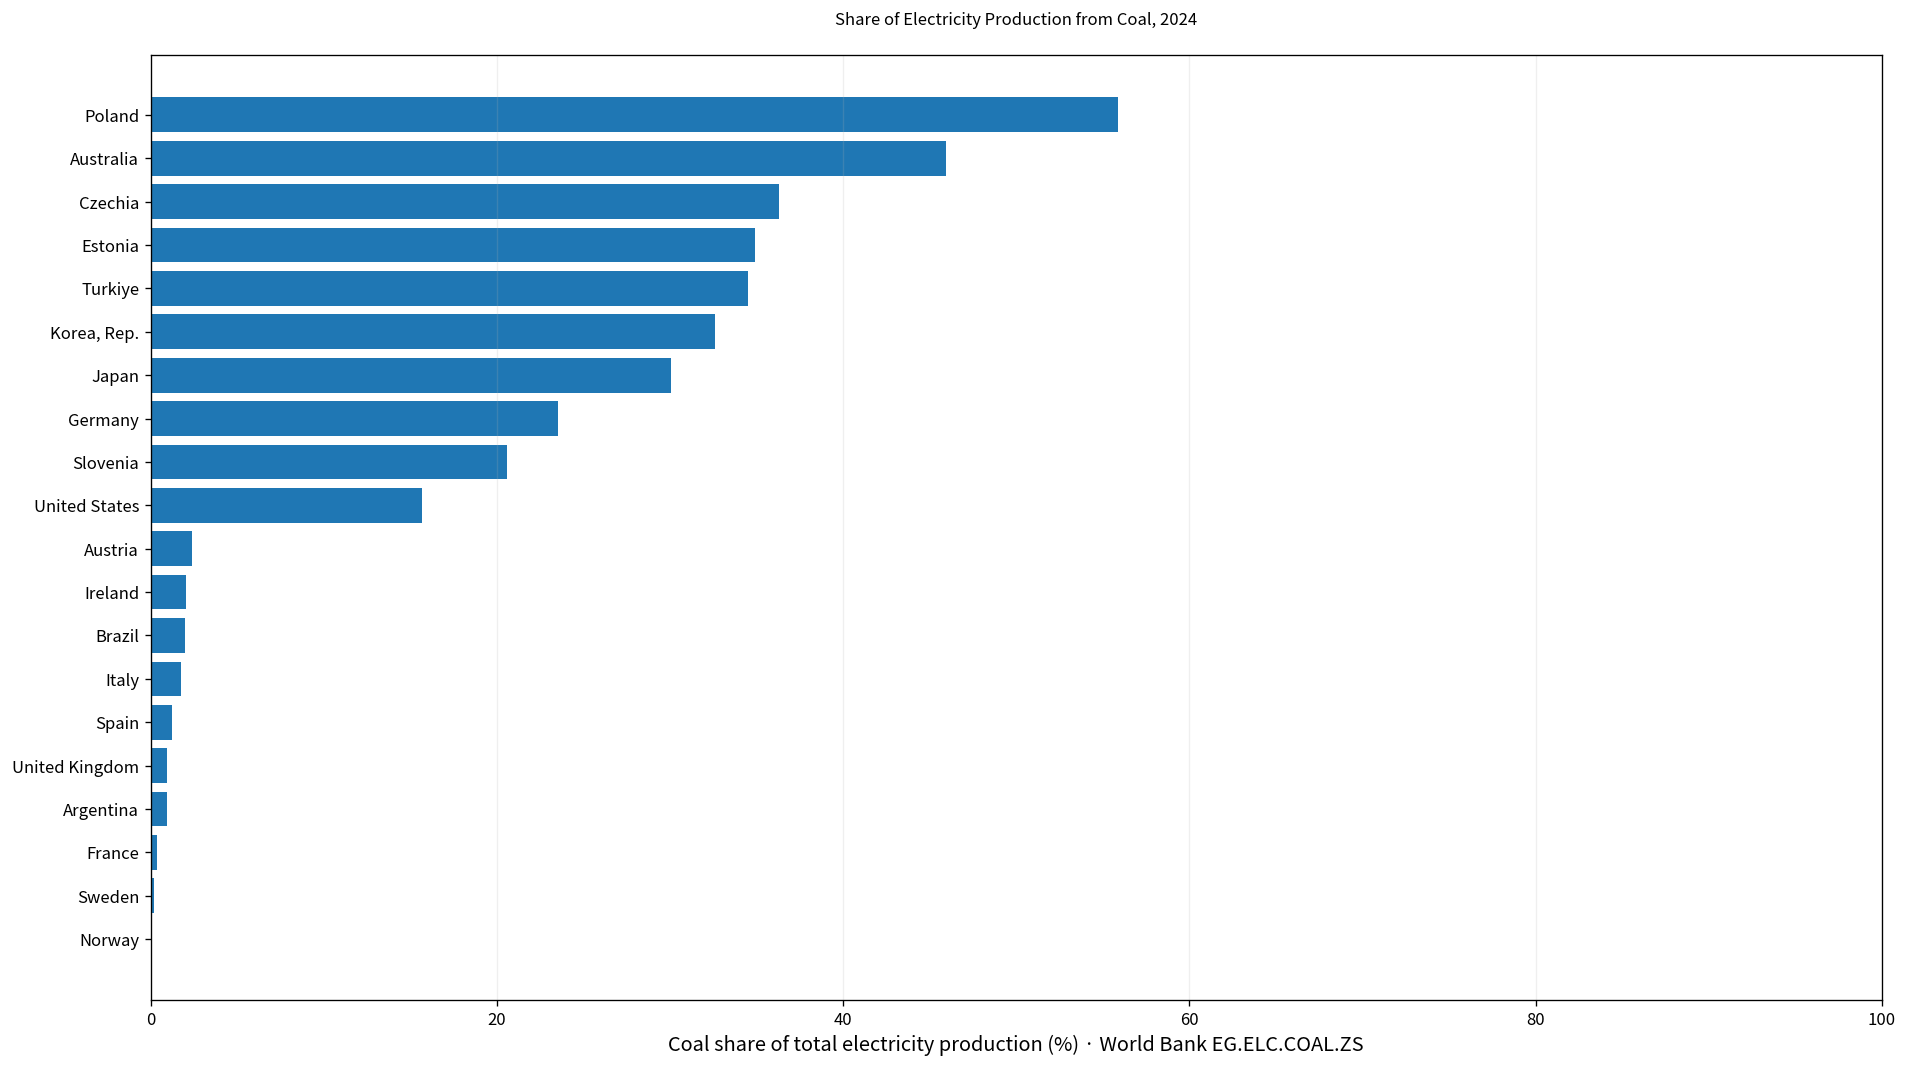
Table of Contents
Coal share is not the same as the amount of coal-fired electricity
The indicator is a percentage of total electricity production. It does not measure coal-fired output in GWh or TWh. A small power system with an 80% coal share can produce less coal-fired electricity in absolute terms than a very large system with a 20% share.
The percentage is useful for describing dependence within the electricity mix. Absolute coal generation, coal consumption, or power-sector emissions require separate measures. The ranking in this article is therefore a ranking of shares, not volumes.
The source coal category is broader than hard coal alone
World Bank documentation states that coal includes primary hard coal and lignite-brown coal, as well as derived fuels such as patent fuel, coke oven coke, gas coke, coke oven gas, and blast furnace gas. Peat is also included in the category.
That accounting boundary can be broader than everyday use of the phrase coal-fired power. Comparisons with another energy source should first check whether the fuel classifications are identical.
The 209 latest observations span 2015 to 2024
Among the 209 latest observations, 33 are from 2024, 54 from 2023, 1 from 2022, 120 from 2021, and 1 from 2015. The latest-value inventory therefore combines different power-system years.
| Observation year | Economies/territories | Share of 209 |
|---|---|---|
| 2024 | 33 | 15.8% |
| 2023 | 54 | 25.8% |
| 2022 | 1 | 0.5% |
| 2021 | 120 | 57.4% |
| 2015 | 1 | 0.5% |
The mixed-year collection has a mean of 10.06% and a median of 0%. 119 latest observations are exactly zero. These zeros are published values rather than missing values filled with zero, but the mixed-year statistics should not be presented as a current global coal-power average.
The 2024 mean is 13.12% and the median is 6.01%
The 2024 same-year subset contains 33 economies. Its mean is 13.12% and its median 6.01%. The first quartile is 2.01% and the third quartile 20.59%, placing the middle half roughly between 2.0% and 20.6%.
13 observations are at least 10%, 7 are at least 25%, and 1 reaches 50% or more. None of the 2024 observations is at or above 75%.
Poland is highest in 2024 at 55.88%
Poland records 55.88%, followed by Australia at 45.96%, Czechia at 36.29%, Estonia at 34.91%, Turkiye at 34.50%, and Japan at 30.07%. Germany records 23.53%, Slovenia 20.59%, the United States 15.69%, and Chile 14.76%.
| 2024 rank | Economy/territory | Coal share of electricity production |
|---|---|---|
| 1 | Poland | 55.88% |
| 2 | Australia | 45.96% |
| 3 | Czechia | 36.29% |
| 4 | Estonia | 34.91% |
| 5 | Turkiye | 34.50% |
| 6 | Korea, Rep. | 32.60% |
| 7 | Japan | 30.07% |
| 8 | Germany | 23.53% |
| 9 | Slovenia | 20.59% |
| 10 | United States | 15.69% |
| 11 | Chile | 14.76% |
| 12 | Israel | 13.97% |
| 13 | Colombia | 12.42% |
| 14 | Netherlands | 8.16% |
| 15 | Mexico | 7.63% |
A high share means coal-category fuels play a large role in the electricity mix. It does not imply that coal has the same share of total national energy consumption, because transport, heating, and industrial fuel use are outside the denominator of this electricity indicator.
Norway is lowest in 2024 at 0.08%
Norway records 0.08%, Sweden 0.21%, France 0.36%, Argentina 0.92%, and the United Kingdom 0.94%. Spain is at 1.20%, Italy 1.76%, Brazil 1.96%, Ireland 2.01%, and Austria 2.38%.
| Low-order position in 2024 | Economy/territory | Coal share of electricity production |
|---|---|---|
| 1 | Norway | 0.08% |
| 2 | Sweden | 0.21% |
| 3 | France | 0.36% |
| 4 | Argentina | 0.92% |
| 5 | United Kingdom | 0.94% |
| 6 | Spain | 1.20% |
| 7 | Italy | 1.76% |
| 8 | Brazil | 1.96% |
| 9 | Ireland | 2.01% |
| 10 | Austria | 2.38% |
| 11 | Finland | 2.60% |
| 12 | Belgium | 2.83% |
| 13 | Canada | 2.93% |
| 14 | Slovak Republic | 3.08% |
| 15 | Denmark | 4.96% |
A low coal share does not automatically mean renewables dominate the power system. Nuclear, natural gas, hydro, oil, or other sources may occupy the space not supplied by coal.
The broader 2023 group has much higher upper values
The 2023 subset contains 54 economies, with a mean of 28.12% and a median of 18.79%. Botswana is highest at 98.85%, followed by Mongolia at 85.15%, South Africa at 81.60%, India at 74.43%, and Indonesia at 69.12%.
| 2023 high-order position | Economy/territory | Coal share of electricity production |
|---|---|---|
| 1 | Botswana | 98.85% |
| 2 | Mongolia | 85.15% |
| 3 | South Africa | 81.60% |
| 4 | India | 74.43% |
| 5 | Indonesia | 69.12% |
| 6 | Philippines | 62.49% |
| 7 | Morocco | 62.11% |
| 8 | China | 61.34% |
| 9 | Serbia | 58.91% |
| 10 | Cambodia | 58.72% |
| 11 | Kazakhstan | 58.36% |
| 12 | Bosnia and Herzegovina | 56.42% |
| 13 | Zimbabwe | 54.14% |
| 14 | Malaysia | 45.02% |
| 15 | Viet Nam | 44.76% |
The Philippines records 62.49%, Morocco 62.11%, China 61.34%, Serbia 58.91%, Cambodia 58.72%, Kazakhstan 58.36%, Bosnia and Herzegovina 56.42%, and Zimbabwe 54.14%. Thirteen of the 54 observations are at least 50%.
The fact that the 2023 mean is higher than the 2024 mean should not be interpreted as a one-year global collapse in coal power. The two groups contain different economies. A time trend requires matched observations for the same countries.
Three 2023 economies record exactly zero
Bahrain, Latvia, and Moldova record 0% in 2023. Belarus is at 0.06%, Peru 0.06%, Iran, Islamic Rep. 0.18%, Honduras 0.52%, Singapore 0.90%, Senegal 1.13%, and Namibia 1.59%.
| 2023 low-order position | Economy/territory | Coal share of electricity production |
|---|---|---|
| 1 | Bahrain | 0.00% |
| 2 | Latvia | 0.00% |
| 3 | Moldova | 0.00% |
| 4 | Belarus | 0.06% |
| 5 | Peru | 0.06% |
| 6 | Iran, Islamic Rep. | 0.18% |
| 7 | Honduras | 0.52% |
| 8 | Singapore | 0.90% |
| 9 | Senegal | 1.13% |
| 10 | Namibia | 1.59% |
| 11 | Eswatini | 2.66% |
| 12 | Panama | 3.49% |
| 13 | Tajikistan | 4.60% |
| 14 | Myanmar | 5.33% |
| 15 | Croatia | 7.55% |
A zero is not a missing value. It means the recorded coal-category share of total electricity production is zero for that economy and observation year. Very small positive values are also retained rather than rounded down to zero.
Most 2021 latest observations are zero
There are 120 economies whose latest non-empty observation is dated 2021, and 115 of them report 0%. That structure pushes the median of the full 209-row latest-observation collection to zero. The 2021-group mean is only 1.26%, although a few large observations pull it upward.
This is an important limitation of a latest-observation inventory. A 2021 zero and a 2024 positive value are not observations from the same moment. Keeping the observation year visible prevents the latest-value list from being mistaken for a current single-year global ranking.
Coal share is not identical to electricity carbon intensity
Coal is generally a carbon-intensive fuel, but this indicator does not directly measure greenhouse-gas emissions. Plant efficiency, coal type, derived fuels, transmission losses, and the composition of other generation sources can affect the carbon intensity of electricity.
A climate-focused comparison should add power-sector CO₂ emissions or grams of CO₂ per kWh. Coal share describes the structure of electricity supply; emissions are a related but separate outcome.
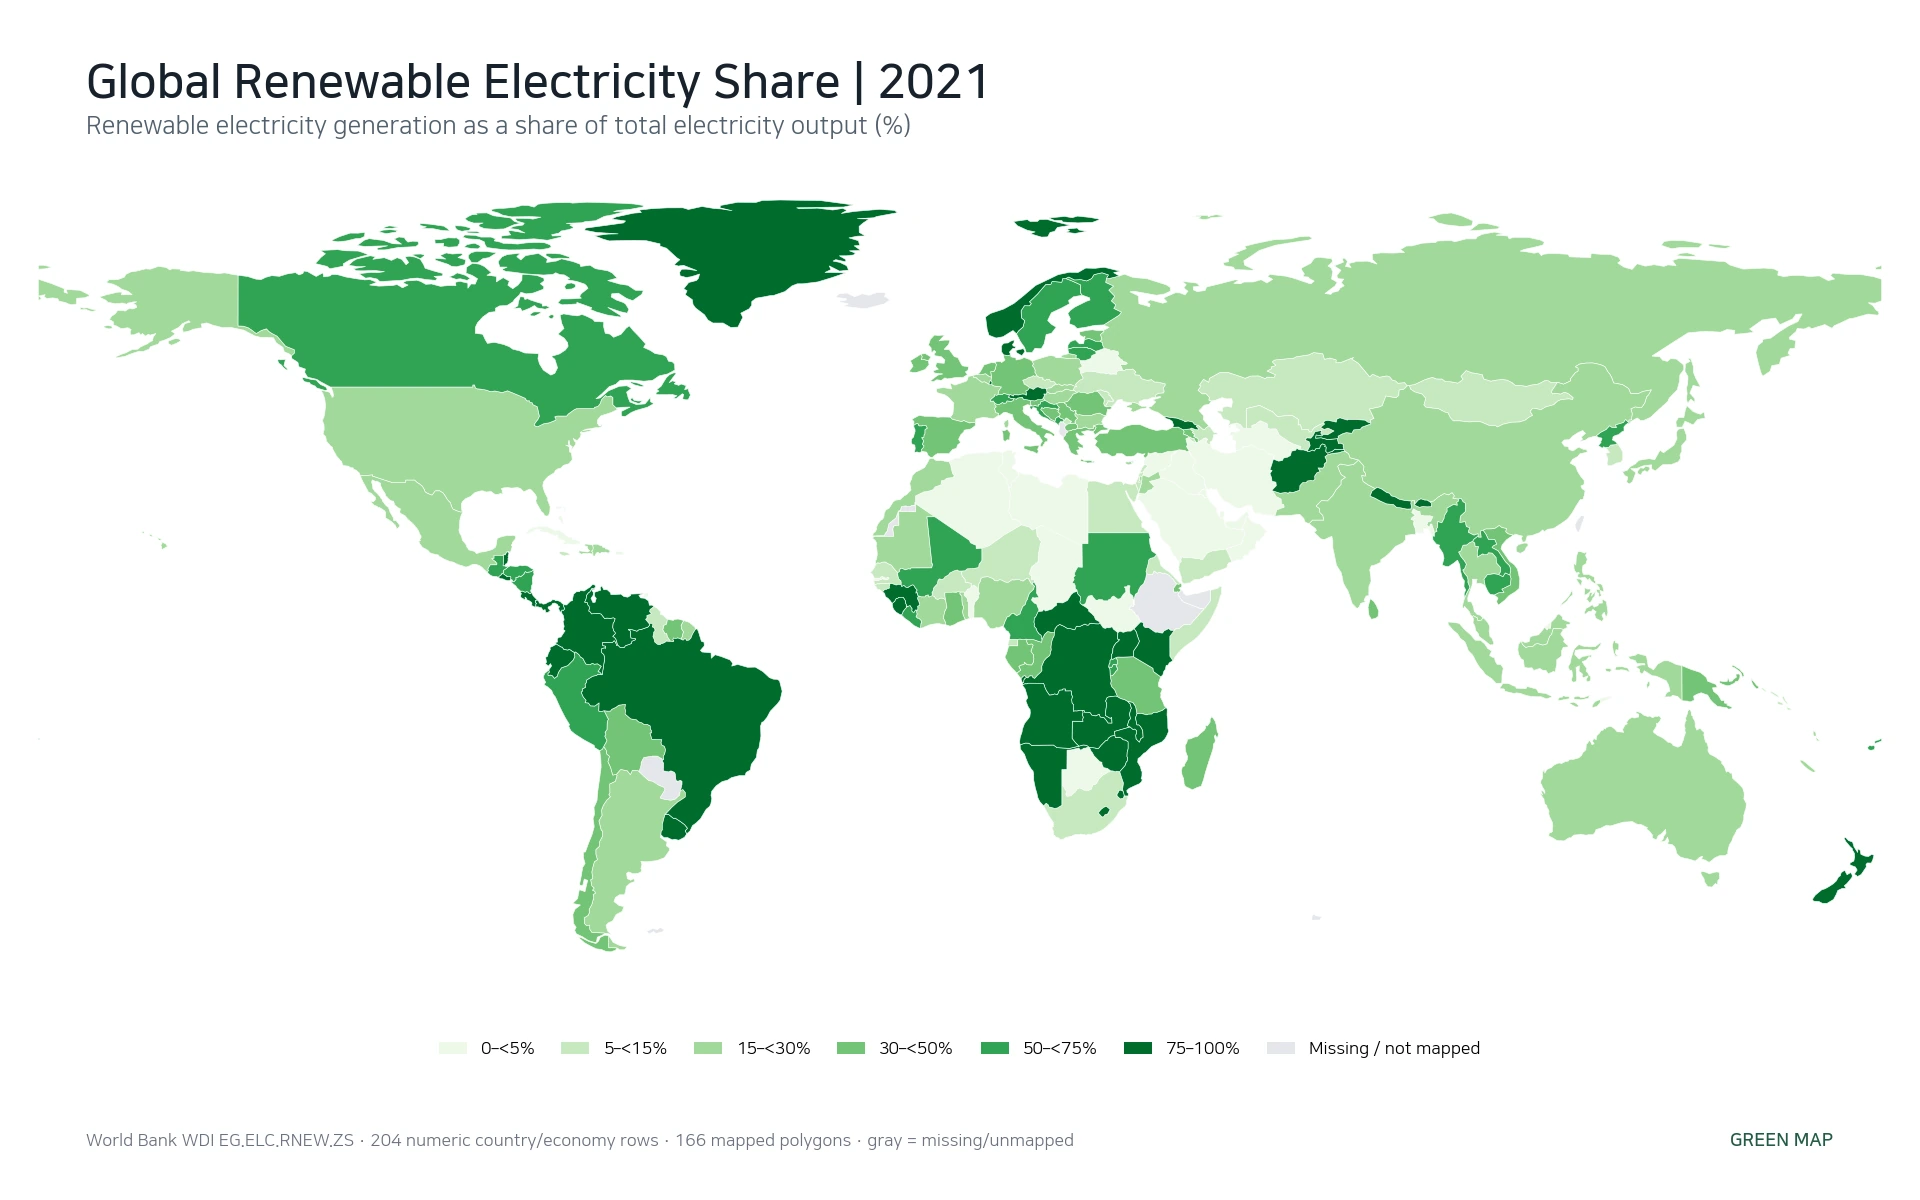
Read coal together with renewables, gas, hydro, and nuclear
An electricity mix is built from multiple sources whose shares collectively approach 100%. A low coal share can reflect a high renewable share, but it can also reflect greater use of natural gas, nuclear power, hydroelectricity, or oil.
To understand power-sector transition, coal should therefore be read alongside other generation-source shares. To determine whether a country’s coal dependence is falling, a country-specific time series is needed; the latest-observation file alone does not calculate change over time.
Complete list of the 209 latest observations
The table below lists the latest non-empty observation for each economy and territory in alphabetical order. Rows not dated 2024 retain their original year. Strict same-year comparisons should use the 33 observations from 2024 or, for broader coverage, the separate 54-observation 2023 group.
| Economy/territory | Observation year | Coal share of electricity production |
|---|---|---|
| Afghanistan | 2021 | 0.00% |
| Albania | 2021 | 0.00% |
| Algeria | 2021 | 0.00% |
| American Samoa | 2021 | 0.00% |
| Andorra | 2021 | 0.00% |
| Angola | 2021 | 0.00% |
| Antigua and Barbuda | 2021 | 0.00% |
| Argentina | 2024 | 0.92% |
| Armenia | 2021 | 0.00% |
| Aruba | 2021 | 0.00% |
| Australia | 2024 | 45.96% |
| Austria | 2024 | 2.38% |
| Azerbaijan | 2021 | 0.00% |
| Bahamas, The | 2021 | 0.00% |
| Bahrain | 2023 | 0.00% |
| Bangladesh | 2023 | 10.59% |
| Barbados | 2021 | 0.00% |
| Belarus | 2023 | 0.06% |
| Belgium | 2024 | 2.83% |
| Belize | 2021 | 0.00% |
| Benin | 2021 | 0.00% |
| Bhutan | 2021 | 0.00% |
| Bolivia | 2021 | 0.00% |
| Bosnia and Herzegovina | 2023 | 56.42% |
| Botswana | 2023 | 98.85% |
| Brazil | 2024 | 1.96% |
| British Virgin Islands | 2021 | 0.00% |
| Brunei Darussalam | 2023 | 20.39% |
| Bulgaria | 2023 | 29.15% |
| Burkina Faso | 2021 | 0.00% |
| Burundi | 2021 | 0.00% |
| Cabo Verde | 2021 | 0.00% |
| Cambodia | 2023 | 58.72% |
| Cameroon | 2021 | 0.00% |
| Canada | 2024 | 2.93% |
| Cayman Islands | 2021 | 0.00% |
| Central African Republic | 2021 | 0.00% |
| Chad | 2021 | 0.00% |
| Chile | 2024 | 14.76% |
| China | 2023 | 61.34% |
| Colombia | 2024 | 12.42% |
| Comoros | 2021 | 0.00% |
| Congo, Dem. Rep. | 2021 | 0.00% |
| Congo, Rep. | 2021 | 0.00% |
| Costa Rica | 2021 | 0.00% |
| Cote d’Ivoire | 2021 | 0.00% |
| Croatia | 2023 | 7.55% |
| Cuba | 2021 | 0.00% |
| Curacao | 2021 | 0.00% |
| Cyprus | 2021 | 0.00% |
| Czechia | 2024 | 36.29% |
| Denmark | 2024 | 4.96% |
| Djibouti | 2021 | 0.00% |
| Dominica | 2021 | 0.00% |
| Dominican Republic | 2023 | 30.58% |
| Ecuador | 2021 | 0.00% |
| Egypt, Arab Rep. | 2021 | 0.00% |
| El Salvador | 2021 | 0.00% |
| Equatorial Guinea | 2021 | 0.00% |
| Eritrea | 2021 | 0.00% |
| Estonia | 2024 | 34.91% |
| Eswatini | 2023 | 2.66% |
| Ethiopia | 2021 | 0.00% |
| Faroe Islands | 2021 | 0.00% |
| Fiji | 2021 | 0.00% |
| Finland | 2024 | 2.60% |
| France | 2024 | 0.36% |
| French Polynesia | 2021 | 0.00% |
| Gabon | 2021 | 0.00% |
| Gambia, The | 2021 | 0.00% |
| Georgia | 2021 | 0.00% |
| Germany | 2024 | 23.53% |
| Ghana | 2021 | 0.00% |
| Gibraltar | 2015 | 0.00% |
| Greece | 2024 | 6.01% |
| Greenland | 2021 | 0.00% |
| Grenada | 2021 | 0.00% |
| Guam | 2021 | 0.00% |
| Guatemala | 2023 | 16.80% |
| Guinea | 2021 | 0.00% |
| Guinea-Bissau | 2021 | 0.00% |
| Guyana | 2021 | 0.00% |
| Haiti | 2021 | 0.00% |
| Honduras | 2023 | 0.52% |
| Hong Kong SAR, China | 2023 | 33.09% |
| Hungary | 2024 | 6.44% |
| Iceland | 2021 | 0.00% |
| India | 2023 | 74.43% |
| Indonesia | 2023 | 69.12% |
| Iran, Islamic Rep. | 2023 | 0.18% |
| Iraq | 2021 | 0.00% |
| Ireland | 2024 | 2.01% |
| Israel | 2024 | 13.97% |
| Italy | 2024 | 1.76% |
| Jamaica | 2021 | 0.00% |
| Japan | 2024 | 30.07% |
| Jordan | 2023 | 12.56% |
| Kazakhstan | 2023 | 58.36% |
| Kenya | 2021 | 0.00% |
| Kiribati | 2021 | 0.00% |
| Korea, Dem. People’s Rep. | 2023 | 33.61% |
| Korea, Rep. | 2024 | 32.60% |
| Kosovo | 2021 | 93.40% |
| Kuwait | 2021 | 0.00% |
| Kyrgyz Republic | 2023 | 11.45% |
| Lao PDR | 2023 | 23.81% |
| Latvia | 2023 | 0.00% |
| Lebanon | 2021 | 0.00% |
| Lesotho | 2021 | 0.00% |
| Liberia | 2021 | 0.00% |
| Libya | 2021 | 0.00% |
| Lithuania | 2021 | 0.00% |
| Luxembourg | 2021 | 0.00% |
| Madagascar | 2023 | 19.45% |
| Malawi | 2021 | 0.00% |
| Malaysia | 2023 | 45.02% |
| Maldives | 2021 | 0.00% |
| Mali | 2021 | 0.00% |
| Malta | 2021 | 0.00% |
| Marshall Islands | 2021 | 0.00% |
| Mauritania | 2021 | 0.00% |
| Mauritius | 2023 | 33.54% |
| Mexico | 2024 | 7.63% |
| Micronesia, Fed. Sts. | 2021 | 0.00% |
| Moldova | 2023 | 0.00% |
| Mongolia | 2023 | 85.15% |
| Montenegro | 2023 | 39.08% |
| Morocco | 2023 | 62.11% |
| Mozambique | 2021 | 0.00% |
| Myanmar | 2023 | 5.33% |
| Namibia | 2023 | 1.59% |
| Naoero | 2021 | 0.00% |
| Nepal | 2021 | 0.00% |
| Netherlands | 2024 | 8.16% |
| New Caledonia | 2021 | 39.05% |
| New Zealand | 2024 | 5.30% |
| Nicaragua | 2021 | 0.00% |
| Niger | 2023 | 17.09% |
| Nigeria | 2021 | 0.00% |
| North Macedonia | 2023 | 40.22% |
| Norway | 2024 | 0.08% |
| Oman | 2021 | 0.00% |
| Pakistan | 2023 | 12.78% |
| Palau | 2021 | 0.00% |
| Panama | 2023 | 3.49% |
| Papua New Guinea | 2021 | 0.00% |
| Paraguay | 2021 | 0.00% |
| Peru | 2023 | 0.06% |
| Philippines | 2023 | 62.49% |
| Poland | 2024 | 55.88% |
| Portugal | 2021 | 1.57% |
| Puerto Rico (US) | 2021 | 16.63% |
| Qatar | 2021 | 0.00% |
| Romania | 2023 | 13.95% |
| Russian Federation | 2023 | 18.12% |
| Rwanda | 2023 | 14.31% |
| Samoa | 2021 | 0.00% |
| Sao Tome and Principe | 2021 | 0.00% |
| Saudi Arabia | 2021 | 0.00% |
| Senegal | 2023 | 1.13% |
| Serbia | 2023 | 58.91% |
| Seychelles | 2021 | 0.00% |
| Sierra Leone | 2021 | 0.00% |
| Singapore | 2023 | 0.90% |
| Sint Maarten (Dutch part) | 2021 | 0.00% |
| Slovak Republic | 2024 | 3.08% |
| Slovenia | 2024 | 20.59% |
| Solomon Islands | 2021 | 0.00% |
| Somalia, Fed. Rep. | 2021 | 0.00% |
| South Africa | 2023 | 81.60% |
| South Sudan | 2021 | 0.00% |
| Spain | 2024 | 1.20% |
| Sri Lanka | 2023 | 29.70% |
| St. Kitts and Nevis | 2021 | 0.00% |
| St. Lucia | 2021 | 0.00% |
| St. Martin (French part) | 2021 | 0.00% |
| St. Vincent and the Grenadines | 2021 | 0.00% |
| Sudan | 2021 | 0.00% |
| Suriname | 2021 | 0.00% |
| Sweden | 2024 | 0.21% |
| Switzerland | 2021 | 0.00% |
| Syrian Arab Republic | 2021 | 0.00% |
| Tajikistan | 2023 | 4.60% |
| Tanzania | 2021 | 0.00% |
| Thailand | 2023 | 14.62% |
| Timor-Leste | 2021 | 0.00% |
| Togo | 2021 | 0.00% |
| Tonga | 2021 | 0.00% |
| Trinidad and Tobago | 2021 | 0.00% |
| Tunisia | 2021 | 0.00% |
| Turkiye | 2024 | 34.50% |
| Turkmenistan | 2021 | 0.00% |
| Turks and Caicos Islands | 2021 | 0.00% |
| Tuvalu | 2021 | 0.00% |
| Uganda | 2021 | 0.00% |
| Ukraine | 2023 | 22.17% |
| United Arab Emirates | 2022 | 0.46% |
| United Kingdom | 2024 | 0.94% |
| United States | 2024 | 15.69% |
| Uruguay | 2021 | 0.00% |
| Uzbekistan | 2023 | 11.13% |
| Vanuatu | 2021 | 0.00% |
| Venezuela, RB | 2021 | 0.00% |
| Viet Nam | 2023 | 44.76% |
| Virgin Islands (U.S.) | 2021 | 0.00% |
| West Bank and Gaza | 2021 | 0.00% |
| Yemen, Rep. | 2021 | 0.00% |
| Zambia | 2023 | 10.92% |
| Zimbabwe | 2023 | 54.14% |
How to interpret the comparison
First, the 209 latest observations span 2015–2024 rather than one common year. Second, 119 zeros are real values, not imputed missing data. Third, the indicator is a percentage and does not measure absolute coal-fired electricity. Fourth, it covers the electricity mix rather than total national energy use or total CO₂ emissions.
Fifth, differences between the annual groups should not be turned into a global trend because country coverage differs. A transition analysis should match countries over time and compare coal with renewables, gas, nuclear, hydro, and other sources.
Source and calculation
The source is World Bank World Development Indicators EG.ELC.COAL.ZS, Electricity production from coal sources (% of total). The 2024 mean, median, quartiles, threshold counts, and rankings are calculated from the 33 observations dated 2024. The 54 observations from 2023 are presented as a separate broader comparison.
Frequently Asked Questions
Is coal share the same as the amount of coal-fired electricity generated?
No. It is the percentage of total electricity production supplied by coal-category fuels; absolute generation is a separate measure.
What is the 2024 median?
The median across the 33 observations dated 2024 is 6.01%, while the mean is 13.12%.
Were zero values created by filling missing data?
No. The zeros are published source values indicating a 0% coal share for the corresponding observation year.
Related Articles
Green Map creates custom-edited map images using open geographic data sources such as geoBoundaries, Natural Earth, OpenStreetMap, and government open data. These maps are edited visual materials, not raw data files, and are provided for education, documents, presentations, and graphic reference.