The World Bank indicator EG.ELC.PETR.ZS reports the share of electricity production that comes from oil sources. The latest non-empty observation is available for 209 countries and territories, but the observation year is not uniform: 71 values are from 2021, 2 from 2022, 95 from 2023, and 41 from 2024. The dataset is therefore a comparison of each economy’s latest available oil share, not a complete 2024 world ranking.
Across the 209 latest observations, the unweighted mean is 28.69% and the median is only 4.20%. That gap reflects a highly uneven distribution. There are 42 observations at 80% or more, while many countries sit close to zero. Exactly 13 observations are zero and 57 more are positive but below 1%. The global pattern is split between systems with minimal oil-fired generation and systems where oil accounts for most electricity output.
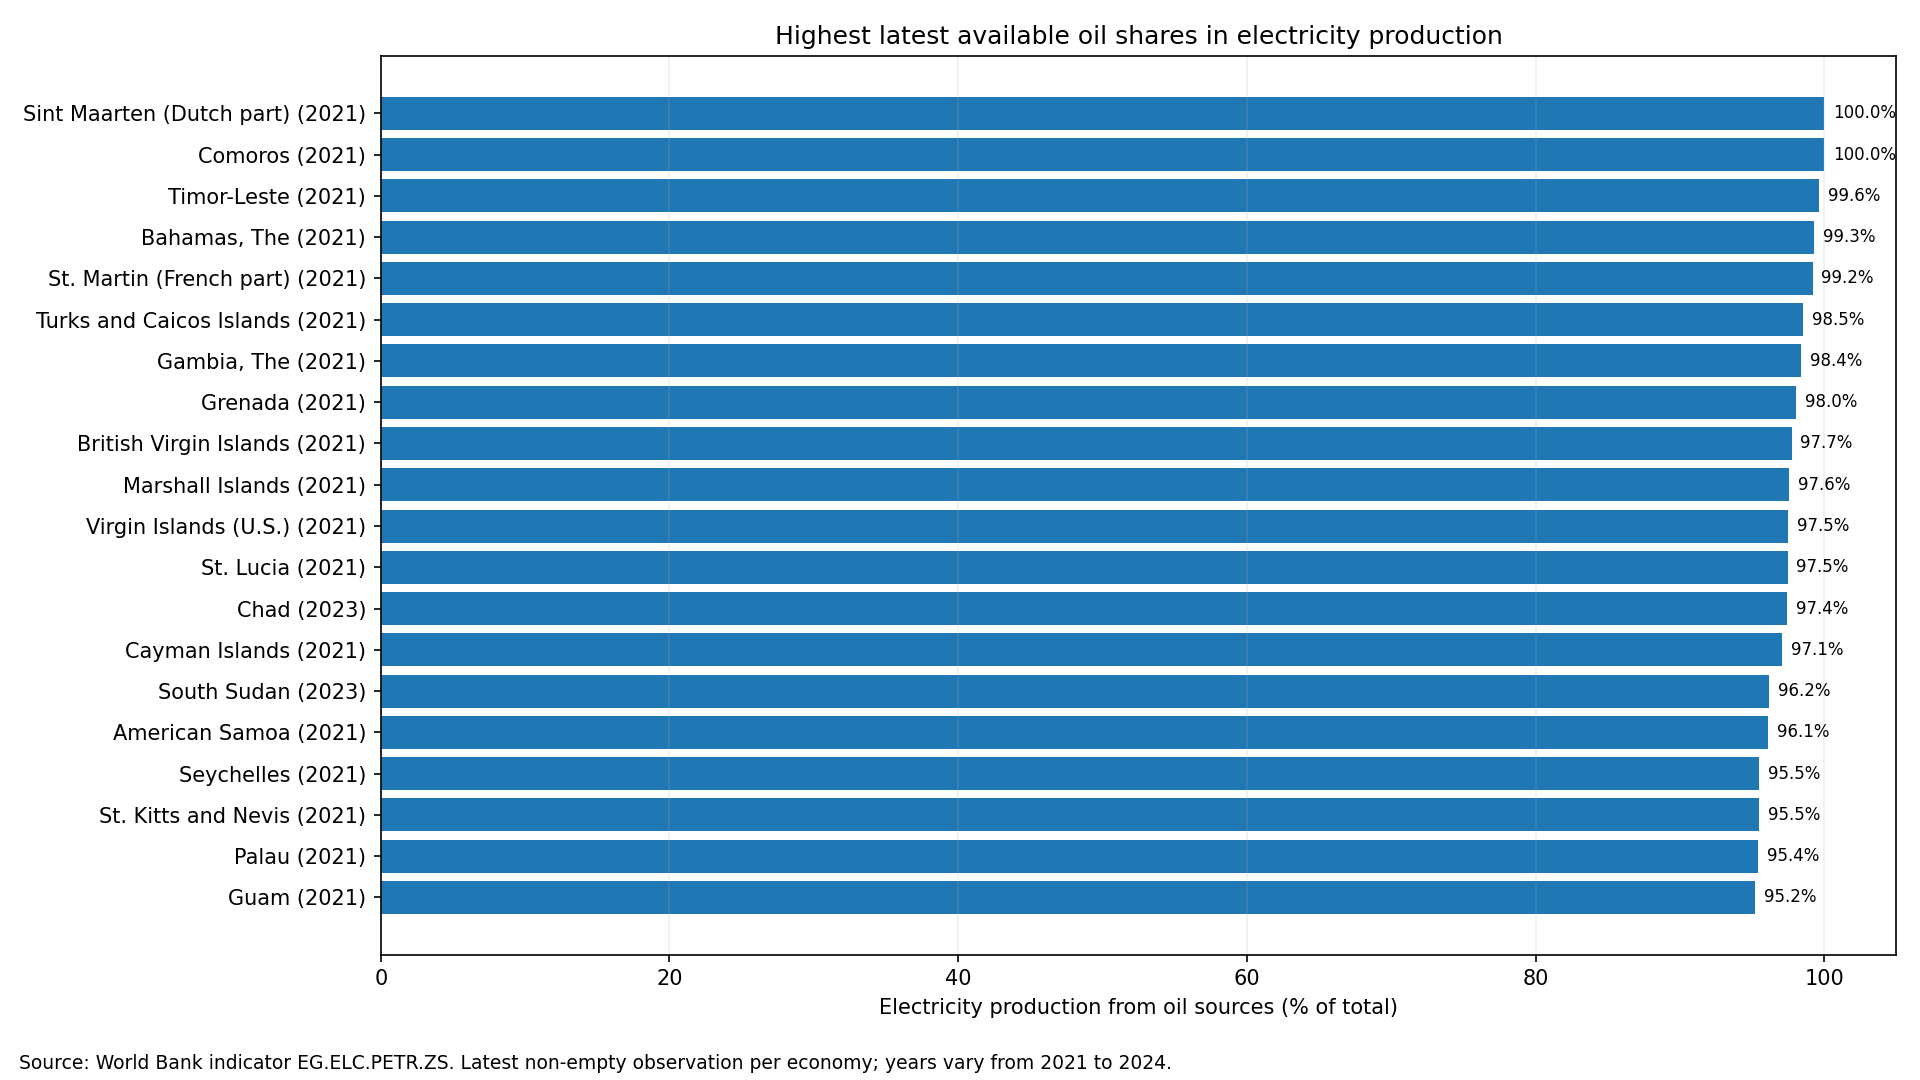
Table of Contents
Latest available does not mean the same calendar year
The source query uses the most recent non-empty value for each country or territory. This improves geographic coverage because a country does not disappear simply because it lacks a 2024 observation. The trade-off is temporal comparability. Only 41 of the 209 observations are from 2024, while 95 are from 2023 and 71 are from 2021. Any ranking should therefore retain the observation year next to the percentage.
The timing issue is visible at the top of the distribution. Comoros and Sint Maarten both have 100%, but those observations are from 2021. Timor-Leste at 99.63%, The Bahamas at 99.30%, and St. Martin at 99.19% are also 2021 values. Chad at 97.41% and South Sudan at 96.16% are 2023 values. A higher value is not the same thing as a more recent value.
The upper tail contains many oil-dominant electricity systems
Comoros and Sint Maarten share the highest latest observation at 100%. Timor-Leste follows at 99.63%, then The Bahamas at 99.30%, St. Martin at 99.19%, Turks and Caicos Islands at 98.52%, The Gambia at 98.40%, and Grenada at 98.03%. In these observations, oil accounts for nearly all reported electricity production.
The indicator’s denominator is total electricity production. It is not the share of oil in total national energy consumption and it does not include transport fuels, industrial petroleum use, or heating fuel outside electricity production. A 95% value therefore describes the electricity generation mix, not a country’s entire energy balance.
| Rank | Country or territory | Observation year | Oil share |
|---|---|---|---|
| 1 | Comoros | 2021 | 100.00% |
| 2 | Sint Maarten (Dutch part) | 2021 | 100.00% |
| 3 | Timor-Leste | 2021 | 99.63% |
| 4 | Bahamas, The | 2021 | 99.30% |
| 5 | St. Martin (French part) | 2021 | 99.19% |
| 6 | Turks and Caicos Islands | 2021 | 98.52% |
| 7 | Gambia, The | 2021 | 98.40% |
| 8 | Grenada | 2021 | 98.03% |
| 9 | British Virgin Islands | 2021 | 97.75% |
| 10 | Marshall Islands | 2021 | 97.57% |
| 11 | Virgin Islands (U.S.) | 2021 | 97.50% |
| 12 | St. Lucia | 2021 | 97.46% |
| 13 | Chad | 2023 | 97.41% |
| 14 | Cayman Islands | 2021 | 97.06% |
| 15 | South Sudan | 2023 | 96.16% |
A 4.20% median tells a very different story from the mean
The median of 4.20% means the middle observation, after sorting all 209 values, is only about four percent. The mean of 28.69% is much higher because the large cluster of 80–100% observations pulls it upward. Reporting only the average would make oil appear more typical in electricity systems than the ordered distribution suggests.
The first quartile is 0.44% and the third quartile is 61.92%. The middle half of observations therefore spans a very wide range. Excluding exact zeros, 57 observations are below 1%, 47 are from 1% to under 10%, 38 are from 10% to under 50%, 12 are from 50% to under 80%, and 42 are at least 80%. This distribution is better understood as several distinct groups than as one smooth global average.
Zero and near-zero observations should remain distinct
There are 13 reported zeros in the latest-observation dataset. Those are numeric source observations, not missing values replaced by zero. Several countries have positive values that are extremely small: Paraguay is about 0.0019%, Bahrain 0.0027%, and Ethiopia 0.0097%. Rounding all of them to zero would erase a real distinction in the source.
Iceland at 0.0205%, Switzerland at 0.0230%, and Norway at 0.0247% also sit close to zero. The oil-share indicator alone does not explain why. Hydropower, nuclear, gas, wind, imports, grid size, and other factors may matter, but those variables are outside this dataset. The source tells us the composition outcome, not the mechanism behind it.
A strict 2024 comparison covers only 41 observations
If same-year comparability is more important than geographic coverage, the 2024 subset can be used on its own. That leaves only 41 countries and territories. The advantage is a common time reference; the disadvantage is that most of the 209 latest observations disappear. A 2024-only table should therefore not be presented as if it represented the same geographic coverage as the latest-value dataset.
| 2024 rank | Country or territory | Oil share |
|---|---|---|
| 1 | Costa Rica | 10.54% |
| 2 | Kenya | 8.79% |
| 3 | Greece | 8.54% |
| 4 | Mexico | 7.39% |
| 5 | Colombia | 4.05% |
| 6 | Argentina | 3.60% |
| 7 | Spain | 3.17% |
| 8 | Italy | 3.16% |
| 9 | Japan | 2.28% |
| 10 | Portugal | 2.24% |
The two views answer different questions. The latest-observation view asks where oil currently appears most or least important in the newest available national data. The 2024-only view asks how the subset with 2024 reporting compares in one calendar year. Keeping those questions separate avoids mixing coverage differences with time differences.
Many high-share observations come from island electricity systems
The upper part of the table includes numerous Caribbean and Pacific island jurisdictions, including The Bahamas, Turks and Caicos Islands, Grenada, the British Virgin Islands, the Marshall Islands, the U.S. Virgin Islands, St. Lucia, and the Cayman Islands. That is a clear geographic pattern in the observed values. It does not, by itself, prove that island geography causes a high oil share.
Non-island countries such as Chad and South Sudan also appear near the top. Explaining the pattern would require additional information on installed generation, fuel supply, grid structure, and investment. The country distribution can reveal clusters and exceptions, but it cannot identify a single causal explanation.
A high percentage is not the same as a large amount of oil-fired electricity
A 100% share can occur in a very small electricity system. A much larger power system could generate more electricity from oil in absolute terms while still recording a small percentage because other sources produce far more electricity. The percentage therefore measures composition, not the amount of oil-fired generation in gigawatt-hours.
Absolute output would require an electricity-generation quantity series. Questions about cost, emissions, or fuel dependence would require additional denominators and variables such as total generation, fuel input, generation efficiency, or emission factors. The percentage is valuable because it isolates one dimension of the power mix, but it should not be stretched beyond that purpose.
Mixed observation years cannot be interpreted as a trend
A country with a 2021 latest value and another with a 2024 latest value are not points on the same national time series. The difference between them cannot be described as a three-year increase or decline. Trend analysis requires at least two observations for the same country under the same indicator definition.
The World Bank latest-value approach reduces missing geographic coverage but sacrifices a common date. Filtering to one year does the opposite. Neither choice is universally better: the appropriate method depends on whether the user’s priority is broad country coverage or strict time comparability.
Source and calculation notes
The source is the World Bank indicator EG.ELC.PETR.ZS, “Electricity production from oil sources (% of total).” The analysis uses the latest non-empty official observation for 209 countries and territories. Mean, median, quartiles, distribution bands, and rankings are calculated directly from those observations. The World Bank API provides the same indicator series.
Observation years are preserved throughout the analysis, and unavailable data are not converted to zero. A zero is treated as zero only when the source provides a numeric zero observation. That distinction is essential for maps and rankings because no-data and zero describe different states.
Frequently Asked Questions
Is this a complete 2024 global ranking?
No. The 209 latest observations mix 2021, 2022, 2023, and 2024. Only 41 countries and territories in this dataset have a 2024 observation.
Does a 100% oil share mean all national energy consumption is oil?
No. The denominator is total electricity production. The indicator does not represent all transport, industrial, heating, or other energy use.
Are zero values missing data filled with zero?
No. Zero is used only where the World Bank provides a numeric zero observation. Unavailable observations are not converted to zero.
Related Articles
Green Map creates custom-edited map images using open geographic data sources such as geoBoundaries, Natural Earth, OpenStreetMap, and government open data. These maps are edited visual materials, not raw data files, and are provided for education, documents, presentations, and graphic reference.