This 2024 comparison uses the U.S. Energy Information Administration series for petroleum liquids consumed for useful thermal output in the Electric Power Sector Non-CHP. The EIA field is consumption-uto, the fuel facet is PEL, the sector facet is 90, and the unit is thousand barrels. The table covers all 50 states. It does not measure electricity generation, total state petroleum demand, refinery output, transportation fuel use, or all fuels used by the power sector.
The 50 state observations sum to 65.99539 thousand barrels. Alaska is highest at 38.828, followed by Missouri at 18.097 and Iowa at 3.889. Alaska alone accounts for 58.8% of the 50-state sum, while Alaska and Missouri together account for 86.3%. The top three reach 92.1% and the top ten 99.8%. Only 13 states have positive values; the other 37 are reported by EIA as exactly 0.000.
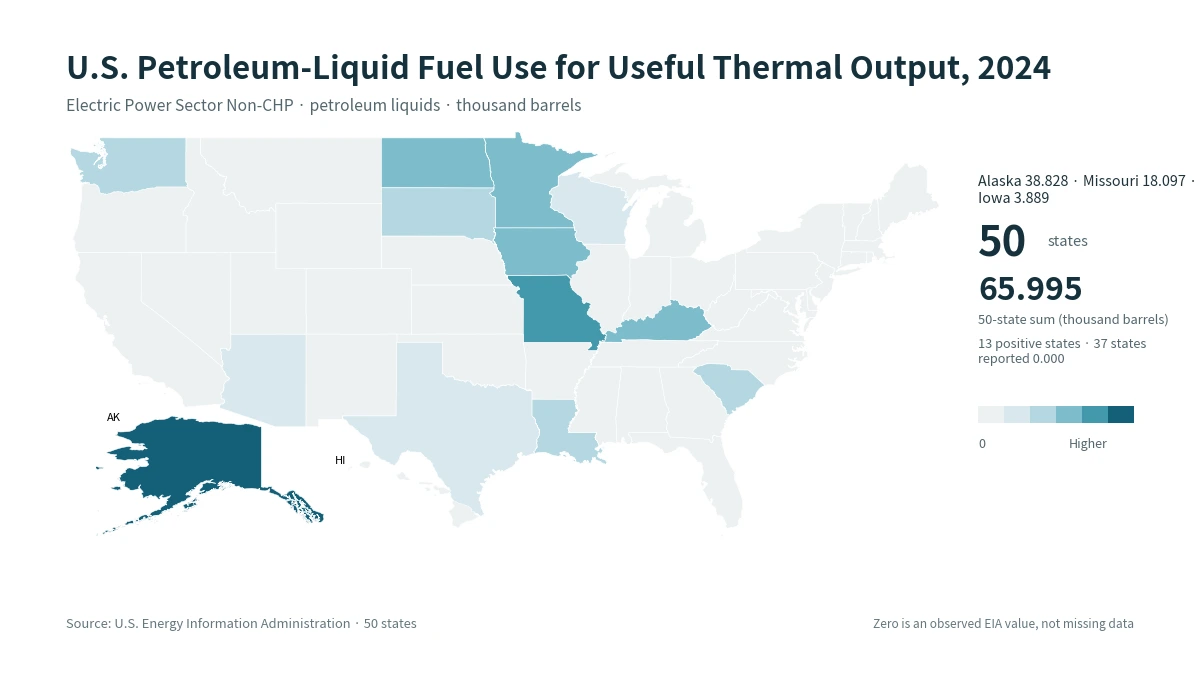
Table of Contents
What this EIA series measures
The phrase “useful thermal output” is part of the statistical identity of the series and should not be treated as a synonym for electricity generation. The observation is a physical fuel quantity, not megawatt-hours of electricity and not a heat-rate measure. The same state can have very different values in neighboring EIA series because the field, fuel category, sector, or unit changes. A comparison is valid only when those dimensions remain fixed across all states.
The narrow scope matters for interpretation. Petroleum liquids in this series are not equivalent to all petroleum products consumed in a state. They also do not represent highway diesel, heating oil sold to households, refinery production, or total electric-sector energy input. A large value therefore means that the selected EIA Non-CHP useful-thermal-output series records a relatively large physical quantity for that state in 2024; it does not by itself identify the state as petroleum dependent or inefficient.
Alaska and Missouri dominate the 2024 total
Alaska records 38.828 thousand barrels, about 2.15 times Missouri’s 18.097. Iowa is third at 3.889, followed by Kentucky at 1.459 and North Dakota at 1.198. Minnesota, South Dakota, South Carolina, Louisiana, and Washington complete the top ten. Because these are absolute physical quantities, the ranking is not adjusted for population, generating capacity, electricity sales, or total generation.
| Rank | State | 2024 value (thousand barrels) |
|---|---|---|
| 1 | Alaska | 38.828 |
| 2 | Missouri | 18.097 |
| 3 | Iowa | 3.889 |
| 4 | Kentucky | 1.459 |
| 5 | North Dakota | 1.198 |
| 6 | Minnesota | 1.106 |
| 7 | South Dakota | 0.619 |
| 8 | South Carolina | 0.285 |
| 9 | Louisiana | 0.220 |
| 10 | Washington | 0.192 |
Concentration is extreme. Alaska contributes 58.8% of the 50-state sum, and Alaska plus Missouri contribute 86.3%. The top three account for 92.1%, the top five for 96.2%, and the top ten for 99.8%. A national-looking average can therefore conceal the actual shape of the state distribution. Most of the physical quantity is concentrated in a very small number of states rather than spread evenly across the country.
Only 13 states have positive observations
Thirteen states report a value above zero. After the top ten, Wisconsin records 0.075, Arizona 0.026, and Texas 0.00100 thousand barrels. Texas is positive even though the quantity is only 0.00100. Keeping that small observation distinct from an exact zero matters because it separates a recorded positive quantity from states that EIA reports as 0.000 in this specific series.
| Positive-value rank | State | 2024 value (thousand barrels) |
|---|---|---|
| 1 | Alaska | 38.828 |
| 2 | Missouri | 18.097 |
| 3 | Iowa | 3.889 |
| 4 | Kentucky | 1.459 |
| 5 | North Dakota | 1.198 |
| 6 | Minnesota | 1.106 |
| 7 | South Dakota | 0.619 |
| 8 | South Carolina | 0.285 |
| 9 | Louisiana | 0.220 |
| 10 | Washington | 0.192 |
| 11 | Wisconsin | 0.075 |
| 12 | Arizona | 0.026 |
| 13 | Texas | 0.00100 |
The arithmetic mean across the 50 states is 1.31991 thousand barrels, but the median is exactly 0.000. Both middle observations are zero when the states are sorted from low to high. That contrast is a direct consequence of the distribution: 37 exact zeros coexist with two very large values and several smaller positive observations. The mean is useful for the total divided by 50, but it is not a good description of a typical state in this case.
The 37 zero values are observations, not missing data
EIA reports 37 states as 0.000. Those rows are numeric zeros rather than blank or unavailable observations. They should therefore remain zero in the map and summary instead of being converted to “no data,” replaced with values from another year, or imputed from neighboring states. Missingness and a reported zero have different meanings: a missing value says the observation is unavailable, while a zero says the selected series reports no measurable quantity at the published precision for that state and year.
A zero in this table also does not mean that the state uses no petroleum anywhere in its energy system. The identity is much narrower: petroleum liquids, useful thermal output, Electric Power Sector Non-CHP, annual 2024, thousand barrels. The same state may have positive petroleum consumption in another sector, another EIA field, a CHP series, a different petroleum product category, or a heat-content measure. Interpreting zero only within the selected series prevents an overly broad conclusion.
The map shows isolated high states rather than a single broad region
The darkest values are Alaska and Missouri, with Iowa forming the next prominent tier. Positive observations continue through parts of the northern plains and Midwest, while South Carolina and Louisiana provide positive values in the Southeast. Washington, Wisconsin, Arizona, and Texas are also positive at much smaller levels. Most other states fall into the exact-zero band. The spatial pattern is therefore patchy: a few states stand out sharply rather than one contiguous region showing uniformly high values.
Geography alone does not establish a cause. The state table contains the quantity but not the variables needed to determine why Alaska, Missouri, or Iowa rank where they do. Plant configuration, operating practices, fuel logistics, facility-specific thermal uses, outages, and reporting boundaries could all matter, but the selected series cannot separate those mechanisms. Explaining causation would require additional EIA plant, generation, fuel, and operational data for the same year.
Why the top-two share matters
Alaska and Missouri together total 56.92500 thousand barrels, equal to 86.3% of the 50-state sum. With such a concentrated distribution, a change in either state can move the national state-sum substantially even if most states do not change. For year-to-year analysis, it is therefore useful to track both the total and each leading state’s contribution rather than assuming that a change in the aggregate reflects a broad national movement.
The share should not be confused with petroleum-market share or electric-market share. Its numerator is the selected consumption-uto petroleum-liquid observation, and its denominator is the sum of those same 50 state observations. Refinery production, electricity generation, sales, capacity, fuel expenditures, and total state energy consumption all use different numerators or denominators. The percentage is informative only when that statistical boundary is kept explicit.
How to distinguish this series from similar EIA measures
EIA electricity tables contain several series with very similar human-readable titles. Petroleum liquids can appear in fuel used for electricity generation, fuel used for useful thermal output, physical-unit tables, and heat-content tables. Sector facets can also separate CHP and Non-CHP activity. Two series may both mention petroleum and electric power while measuring different quantities. Reusing a value from the wrong field would create a subtle but important mismatch even if the year and geography were correct.
For this comparison, the identifying dimensions are annual frequency, year 2024, fueltypeid PEL, sectorid 90, field consumption-uto, and unit thousand barrels. Those dimensions define the series more precisely than a shortened title. Keeping them fixed also makes later comparisons reproducible. A 2023 or 2025 extension should use the same route and facets; otherwise any apparent change might reflect a definition change rather than a real change in the published quantity.
A one-year snapshot is not a long-term trend
The ranking describes 2024 only. Alaska being highest in 2024 does not establish that it is always highest, and a state reported at 0.000 in 2024 should not be assumed to be zero in every year. Fuel use can respond to plant operation, maintenance, fuel availability, prices, system conditions, and changes in the facilities covered by a reporting category. A trend claim requires multiple years from the same statistical series.
When additional years are compared, the count of positive states is as informative as the aggregate sum. A future year in which more states become positive can represent a different structural pattern from a year in which the same 13 states remain positive but Alaska changes sharply. Tracking the sum, number of positive states, concentration ratios, and state ranks together provides a clearer description of change than any one statistic alone.
Key numbers from the 2024 state comparison
The 50-state sum is 65.99539 thousand barrels. The mean is 1.31991, the median 0.000, the first quartile 0.00000, and the third quartile 0.00075. Alaska, Missouri, and Iowa are the top three and together account for 92.1% of the total. There are 13 positive states and 37 exact-zero states, with no missing state rows in the 2024 table.
These numbers support a descriptive comparison of physical quantities under one EIA definition. They do not by themselves measure efficiency, economic dependence, emissions intensity, reliability, or per-capita use. Those questions require additional variables and usually a denominator such as electricity generation, capacity, population, or another fuel total. Separating the direct state observations from those different analytical questions keeps the interpretation aligned with what the EIA series actually reports.
Frequently Asked Questions
Do the 37 states reported as 0.000 have missing data?
No. EIA provides numeric zero observations for those states in this series. They should remain zero rather than being treated as unavailable data.
Does this measure total petroleum consumption in each state?
No. It is the 2024 EIA petroleum-liquids, Electric Power Sector Non-CHP, consumption-uto series measured in thousand barrels.
Can these values explain why Alaska is highest?
Not by themselves. The state quantities establish the ranking, but causal analysis requires additional official data on plants, operations, generation, and fuel conditions.
Related Articles
Green Map creates custom-edited map images using open geographic data sources such as geoBoundaries, Natural Earth, OpenStreetMap, and government open data. These maps are edited visual materials, not raw data files, and are provided for education, documents, presentations, and graphic reference.