The 2023 World Bank data show a strikingly wide range in the share of merchandise imports sourced from low- and middle-income economies in the same World Bank region. The country-and-economy frame contains 217 codes, with a reported 2023 value for 202 and no value for 15. Across the 202 observations, the median is 13.094% and the mean is 19.715%. The gap between those two statistics immediately signals a right-skewed distribution: a smaller group of economies has very high intraregional low- and middle-income sourcing shares.
Indicator TM.VAL.MRCH.WR.ZS is a composition measure, not a measure of the absolute value of imports. It takes merchandise imports from other low- and middle-income economies in the same World Bank region and expresses them as a percentage of all merchandise imports received by the reporting economy. A value of 40%, for example, means that roughly two-fifths of the reporting economy’s merchandise imports came from that defined partner group in 2023.
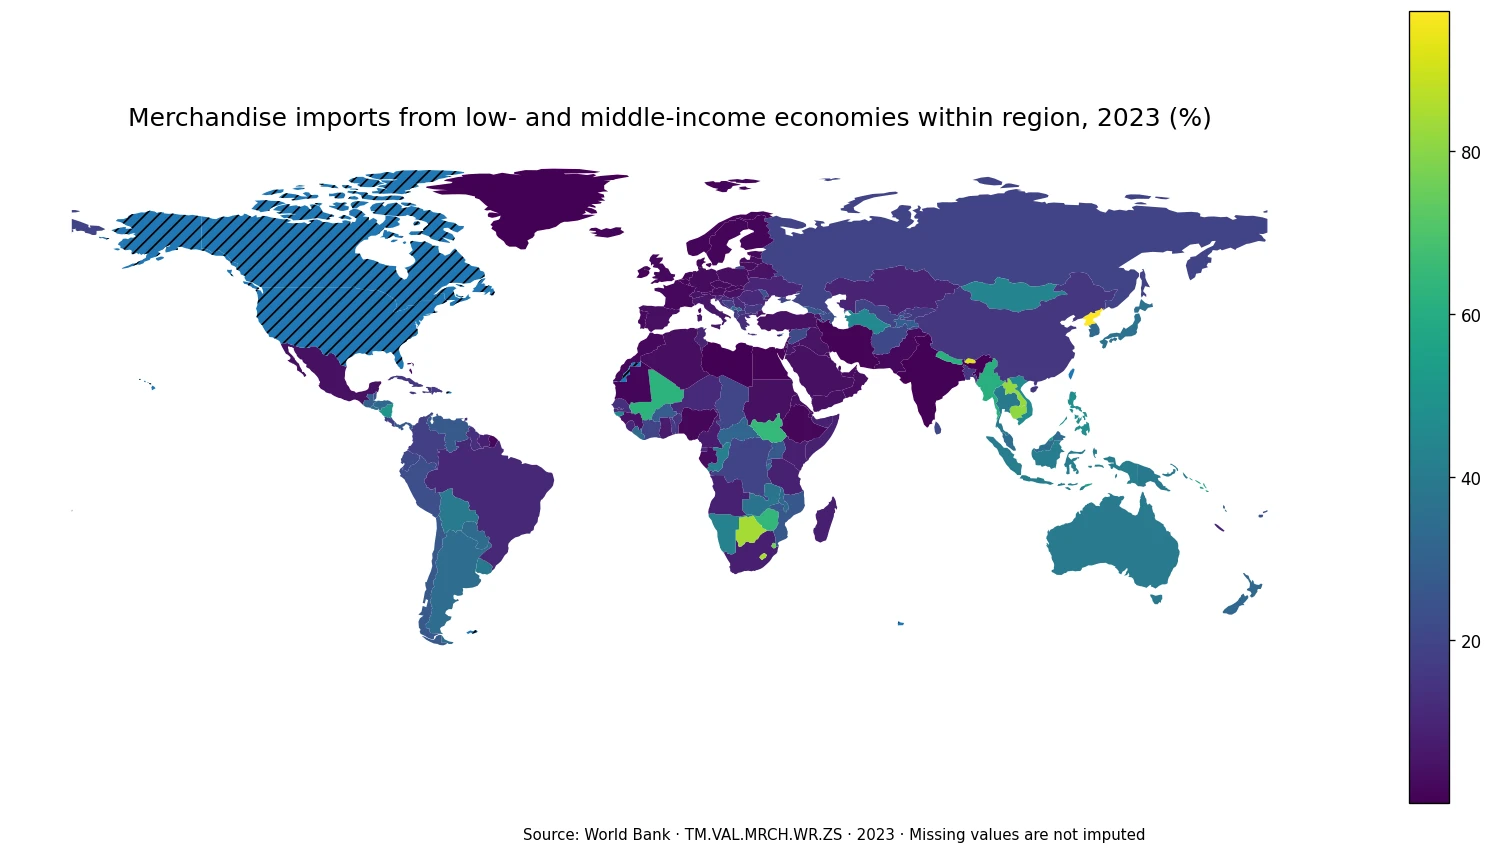
Table of Contents
What the indicator measures—and what it does not
The denominator is total merchandise imports, so this indicator answers a sourcing question rather than a scale question. A large importing economy can post a low percentage if most goods are bought from high-income economies or from low- and middle-income economies in other regions. A much smaller importer can post a high percentage when nearby or regionally connected low- and middle-income suppliers account for most merchandise purchases. Comparing the percentages therefore reveals differences in the geographic and income-group composition of import supply chains.
The phrase “within region” also has a specific meaning. It refers to the World Bank regional classification, not merely to countries that share a land border. An economy can source goods from a partner elsewhere in the same region and still have those imports counted in the numerator. That distinction matters for island economies, large regions, and places whose strongest trade route is maritime rather than overland. The indicator should not be read as a simple neighbor-trade statistic.
The 2023 distribution is highly uneven
The lowest reported value is 0.011% and the highest is 97.101%, a spread of more than 97 percentage points. The first quartile is 3.935% and the third quartile is 30.149%, so the middle half of observed economies lies between about 3.9% and 30.1%. Fifty-nine observations are at or below 5%, while 52 are above 30%. Sixteen are above 50%, and six exceed 80%. Those counts show why a single global average is not a good stand-in for the typical economy.
The median of 13.094% divides the observed economies in half, while the mean of 19.715% is pulled upward by the high end of the distribution. This shape is economically informative. In many places, same-region low- and middle-income suppliers account for only a small part of total merchandise imports. In a smaller set, however, they dominate or nearly dominate the import basket. Looking at the median, quartiles, and outliers together provides a clearer picture than focusing only on the average.
Economies with the highest shares
| Country or economy | 2023 share |
|---|---|
| Korea, Dem. People’s Rep. | 97.101% |
| Bhutan | 91.504% |
| Lesotho | 84.956% |
| Botswana | 84.076% |
| Lao PDR | 81.866% |
| Cambodia | 80.928% |
| Eswatini | 76.001% |
| South Sudan | 64.851% |
| Zimbabwe | 64.239% |
| Mali | 62.499% |
The highest reported value is 97.101% for the Democratic People’s Republic of Korea, followed by Bhutan at 91.504%. Lesotho (84.956%), Botswana (84.076%), Lao PDR (81.866%), and Cambodia (80.928%) also exceed 80%. Eswatini is at 76.001%, while South Sudan, Zimbabwe, and Mali range from roughly 62% to 65%. These are not rankings of total import volume; they indicate how strongly the composition of merchandise imports is tilted toward the defined same-region low- and middle-income partner group.
The top of the distribution spans more than one part of the world. Southern Africa contributes several very high values, but Bhutan, Lao PDR, and Cambodia show similarly strong shares in Asia. Nepal is at 61.474% and Myanmar at 61.346%, while the Philippines and Viet Nam are at 47.529% and 46.291%, respectively. That geographic spread suggests that a high share can emerge under different trade structures, and the indicator alone cannot identify whether transport geography, production networks, trade agreements, commodity needs, or another factor is responsible.
Economies with the lowest shares
| Country or economy | 2023 share |
|---|---|
| Greenland | 0.011% |
| Libya | 0.036% |
| Cabo Verde | 0.689% |
| Israel | 0.703% |
| India | 0.761% |
| Iran, Islamic Rep. | 0.850% |
| Gibraltar | 0.895% |
| Luxembourg | 0.972% |
| Ireland | 0.976% |
| Egypt, Arab Rep. | 1.084% |
At the low end, Greenland is at 0.011% and Libya at 0.036%. Cabo Verde (0.689%), Israel (0.703%), India (0.761%), Iran (0.850%), Gibraltar (0.895%), Luxembourg (0.972%), Ireland (0.976%), and Egypt (1.084%) round out the bottom ten. A very low value does not mean that an economy imports few goods. It means that the specified partner group contributes only a small share of the reporting economy’s total merchandise imports.
This distinction is especially important when interpreting large trading economies. India’s 0.761% value, for instance, cannot be used to infer that India has little regional trade overall. The numerator is restricted to imports from low- and middle-income economies in the same World Bank region, while imports from other regions and other income groups sit outside that numerator. A complete sourcing profile needs the corresponding outside-region indicator, high-income partner shares, and ideally bilateral trade data.
Southern Africa shows both a strong cluster and a sharp neighbor contrast
One of the clearest spatial patterns on the map appears in Southern Africa. Lesotho, Botswana, Eswatini, and Zimbabwe all have high shares, ranging from 64.239% to 84.956%. Yet South Africa is much lower at 8.077%. That contrast is useful because it prevents an overly broad regional conclusion. Even where small neighboring economies are strongly oriented toward same-region low- and middle-income suppliers, a larger nearby economy can have a far more diversified or differently classified import base.
Other African observations reinforce that heterogeneity. South Sudan is at 64.851% and Mali at 62.499%, while Uganda is at 26.939%, Ghana at 7.007%, Kenya at 8.177%, Tanzania at 8.946%, Nigeria at 1.882%, Egypt at 1.084%, Morocco at 2.173%, and Algeria at 3.614%. The continent therefore contains both high and very low shares. The map is most useful when it is read as a mosaic rather than as a single continental pattern.
Southeast Asia forms another visible high-share zone
Several Southeast Asian economies show sizable 2023 shares: Lao PDR is at 81.866%, Cambodia at 80.928%, the Philippines at 47.529%, Viet Nam at 46.291%, Indonesia at 41.105%, Thailand at 39.254%, and Malaysia at 34.197%. The pattern is consistent with substantial sourcing from low- and middle-income partners inside the same broad region, although the exact mechanisms cannot be inferred from this percentage alone. Product composition and partner-level data would be needed to see whether the pattern is driven by intermediate goods, food, energy, machinery, or another category.
Small economies create a cartographic caveat. Singapore has a reported 34.435% value, Hong Kong SAR, China 49.568%, and several Pacific islands also have valid observations, but many are too small to appear as separate polygons in a low-resolution world map. Their values remain part of the summary statistics and source table. The absence of a clearly visible colored area on the map should therefore not be interpreted as missing data.
Europe is generally lower, but not uniform
Many European economies sit toward the lower part of the distribution. France is at 2.120%, the United Kingdom 2.269%, Germany 2.755%, Spain 3.538%, and Poland 3.564%. Italy is higher at 6.007%, Ukraine at 9.915%, Romania at 11.252%, and the Russian Federation at 19.384%. These differences show that a broad regional label still leaves considerable variation in the composition of import partners.
A low within-region low- and middle-income share can arise when imports are sourced predominantly from high-income partners, from other World Bank regions, or from a mixture of both. The indicator does not separate those alternatives. That is why the corresponding measure for imports from low- and middle-income economies outside the region is particularly useful as a companion. Together, the two percentages begin to show whether low- and middle-income sourcing is mainly regional or cross-regional.
South Asia illustrates how large neighbor gaps can be
South Asia contains one of the largest internal contrasts in the dataset. Bhutan is at 91.504% and Nepal at 61.474%, while India is at 0.761%, Pakistan at 2.175%, and Bangladesh at 15.410%. Those figures sit within the same broad regional framework but describe very different sourcing structures. Market size, transport routes, industrial specialization, and bilateral trading relationships may all matter, yet none of them can be isolated from the indicator by itself.
The same caution applies to any attempt to treat high shares as a simple measure of regional integration. A high percentage may reflect broad intraregional sourcing across many partners, or it may be driven by a small number of dominant suppliers. A low percentage may coexist with intensive trade in services or with strong merchandise links to high-income neighbors that are outside the numerator. Bilateral import shares are needed before conclusions can be made about concentration or dependence on individual partners.
The Americas also show a broad range
Across selected Latin American economies, Argentina records 34.366%, Chile 26.923%, Peru 23.075%, Colombia 17.678%, and Brazil 10.922%, while Mexico is lower at 3.950%. The United States and Canada have no 2023 observation in this extract and are therefore left missing rather than assigned a zero. That treatment matters because 0% is a valid numerical claim, whereas missing means no comparable value is available in the selected year.
The difference between a missing observation and a small observed percentage is one of the most important technical points in any choropleth. Filling missing records with zero would incorrectly place them among the lowest economies and distort both the distribution and the visual pattern. The calculations here use only the 202 available 2023 observations; the 15 missing records are excluded from the mean, median, quartiles, and rankings.
A high share is not automatically good or bad
A high same-region sourcing share can indicate strong regional production networks, short supply chains, or access to nearby suppliers. It may also mean that an economy is more exposed to a disruption affecting the same region. A lower share can reflect access to a wider global supplier base, but it can also involve longer transport routes or dependence on a different group of large partners. The percentage describes structure, not performance, and should not be scored as inherently positive or negative.
It is also not a direct measure of import concentration. An economy can have an 80% share sourced from low- and middle-income economies in the same region while spreading those imports across many partners. Another economy can have only a 10% share from that group but be heavily dependent on one supplier elsewhere. Measuring concentration requires partner-level shares or an index designed for that purpose. This indicator is better suited to identifying the broad regional and income-group orientation of merchandise sourcing.
A single year is a snapshot, not a trend
The map uses 2023 because it is the common comparison year in the verified dataset. Merchandise trade shares can change quickly when exchange rates move, commodity prices swing, transport costs shift, trade restrictions are introduced, or supply chains are reorganized. A high or low value in one year should therefore be treated as a snapshot. Establishing whether an economy is becoming more or less regionally oriented requires a time series built with the same indicator definition.
The geographic frame contains 217 country and economy codes, with 202 observed values and 15 missing values in 2023. The low-resolution world boundary can display 168 of the valid observations as separate polygons. Small islands and separately reported territories account for much of the difference. Their numeric observations are preserved in the data and summary tables even when a distinct map polygon is unavailable.
Which indicators add the most context
The most direct companion is merchandise imports from low- and middle-income economies outside the reporting economy’s region. Comparing the within-region and outside-region shares helps distinguish regional sourcing from cross-regional sourcing among low- and middle-income partners. A high-income sourcing measure can add another layer, while bilateral import data can reveal whether a high aggregate share is diversified across partners or concentrated in only a few.
Absolute merchandise import values and merchandise trade as a share of GDP answer different questions and are also useful. The same 40% sourcing share can represent a very different dollar amount in a small economy than in a large one. Product-level data matter as well, because a high regional share driven by food or energy has a different economic meaning from one driven by machinery or electronic components. The 2023 map is therefore best used as a starting point for identifying where regional low- and middle-income sourcing is unusually strong or unusually limited.
Frequently Asked Questions
What does merchandise imports from low- and middle-income economies within region mean?
It is the share of a reporting economy’s total merchandise imports that comes from low- and middle-income economies in the same World Bank region.
Does a high share mean dependence on one trading partner?
Not necessarily. A high aggregate share can be spread across many partners. Partner-level import data are needed to measure dependence on individual economies.
Were missing 2023 values treated as zero?
No. The 15 records without a 2023 observation remain missing and are excluded from the mean, median, rankings, and mapped values.
Related Articles
Green Map creates custom-edited map images using open geographic data sources such as geoBoundaries, Natural Earth, OpenStreetMap, and government open data. These maps are edited visual materials, not raw data files, and are provided for education, documents, presentations, and graphic reference.