World Bank data for 2023 allow a matched comparison of labor-force participation among women and men with advanced education in 106 reporting economies. Across those matched observations, the female series averages 74.015% and the male series 81.539%. The median female-minus-male gap is -5.253 percentage points. Men have the higher rate in 95 economies, while women have the higher rate in 11. The distribution therefore leans strongly toward higher male participation, but the size of the gap varies enormously.
These indicators are not employment rates for all women and men. Each denominator is the working-age population of the same sex that has advanced education, while the numerator is the labor force within that group. The labor force includes people who are employed and people who are unemployed but participating in the labor market. The measure is therefore best read as labor-force participation among people with advanced education, separated by sex.
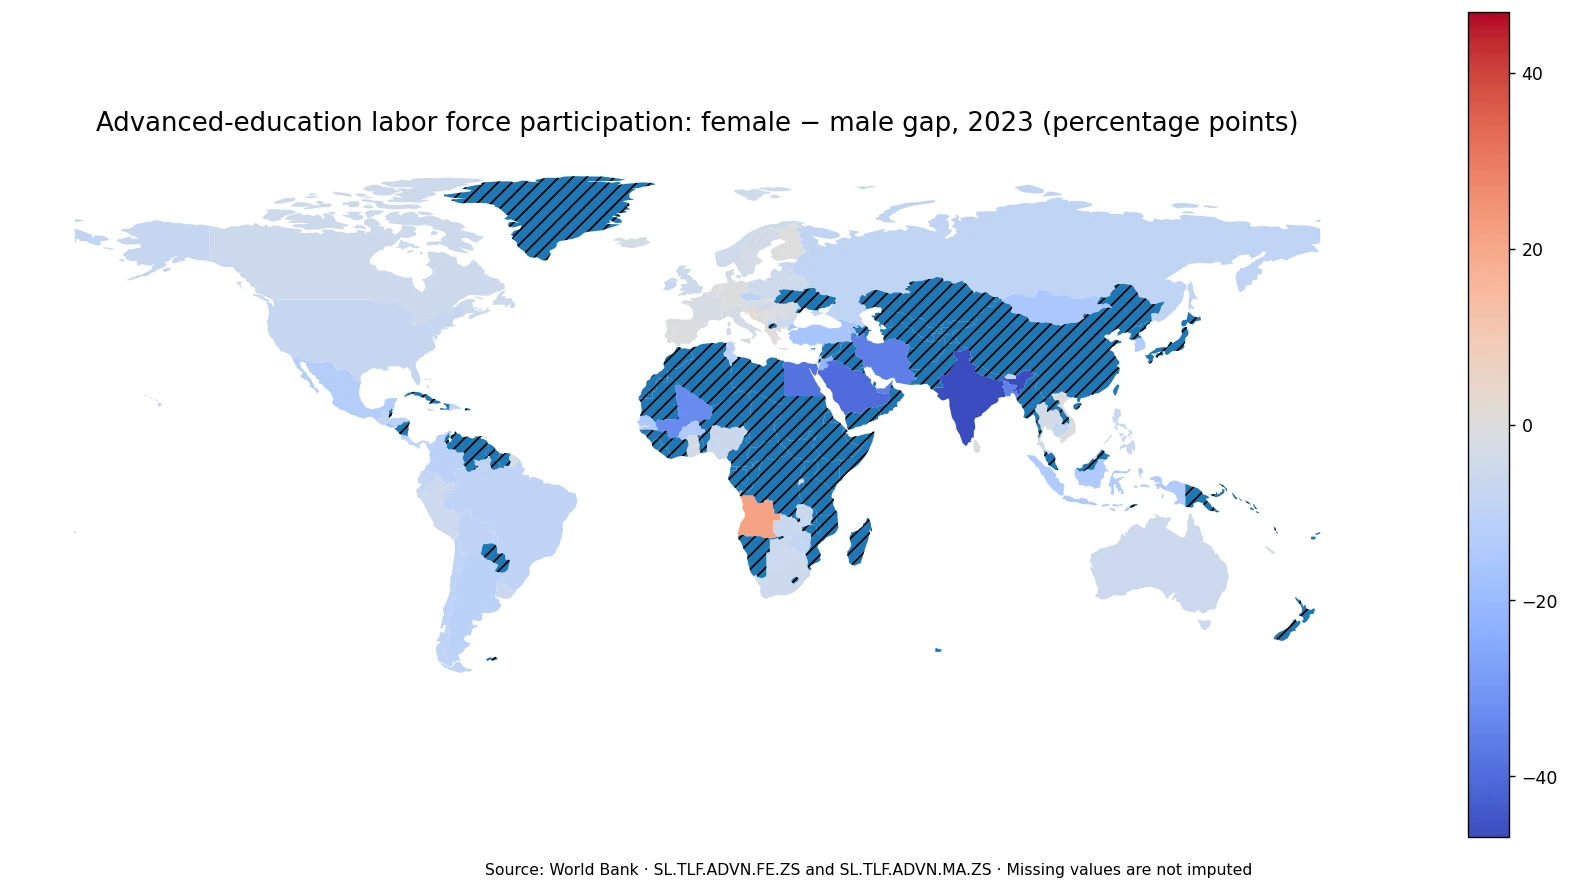
Table of Contents
What the two World Bank series measure
SL.TLF.ADVN.FE.ZS measures the labor force with advanced education as a percentage of the female working-age population with advanced education. SL.TLF.ADVN.MA.ZS applies the same construction to men. Advanced education covers short-cycle tertiary education, bachelor’s or equivalent, master’s or equivalent, and doctoral or equivalent levels under the ISCED 2011 framework. Because both series use the same year, unit, education category, and country coverage in this comparison, their difference can be expressed directly in percentage points.
Suppose an economy records 70% for women and 80% for men. The female-minus-male gap is -10 percentage points. That does not mean men outnumber women in the labor force by 10%, because the two percentages use different sex-specific denominators. Nor does it describe a wage gap or unemployment gap. It describes how strongly each sex-specific advanced-education population is connected to the labor force.
The overall pattern across 106 matched economies
The female series has a mean of 74.015% and a median of 76.191%. The male series has a mean of 81.539% and a median of 82.147%. The average difference between the two series is -7.524 percentage points when calculated as female minus male, and the median gap is -5.253 points. Both summary measures therefore point in the same direction: the male participation rate is typically higher in this 2023 cross-section.
The distribution is not uniformly wide. In 23 economies, the absolute gap is no more than 2 percentage points, and in 47 it is no more than 5 points. At the other end, 23 economies have a male advantage of at least 10 points and 8 have a male advantage of at least 20 points. Only 4 economies show a female advantage of 2 points or more. This mix of near parity and very large gaps is more informative than the global average alone.
Where the male participation rate is much higher
| Economy | Female | Male | Female − male |
|---|---|---|---|
| India | 38.544% | 85.445% | -46.901%p |
| Saudi Arabia | 53.363% | 93.627% | -40.264%p |
| Egypt, Arab Rep. | 44.516% | 82.888% | -38.372%p |
| Iran, Islamic Rep. | 35.964% | 71.852% | -35.888%p |
| Bangladesh | 53.577% | 89.458% | -35.881%p |
| United Arab Emirates | 59.179% | 94.785% | -35.606%p |
| Mali | 43.012% | 76.046% | -33.034%p |
| Jordan | 48.547% | 70.700% | -22.153%p |
| El Salvador | 69.891% | 89.066% | -19.175%p |
| Armenia | 65.124% | 83.227% | -18.103%p |
India has the largest negative gap: 38.544% for women compared with 85.445% for men, a difference of -46.901 percentage points. Saudi Arabia follows at -40.264 points, Egypt at -38.372, Iran at -35.888, Bangladesh at -35.881, and the United Arab Emirates at -35.606. These six observations are unusually large even within a distribution that generally favors higher male participation.
Mali records a gap of -33.034 points, followed by Jordan at -22.153, El Salvador at -19.175, and Armenia at -18.103. Several of the largest gaps occur in South Asia and West Asia, but the data should not be turned into a single regional explanation. Labor-force participation can be shaped by care responsibilities, social norms, age structure, continued education, public and private employment opportunities, migration, and survey or institutional differences. The cross-section identifies where gaps are large; it does not establish which factor caused them.
Economies where the female rate is higher
| Economy | Female | Male | Female − male |
|---|---|---|---|
| Angola | 89.707% | 68.311% | +21.396%p |
| Barbados | 80.855% | 76.223% | +4.632%p |
| Croatia | 75.390% | 71.284% | +4.106%p |
| Albania | 83.270% | 80.405% | +2.865%p |
| Mauritius | 79.650% | 78.091% | +1.559%p |
| Slovenia | 80.652% | 79.489% | +1.163%p |
| Trinidad and Tobago | 71.179% | 70.144% | +1.035%p |
| Greece | 74.968% | 74.134% | +0.834%p |
| Bahamas, The | 99.029% | 98.320% | +0.709%p |
| Jamaica | 76.834% | 76.529% | +0.305%p |
Women have the higher value in only 11 of the 106 matched economies. Angola is the strongest exception, with 89.707% for women and 68.311% for men, producing a +21.396-point gap. Barbados follows at +4.632 points, Croatia at +4.106, Albania at +2.865, Mauritius at +1.559, and Slovenia at +1.163. The remaining female advantages are close to one point or less.
Angola therefore deserves to be treated as an outlier rather than as a template for a broader regional pattern. A small positive gap in Jamaica or the Bahamas, for example, indicates near parity much more than a large female advantage. Counting the direction of the gap is useful, but magnitude matters: +0.3 and +21.4 percentage points represent very different labor-market relationships.
Where the two rates are closest
| Economy | Female | Male | Female − male |
|---|---|---|---|
| Finland | 75.338% | 75.392% | -0.054%p |
| Palau | 79.321% | 79.508% | -0.187%p |
| Serbia | 75.146% | 74.920% | +0.226%p |
| Jamaica | 76.834% | 76.529% | +0.305%p |
| Montenegro | 88.317% | 88.645% | -0.328%p |
| Slovak Republic | 79.921% | 80.298% | -0.377%p |
| Gambia, The | 56.203% | 56.585% | -0.382%p |
| Germany | 72.716% | 73.258% | -0.542%p |
| Spain | 78.660% | 79.286% | -0.626%p |
| Bahamas, The | 99.029% | 98.320% | +0.709%p |
Finland is the closest observation to exact parity, with a gap of only -0.054 percentage points. Palau is at -0.187, Serbia at +0.226, Jamaica at +0.305, Montenegro at -0.328, and the Slovak Republic at -0.377. The Gambia, Germany, Spain, and the Bahamas also have differences of roughly one percentage point or less. These cases show that a large sex gap is not inevitable within this education group.
Near parity still needs context. A zero gap could occur because both women and men have very high participation, or because both have relatively low participation. The gap map measures distance between the two rates, not the absolute quality or strength of labor-market attachment. Reading the female rate, male rate, and their difference together avoids this common interpretation error.
Geographic contrasts on the gap map
The most intense negative values appear in India, Saudi Arabia, Egypt, Iran, Bangladesh, and the United Arab Emirates. Angola stands out on the positive side. Much of Europe is closer to zero, but European economies are not identical: the United Kingdom has a -5.221-point gap, France -2.520, Germany -0.542, and Spain -0.626. The map therefore reveals both broad clusters and sharp country-level exceptions.
The Americas also vary substantially. The United States records -7.614 points, Canada -5.139, Mexico -12.700, and Brazil -9.662. In Africa, Angola is positive while Mali is strongly negative and South Africa is -5.133. Geographic proximity alone is therefore a poor predictor of the size or direction of the gap. National institutions and demographic composition matter, but the current dataset is descriptive and should not be used to assign causality.
Why absolute participation and the gap answer different questions
The female average of 74.015% and male average of 81.539% summarize labor-force attachment among people with advanced education, not successful employment. A person can be in the labor force while unemployed, so a high participation rate does not automatically mean a high employment rate or better job quality. Conversely, a lower participation rate may reflect many different pathways out of the labor force and cannot be interpreted as unemployment.
The sex gap adds another layer but still does not function as a comprehensive equality score. Two economies can have the same -5-point gap with very different absolute rates. One might have 85% versus 90%, while another has 55% versus 60%. The gap is identical, yet the overall connection to the labor market differs greatly. For policy or labor-market analysis, the absolute levels and the gap should be considered together.
Missing observations and map coverage
The underlying country frame contains 217 country and economy codes, but only 106 have both the female and male values for 2023. The other 111 matched slots remain missing. They are not assigned a participation rate of zero and they are not assigned a zero sex gap. Filling them with values from another year would increase visual coverage but would weaken the same-year comparison, so the analysis keeps the 2023 cross-section intact.
When the 106 valid ISO3 observations are joined to the low-resolution world boundary used for the visual, 95 can be represented by a distinct polygon. Some small islands and separately reported territories are not visible as their own areas at this scale. Their observations are still included in the distribution, tables, and numerical calculations. A blank or hatched area on the map therefore should not be read as a 0% participation rate or a 0-point gap.
What additional indicators can explain the gap
Employment rates by sex and education are the first useful companion measure because they show how participation translates into actual employment. Unemployment rates add the share of the active population that is seeking work without a job. Age-specific participation can reveal whether life-cycle differences are driving part of the overall gap. Sector and occupation data can show whether women and men with advanced education are concentrated in different parts of the economy.
Wage data, part-time work, informal employment, parental leave, and hours worked can add still more context. None of those dimensions is contained in the two participation series used here. The most defensible use of this 2023 comparison is therefore diagnostic: locate economies with very large gaps, identify places close to parity, and then connect those observations to additional labor-market evidence rather than treating the gap itself as a final explanation.
Why a one-year snapshot should be interpreted carefully
A single-year cross-section is useful for consistent comparison but cannot show whether a gap is persistent, widening, or narrowing. Economic shocks, changes in labor demand, migration, education completion, and policy changes can move participation from one year to the next. A multi-year analysis would be needed to distinguish structural patterns from temporary movements. The advantage of the 2023-only view is that every observation used in the direct comparison refers to the same point in time.
The World Bank frame can also include economies and separately reported territories, so the 106 matched observations should not automatically be described as 106 sovereign states. The comparison is strongest when treated as a set of reporting economies with compatible indicator definitions. That preserves the precision of the source and keeps the focus on the measurable difference between female and male labor-force participation among people with advanced education.
Frequently Asked Questions
How is the female–male gap calculated?
The male value is subtracted from the female value for the same economy and 2023. A negative result means the male labor-force participation rate is higher; a positive result means the female rate is higher.
Does higher labor-force participation mean higher employment?
Not necessarily. The labor force includes both employed people and unemployed people who are participating in the labor market. Employment and unemployment rates are needed for that distinction.
Were missing 2023 values treated as a zero gap?
No. The 111 country and economy codes without a matched female and male observation remain missing and are not assigned 0% or a zero-point gap.
Related Articles
Green Map creates custom-edited map images using open geographic data sources such as geoBoundaries, Natural Earth, OpenStreetMap, and government open data. These maps are edited visual materials, not raw data files, and are provided for education, documents, presentations, and graphic reference.