World Bank indicator EG.ELC.NUCL.ZS provides a latest non-empty nuclear share of electricity production for 209 countries and economies. Observation years range from 2014 to 2024: 19 observations are from 2024, 14 from 2023, 175 from 2021, and one from 2014. There are 177 official zero values and 32 positive values. The overall median is 0% and the unweighted mean is 3.55%.
The indicator measures a share rather than an amount of nuclear electricity. Its numerator is electricity generated by nuclear power plants and its denominator is total electricity production. It therefore describes the composition of the power mix, not absolute nuclear generation in kilowatt-hours or terawatt-hours.
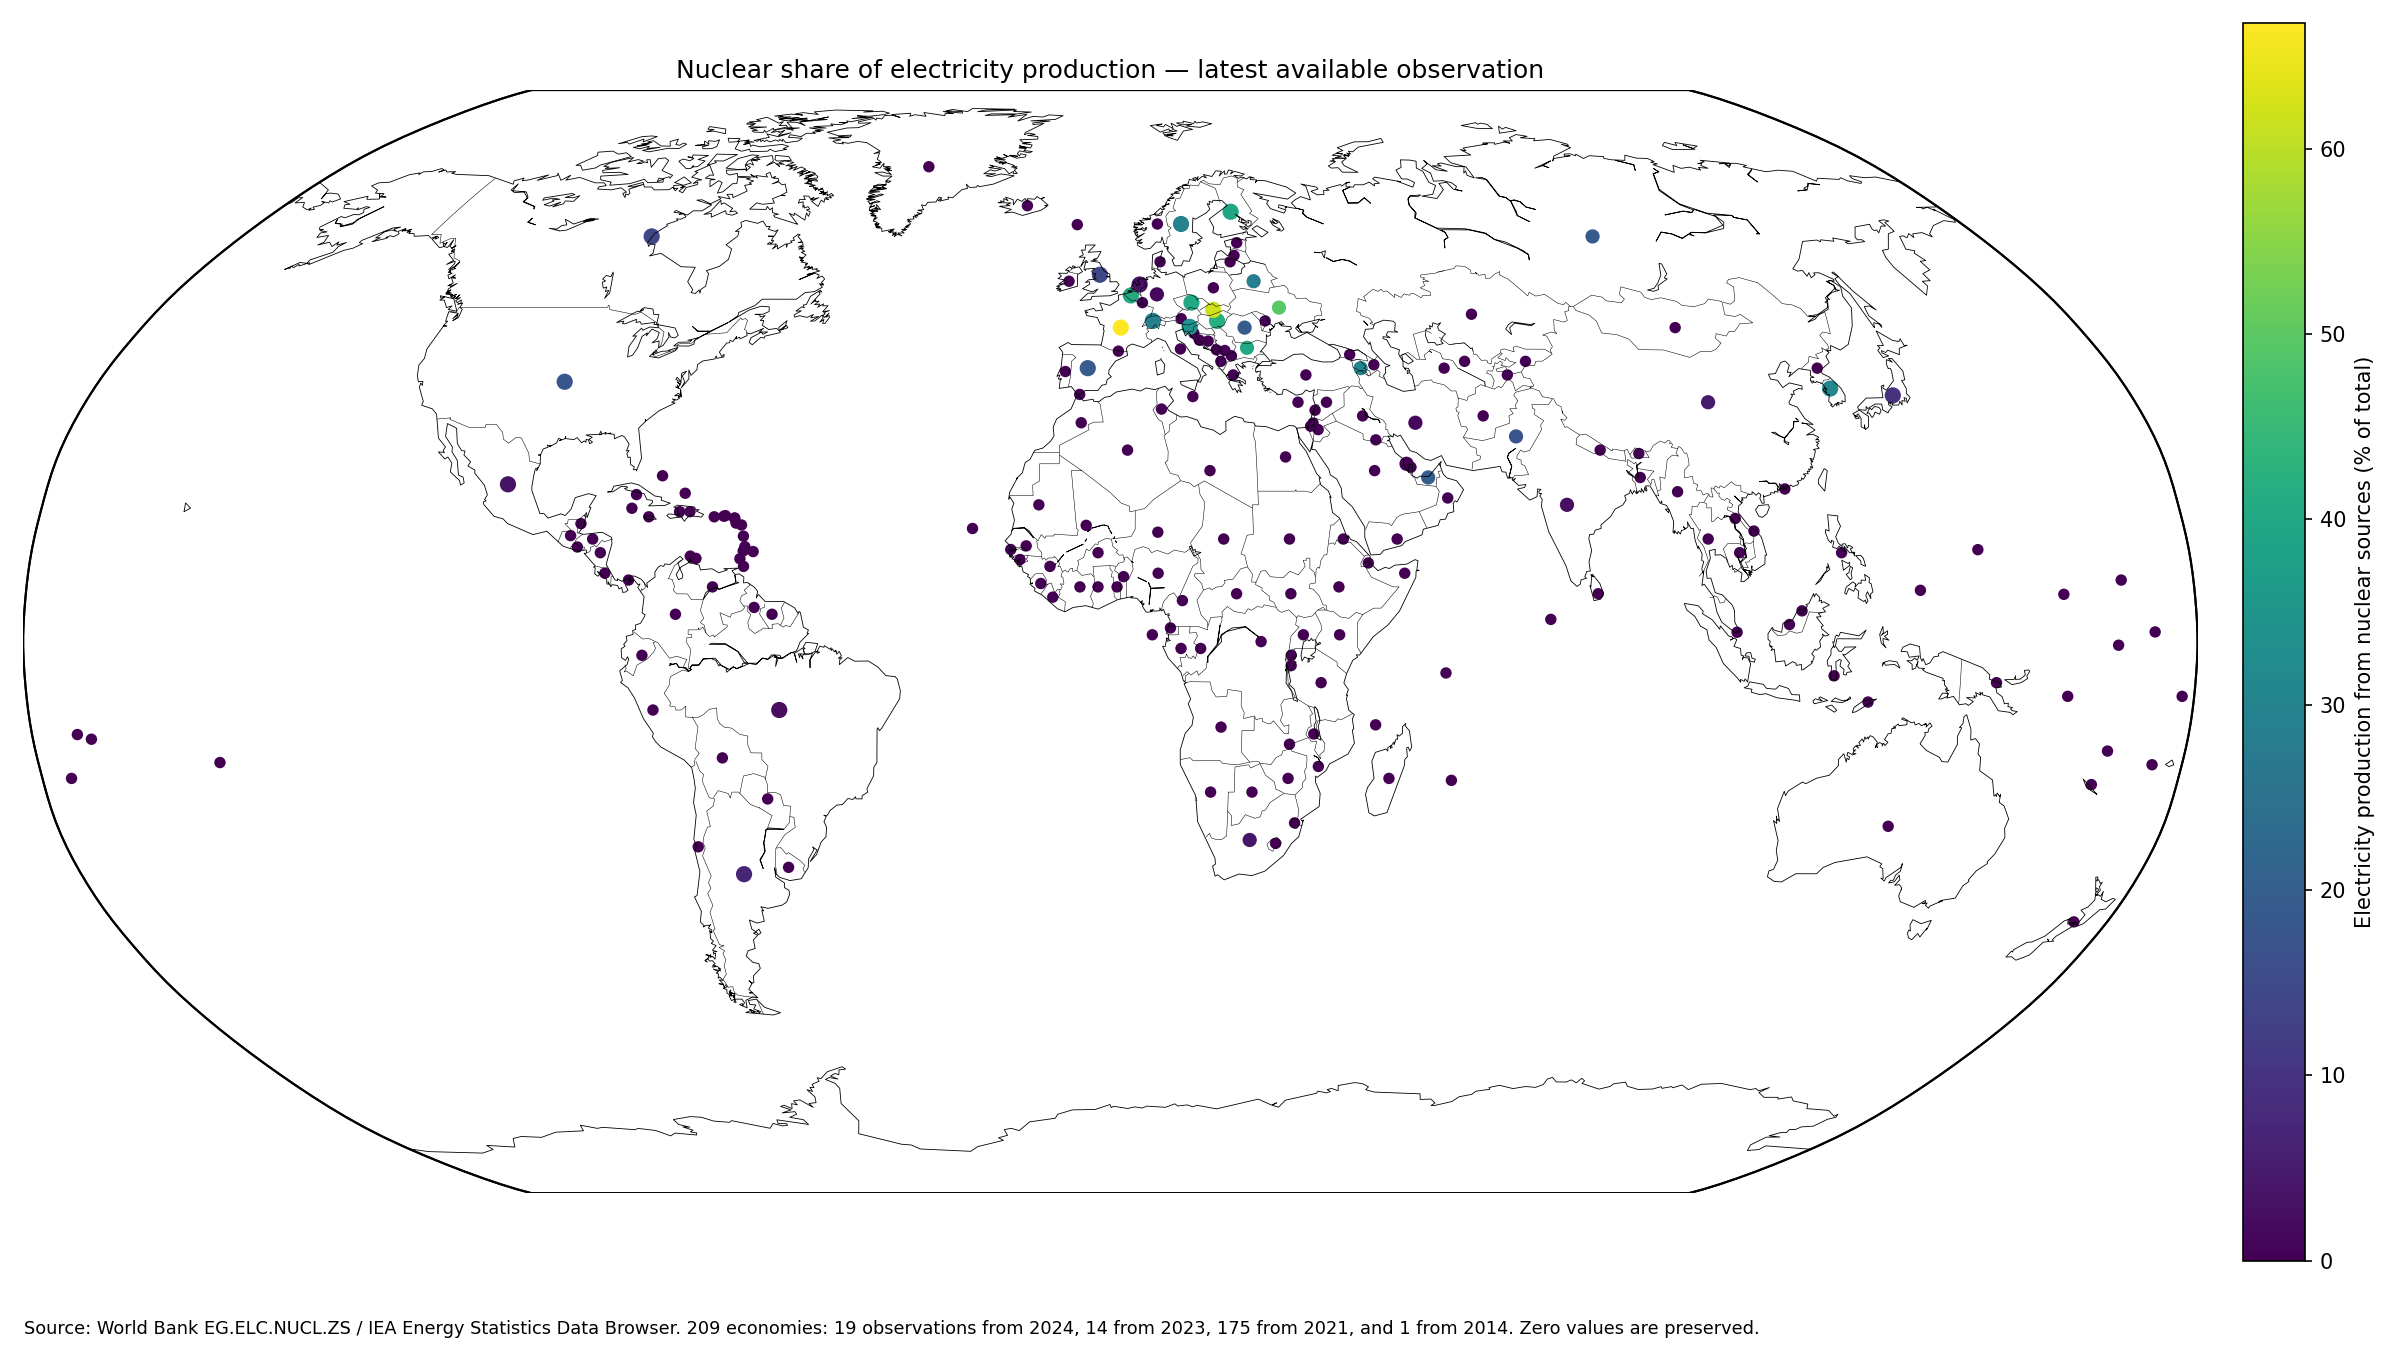
Table of Contents
What the nuclear electricity share measures
The World Bank defines the indicator as electricity production from nuclear sources as a percentage of total electricity production. Nuclear power means electricity generated by nuclear power plants, while electricity source refers to the input energy source used to generate electricity.
The World Bank metadata glossary identifies the IEA Energy Statistics Data Browser as the source. The World Bank API supplies the most recent non-empty observation for each economy in this dataset.
The 177 zero values are reported observations
177 of the 209 observations are exactly 0.00%. They were not created by replacing missing data with zero. They are source observations and therefore remain part of the overall distribution, mean, and median.
A zero means nuclear generation represented 0% of reported electricity production in that observation year. It does not establish whether an economy used nuclear generation in earlier decades, plans new reactors, or operates research facilities. Electricity share and nuclear infrastructure are different concepts.
Only 32 economies have a positive latest share
There are 32 positive observations. Among those economies, the unweighted mean is 23.18%, the median 19.12%, the first quartile 6.61%, and the third quartile 35.56%.
Within the positive group, 8 observations are below 5%, 10 are from 5% to under 20%, 7 from 20% to under 40%, 5 from 40% to under 60%, and 2 are at least 60%. Nuclear dependence therefore varies widely even among economies with positive generation.
France and the Slovak Republic lead the latest observations
France records 66.80%, the Slovak Republic 61.95%, Ukraine 49.42%, Hungary 42.16%, Belgium 40.51%, and Czechia 40.18%.
The years are not synchronized. Ukraine and Bulgaria are 2023 observations, while many of the leading European economies are from 2024. The full list should therefore be described as latest observations rather than a synchronized 2024 ranking.
| True rank | Country or economy | Observation year | Nuclear share |
|---|---|---|---|
| 1 | France | 2024 | 66.80% |
| 2 | Slovak Republic | 2024 | 61.95% |
| 3 | Ukraine | 2023 | 49.42% |
| 4 | Hungary | 2024 | 42.16% |
| 5 | Belgium | 2024 | 40.51% |
| 6 | Czechia | 2024 | 40.18% |
| 7 | Bulgaria | 2023 | 40.15% |
| 8 | Finland | 2024 | 39.20% |
| 9 | Slovenia | 2024 | 34.34% |
| 11 | Armenia | 2023 | 30.76% |
| 12 | Sweden | 2024 | 29.29% |
| 13 | Switzerland | 2024 | 29.06% |
| 14 | Belarus | 2023 | 28.30% |
| 15 | United Arab Emirates | 2023 | 19.74% |
| 16 | Romania | 2023 | 19.30% |
The 2024 same-year subset contains 19 economies
Among the 19 economies with 2024 observations, France records 66.80%, the Slovak Republic 61.95%, Hungary 42.16%, Belgium 40.51%, Czechia 40.18%, and Finland 39.20%.
| 2024 true rank | Country or economy | Nuclear share |
|---|---|---|
| 1 | France | 66.80% |
| 2 | Slovak Republic | 61.95% |
| 3 | Hungary | 42.16% |
| 4 | Belgium | 40.51% |
| 5 | Czechia | 40.18% |
| 6 | Finland | 39.20% |
| 7 | Slovenia | 34.34% |
| 9 | Sweden | 29.29% |
| 10 | Switzerland | 29.06% |
| 11 | Spain | 18.94% |
| 12 | United States | 17.74% |
| 13 | United Kingdom | 14.22% |
| 14 | Canada | 13.89% |
| 15 | Japan | 9.52% |
| 16 | Argentina | 7.29% |
The 2024 subset has an unweighted mean of 26.54% and a median of 29.06%. Its first quartile is 11.70% and third quartile 39.69%. 5 observations are below 10%, 4 are from 10% to under 20%, 5 from 20% to under 40%, 3 from 40% to under 60%, and 2 are at least 60%.
The 2023 subset has 13 positive values and one zero
Fourteen observations are from 2023. Thirteen are positive, while Bahrain is reported at 0%. Ukraine records 49.42%, Bulgaria 40.15%, Armenia 30.76%, Belarus 28.30%, the United Arab Emirates 19.74%, Romania 19.30%, the Russian Federation 18.68%, and Pakistan 17.33%.
Germany is reported at 1.41% in 2023. This dataset does not extrapolate or interpolate later values; every figure should be interpreted only for its stated observation year.
All 175 observations from 2021 are zero
The 175 observations dated 2021 are all 0%. This creates a large block of official zeros among economies without a positive nuclear share in the supplied latest-value dataset, while many economies with nuclear generation have newer 2023 or 2024 observations.
That data structure explains why the overall median is zero. Excluding zero values would answer a different question, so the analysis reports both the full 209-economy distribution and the positive-only distribution.
| Observation year | Economies | Positive values | Zero values |
|---|---|---|---|
| 2024 | 19 | 19 | 0 |
| 2023 | 14 | 13 | 1 |
| 2021 | 175 | 0 | 175 |
| 2014 | 1 | 0 | 1 |
Small positive shares still represent nuclear generation
The lowest positive observations include Germany at 1.41% in 2023, Iran at 1.56%, Brazil at 2.10% in 2024, India at 2.41% in 2023, the Netherlands at 2.89% in 2024, Mexico at 3.13%, South Africa at 3.73%, and China at 4.55%.
A low percentage does not mean nuclear generation is absent. It means nuclear power occupies a small share of total electricity production. A very large power system can still generate substantial nuclear electricity while showing a modest percentage.
| Country or economy | Observation year | Positive nuclear share |
|---|---|---|
| Germany | 2023 | 1.41% |
| Iran, Islamic Rep. | 2023 | 1.56% |
| Brazil | 2024 | 2.10% |
| India | 2023 | 2.41% |
| Netherlands | 2024 | 2.89% |
| Mexico | 2024 | 3.13% |
| South Africa | 2023 | 3.73% |
| China | 2023 | 4.55% |
| Argentina | 2024 | 7.29% |
| Japan | 2024 | 9.52% |
| Canada | 2024 | 13.89% |
| United Kingdom | 2024 | 14.22% |
A high share is not the same as a large nuclear-generation amount
A small electricity system with a 60% nuclear share can generate fewer nuclear terawatt-hours than a much larger system with a 20% share. Percentages describe composition; kWh and TWh describe volume.
For absolute nuclear generation, a measure such as electricity production from nuclear sources in kWh is more appropriate. The share indicator is designed to show the relative role of nuclear power in each electricity mix.
A high nuclear share is not a complete energy-system score
The percentage alone does not determine electricity prices, reliability, carbon emissions, safety performance, waste management, construction costs, or system flexibility. None of those outcomes is contained in this dataset.
A broader comparison should combine nuclear share with fossil-fuel shares, renewable and hydro shares, electricity access, generation volumes, consumption, and other measures relevant to the research question.
Nuclear and renewable shares describe different components
Nuclear power is one electricity source, while renewable indicators may include hydro, wind, solar, geothermal, biomass, and other sources depending on the exact series. An economy can have both a high nuclear share and a meaningful renewable share.
When comparing or combining shares, definitions and denominators must match. Renewable indicators that exclude hydropower, for example, answer a different question from broader renewable-generation measures.
Fossil-fuel shares help complete the power-mix picture
The rest of electricity production can come from gas, coal, oil, hydro, wind, solar, and other sources. The nuclear share by itself does not reveal how the remainder of the system is composed.
Related fossil-fuel, natural-gas, and hydro indicators can place nuclear power in context, but observation years should be checked before making direct cross-indicator comparisons.
Latest observation does not mean the same year everywhere
The dataset uses the most recent non-empty value for each economy, producing four observation years: 2014, 2021, 2023, and 2024. The 175 zero observations from 2021 dominate the coverage.
For synchronized comparison, the 2024 subset is cleaner but covers only 19 economies. The full map is best treated as a latest-available coverage view with the observation year made explicit.
Source and calculation notes
The source is World Bank World Development Indicators series EG.ELC.NUCL.ZS, based on the IEA Energy Statistics Data Browser. The analysis uses 209 latest non-empty observations and preserves all 177 reported zero values. It separately summarizes the 32 positive observations and the 19-economy 2024 subset. The official World Bank API provides the series.
All 209 country codes are joined to geographic centroids for the map, producing a 100% match. Point size distinguishes 2024, 2023, and older observations; no missing value is created or zero-filled.
Frequently Asked Questions
Are the 0% nuclear shares missing values?
No. The 177 zero values are reported source observations, not missing values filled with zero.
Does a high nuclear share mean the country produces the most nuclear electricity?
Not necessarily. The share is a percentage of total electricity production; absolute nuclear generation requires kWh or TWh data.
Are all 209 observations from the same year?
No. There are 19 observations from 2024, 14 from 2023, 175 from 2021, and one from 2014.
Related Articles
Green Map creates custom-edited map images using open geographic data sources such as geoBoundaries, Natural Earth, OpenStreetMap, and government open data. These maps are edited visual materials, not raw data files, and are provided for education, documents, presentations, and graphic reference.