World Bank indicator NY.ADJ.NNAT.GN.ZS reports net national savings as a percentage of gross national income for 177 countries and economies with a latest non-empty observation. Observation years range from 1994 to 2021: 134 values are from 2021, 21 from 2020, and the remainder are older.
Across the 177 latest observations, the unweighted mean is 10.07% and the median 9.14%. Twenty-six observations are negative. The highest latest value is Suriname at 38.49%, but that observation dates to 2010, so the full latest-value distribution and the synchronized 2021 subset need to be read separately.
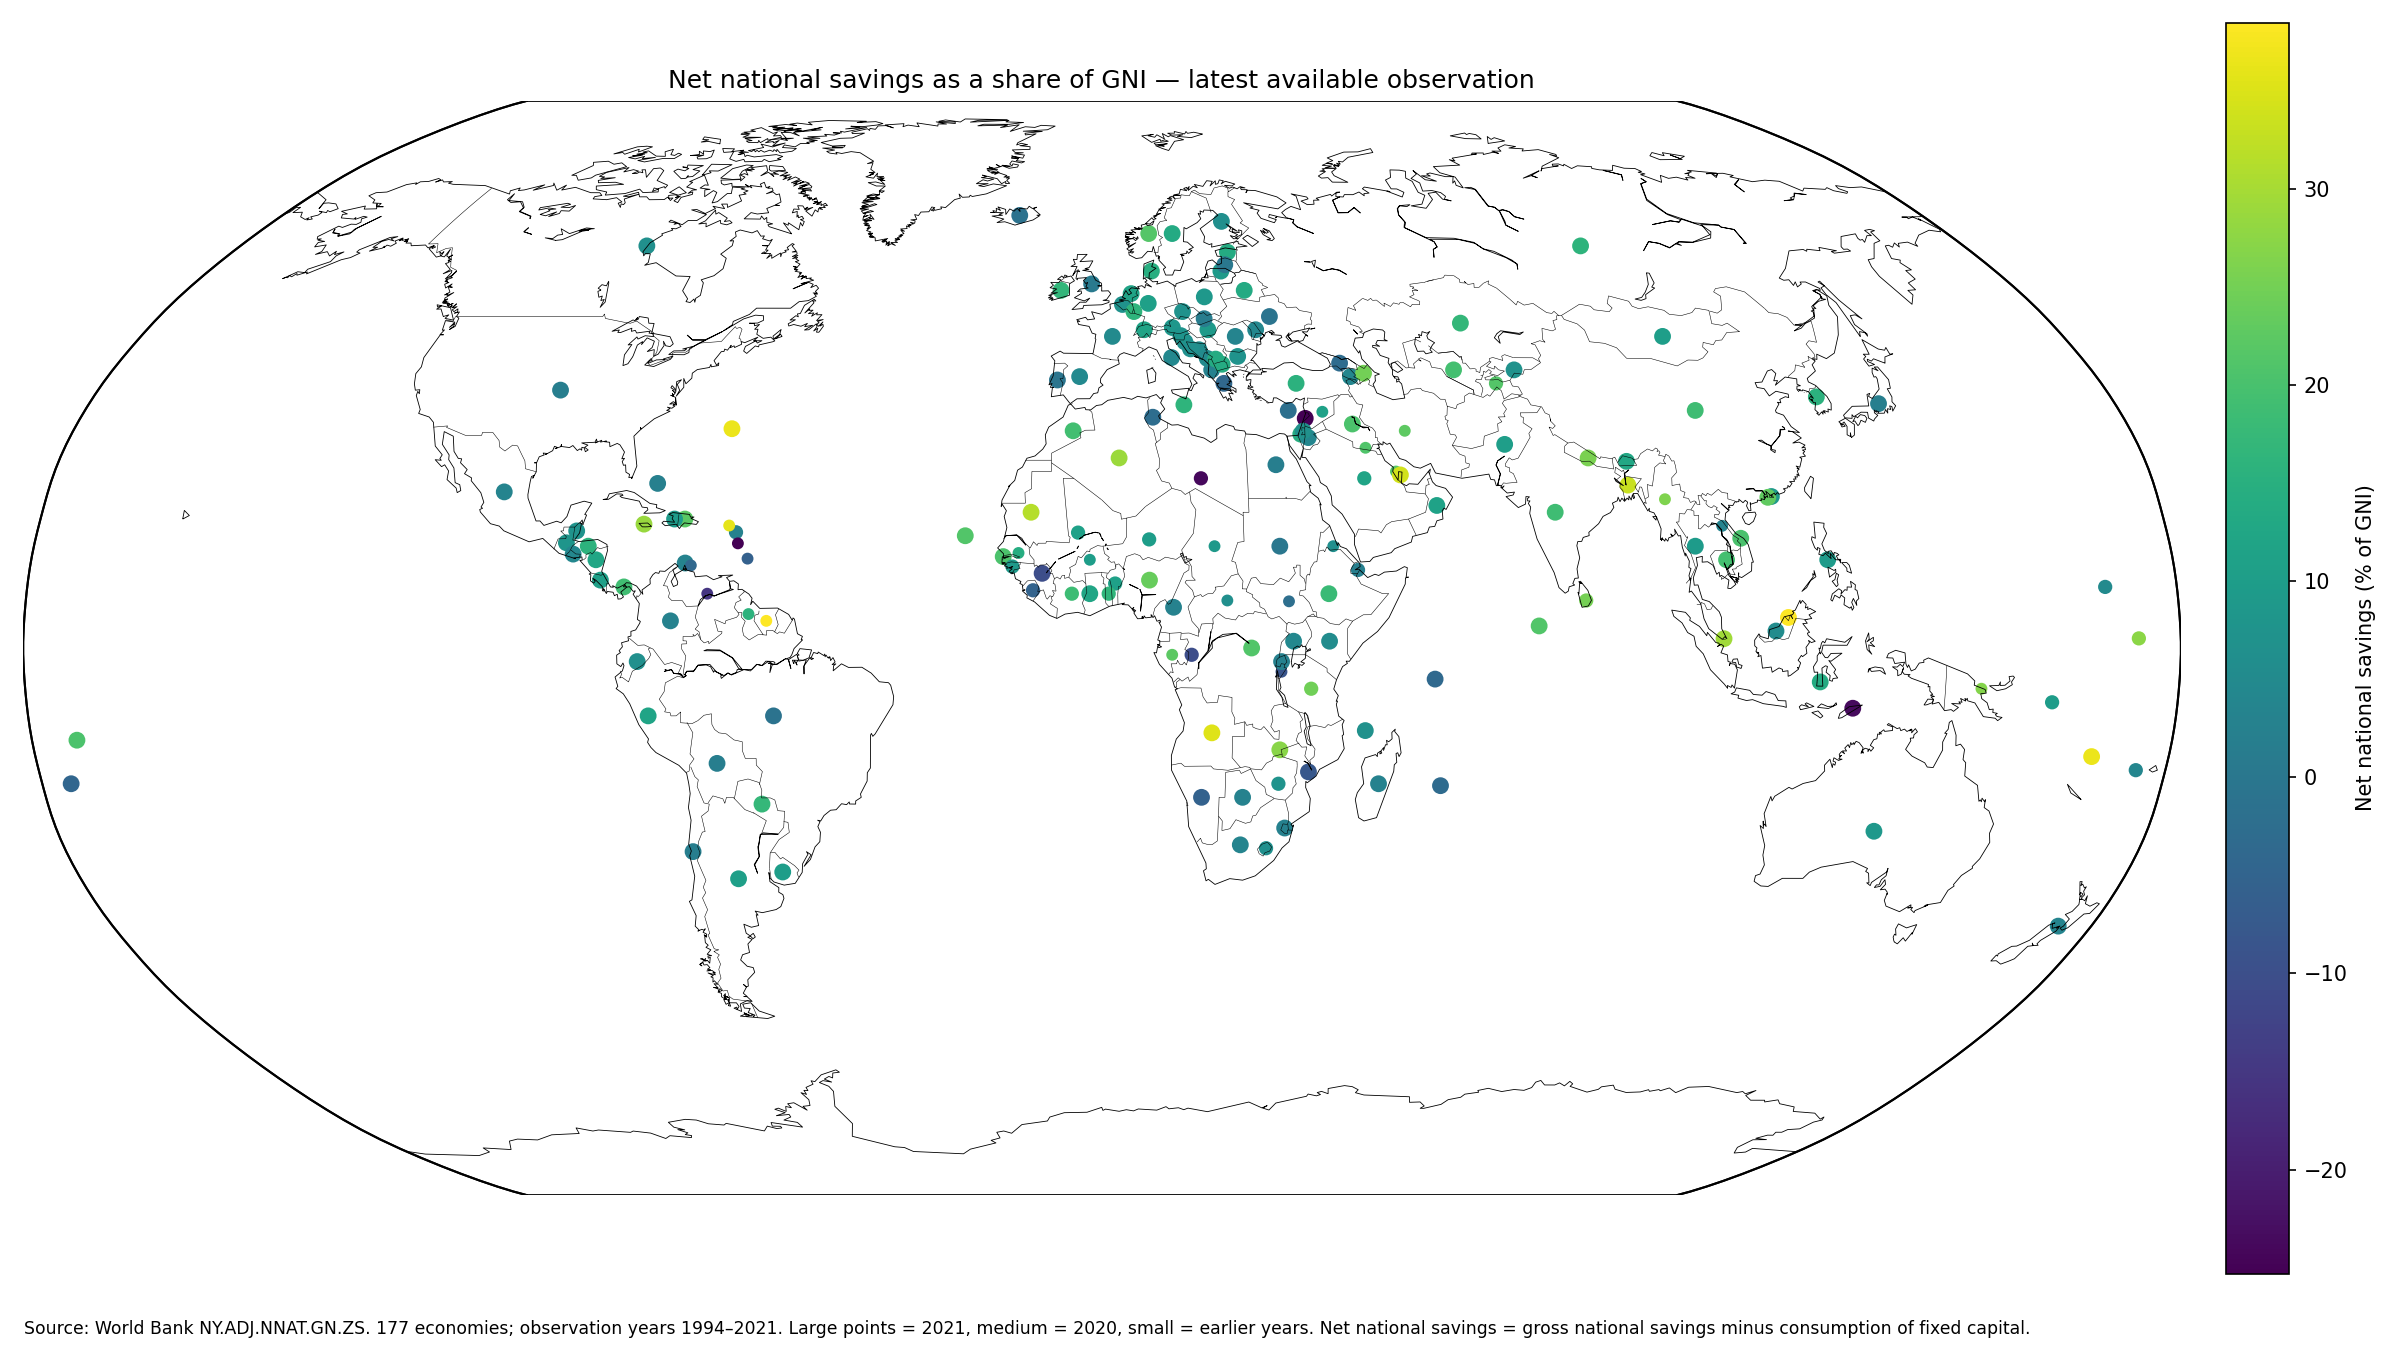
Table of Contents
Net national savings subtracts consumption of fixed capital from gross national savings
The World Bank metadata glossary defines net national savings as gross national savings minus consumption of fixed capital. Consumption of fixed capital represents the value of wear, obsolescence and other economic consumption of buildings, machinery, equipment and other fixed assets used in production.
A country can therefore have substantial gross savings but a much smaller net saving once depreciation is recognized. This is a national-accounts measure for the economy as a whole, not a household saving rate or a bank-deposit statistic.
The denominator is GNI rather than GDP
The ratio is expressed as a percentage of gross national income. GNI equals domestic product plus income residents receive from abroad minus income paid to non-residents.
Economies with large cross-border factor-income flows can therefore have a meaningful difference between GDP and GNI. Savings ratios using GDP as the denominator should not be treated as directly identical to this GNI-based measure.
This is not the final adjusted net savings indicator
Although the series sits within the World Bank’s adjusted-savings family, NY.ADJ.NNAT.GN.ZS itself is the net national savings component. The separate adjusted net savings indicator starts from net national savings, adds education expenditure, and subtracts energy depletion, mineral depletion, net forest depletion, carbon-dioxide damage and particulate-emission damage.
A high value here therefore does not prove that a country also has high environmentally adjusted saving. Net national savings accounts for fixed-capital consumption; adjusted net savings extends the framework to human capital, natural-resource depletion and environmental damage.
The latest-observation median is 9.14% of GNI
The median across 177 latest observations is 9.14%. The middle half lies between 3.21% and 17.08%. The simple mean is 10.07%, slightly above the median.
26 observations are negative, 33 are from 0% to under 5%, 37 from 5% to under 10%, 45 from 10% to under 20%, 27 from 20% to under 30%, and 9 are at least 30%.
| Latest net national savings / GNI | Economies | Share of 177 |
|---|---|---|
| Below 0% | 26 | 14.7% |
| 0% to under 5% | 33 | 18.6% |
| 5% to under 10% | 37 | 20.9% |
| 10% to under 20% | 45 | 25.4% |
| 20% to under 30% | 27 | 15.3% |
| 30% or more | 9 | 5.1% |
The highest latest observations come from different years
Suriname has the highest latest value at 38.49%, but its observation is from 2010. It is followed by Brunei Darussalam 38.38%, Vanuatu 36.69%, Bermuda 36.57%, Sint Maarten 35.78%, and Angola 35.45%.
The complete table is a latest-available coverage comparison rather than a synchronized ranking. Old observations should not be presented as if they describe 2021 conditions.
| True latest-observation rank | Country or economy | Observation year | Net national savings / GNI |
|---|---|---|---|
| 1 | Suriname | 2010 | 38.49% |
| 2 | Brunei Darussalam | 2021 | 38.38% |
| 3 | Vanuatu | 2021 | 36.69% |
| 4 | Bermuda | 2021 | 36.57% |
| 5 | Sint Maarten (Dutch part) | 2018 | 35.78% |
| 6 | Angola | 2021 | 35.45% |
| 7 | Qatar | 2021 | 34.15% |
| 8 | Bangladesh | 2021 | 33.02% |
| 9 | Mauritania | 2021 | 31.42% |
| 10 | Singapore | 2021 | 29.47% |
| 11 | Algeria | 2021 | 29.01% |
| 12 | Jamaica | 2021 | 28.67% |
| 13 | Kiribati | 2020 | 27.35% |
| 14 | Zambia | 2021 | 27.19% |
| 15 | Papua New Guinea | 2004 | 26.77% |
The synchronized 2021 subset contains 134 economies
The 2021 subset has an unweighted mean of 10.21%, a median of 8.96%, a first quartile of 3.28%, and a third quartile of 16.60%. Seventeen observations are negative.
Brunei Darussalam records 38.38%, Vanuatu 36.69%, Bermuda 36.57%, Angola 35.45%, Qatar 34.15%, and Bangladesh 33.02%.
| 2021 rank | Country or economy | Net national savings / GNI |
|---|---|---|
| 1 | Brunei Darussalam | 38.38% |
| 2 | Vanuatu | 36.69% |
| 3 | Bermuda | 36.57% |
| 4 | Angola | 35.45% |
| 5 | Qatar | 34.15% |
| 6 | Bangladesh | 33.02% |
| 7 | Mauritania | 31.42% |
| 8 | Singapore | 29.47% |
| 9 | Algeria | 29.01% |
| 10 | Jamaica | 28.67% |
| 11 | Zambia | 27.19% |
| 12 | Nepal | 25.74% |
| 13 | Azerbaijan | 24.86% |
| 14 | Nigeria | 23.68% |
| 15 | Macao SAR, China | 22.79% |
The 2021 distribution still ranges from deep negatives to the high 30s
In 2021, 17 economies are below zero, 29 from 0% to under 5%, 28 from 5% to under 10%, 36 from 10% to under 20%, 17 from 20% to under 30%, and 7 are at least 30%.
The wide same-year spread reflects differences in saving, consumption, income from abroad, fixed-capital consumption and cyclical conditions. It cannot be converted into a one-number judgment about household finances or fiscal policy.
Negative net national savings means depreciation exceeds the saving left after national consumption
Lebanon records -25.09% in 2021, Timor-Leste -23.61%, Guinea -10.30%, Mozambique -8.02%, and Namibia -5.45%.
A negative value means gross national savings are insufficient to cover consumption of fixed capital in the national accounts. It indicates that measured saving after depreciation is below zero for that year, but one negative year alone does not establish a permanent decline in national wealth.
| 2021 low-end rank | Country or economy | Net national savings / GNI |
|---|---|---|
| 1 | Lebanon | -25.09% |
| 2 | Timor-Leste | -23.61% |
| 3 | Guinea | -10.30% |
| 4 | Mozambique | -8.02% |
| 5 | Namibia | -5.45% |
| 6 | Tonga | -4.42% |
| 7 | Greece | -3.95% |
| 8 | Seychelles | -3.82% |
| 9 | Mauritius | -3.23% |
| 10 | Georgia | -2.92% |
| 11 | Tunisia | -2.72% |
| 12 | Cyprus | -2.11% |
| 13 | Iceland | -1.20% |
| 14 | Brazil | -1.02% |
| 15 | Ukraine | -0.72% |
South Asia contains several high positive saving ratios
Bangladesh records 33.02% in 2021, Nepal 25.74%, the Maldives 21.12%, India 18.57%, Bhutan 12.67%, and Pakistan 10.11%. Sri Lanka’s latest observation is 25.26% from 2020, so its date differs from the others.
These are national saving ratios, not household saving rates. Corporate and government saving, consumption, transfers and cross-border income all contribute to the national-accounts result.
| South Asia examples | Observation year | Net national savings / GNI |
|---|---|---|
| Bangladesh | 2021 | 33.02% |
| Nepal | 2021 | 25.74% |
| Sri Lanka | 2020 | 25.26% |
| Maldives | 2021 | 21.12% |
| India | 2021 | 18.57% |
| Bhutan | 2021 | 12.67% |
| Pakistan | 2021 | 10.11% |
Europe includes both positive and negative values
Ireland records 16.69% in 2021, Denmark 14.75%, Sweden 13.48%, the Netherlands 11.79%, and Germany 10.70%. At the other end, Portugal is -0.49%, Iceland -1.20%, and Greece -3.95%.
Neighboring advanced economies can therefore have different net-saving structures. Consumption patterns, depreciation, cross-border income and national saving behavior can vary even inside a highly integrated region.
| Europe examples | Observation year | Net national savings / GNI |
|---|---|---|
| Ireland | 2021 | 16.69% |
| Denmark | 2021 | 14.75% |
| Sweden | 2021 | 13.48% |
| Netherlands | 2021 | 11.79% |
| Germany | 2021 | 10.70% |
| Austria | 2021 | 8.56% |
| Belgium | 2021 | 6.89% |
| Finland | 2021 | 6.16% |
| France | 2021 | 4.90% |
| Spain | 2021 | 4.72% |
| Italy | 2021 | 4.59% |
| Portugal | 2021 | -0.49% |
| Iceland | 2021 | -1.20% |
| Greece | 2021 | -3.95% |
Africa shows both 30%+ positives and double-digit negatives
Angola records 35.45%, Mauritania 31.42%, Algeria 29.01%, Zambia 27.19%, and Nigeria 23.68% in 2021. Guinea is at -10.30%, Mozambique -8.02%, Namibia -5.45%, and Tunisia -2.72%.
High net national saving in a resource-exporting economy does not automatically mean sustainable wealth accumulation after resource depletion. That distinction is precisely why the World Bank also publishes adjusted net savings after natural-resource and environmental adjustments.
| Africa examples | Observation year | Net national savings / GNI |
|---|---|---|
| Angola | 2021 | 35.45% |
| Mauritania | 2021 | 31.42% |
| Algeria | 2021 | 29.01% |
| Zambia | 2021 | 27.19% |
| Nigeria | 2021 | 23.68% |
| Tunisia | 2021 | -2.72% |
| Namibia | 2021 | -5.45% |
| Mozambique | 2021 | -8.02% |
| Guinea | 2021 | -10.30% |
The Caribbean illustrates why observation year must remain visible
Jamaica records 28.67% in 2021, Haiti 9.40%, and the Bahamas 2.17%. Barbados’s latest value is -5.82% from 2017, while Dominica’s is -25.30% from 2018.
Putting those values on one latest-available map is useful for coverage, but the older negatives should not be described as current 2021 conditions. Point size on the visual exposes the age difference.
| Caribbean examples | Observation year | Net national savings / GNI |
|---|---|---|
| Jamaica | 2021 | 28.67% |
| Haiti | 2021 | 9.40% |
| Bahamas, The | 2021 | 2.17% |
| Barbados | 2017 | -5.82% |
| Dominica | 2018 | -25.30% |
Gross savings and net national savings differ by fixed-capital consumption
Adjusted savings, gross savings represents saving before the deduction for fixed-capital consumption. Net national savings is lower by that depreciation amount when definitions and periods align.
The distinction matters because replacing worn-out machinery, buildings and infrastructure uses resources. A high gross saving rate can translate into a much smaller net saving rate when the existing capital stock has a large depreciation charge.
Net national savings is not the government fiscal balance
The fiscal balance compares government revenue and expenditure. Net national savings is an economy-wide national-accounts measure that includes private as well as public saving.
A government deficit can coexist with positive net national savings when private saving is large. Conversely, a near-balanced public budget does not guarantee high national saving if private saving is weak or capital consumption is large.
One strong year does not establish long-run sustainability
Saving ratios can move sharply with the business cycle, commodity prices, income, consumption, investment and income flows from abroad. Resource exporters can experience especially large swings when commodity revenues change.
Long-run sustainability is better studied with a multi-year trend and complementary indicators such as adjusted net savings, resource depletion, education expenditure, debt and investment composition.
Mixed observation years are the main limitation of the latest-value map
Of the 177 latest observations, 134 are from 2021 and 21 from 2020. The remaining 22 are from 2019 or earlier, and the oldest latest observation dates to 1994.
The most-recent-non-empty approach improves geographic coverage but does not synchronize time. The article therefore separates the 177-economy latest distribution from the 134-economy 2021 subset.
| Latest observation year | Economies |
|---|---|
| 2021 | 134 |
| 2020 | 21 |
| 2019 | 3 |
| 2018 | 5 |
| 2017 | 2 |
| 2016 | 1 |
| 2015 | 2 |
| 2014 | 1 |
| 2010 | 2 |
| 2005 | 1 |
| 2004 | 1 |
| 2000 | 2 |
| 1994 | 2 |
The simple country mean is not a GNI-weighted world saving rate
The 10.07% latest-value mean and 10.21% 2021 mean give every reporting economy equal weight. A large economy and a small territory each contribute one percentage.
A world net-national-saving share would require weighting economies by GNI. The World Bank metadata lists weighted average as the aggregation method, whereas the means used here are descriptive cross-country statistics.
Source and calculation notes
The source is World Bank World Development Indicators series NY.ADJ.NNAT.GN.ZS. The analysis uses 177 latest non-empty observations to calculate the mean, median, quartiles, bands and rankings, and separately summarizes the 134 observations from 2021.
All 177 country codes are matched to geographic centroids for the map, producing a 100% match. Negative values are preserved rather than zero-filled, and point size distinguishes 2021, 2020 and older observations.
Frequently Asked Questions
How is net national savings calculated?
It equals gross national savings minus consumption of fixed capital, which is the economic depreciation of produced fixed assets.
Is net national savings the same as adjusted net savings?
No. Adjusted net savings starts from net national savings, adds education expenditure, and subtracts resource depletion and environmental damages.
What does negative net national savings mean?
It means gross national savings are insufficient to cover consumption of fixed capital in that year, leaving saving after depreciation below zero.
Related Articles
Green Map creates custom-edited map images using open geographic data sources such as geoBoundaries, Natural Earth, OpenStreetMap, and government open data. These maps are edited visual materials, not raw data files, and are provided for education, documents, presentations, and graphic reference.