World Bank indicator EN.GHG.ALL.PC.CE.AR5 reports 2024 greenhouse-gas emissions per capita excluding land use, land-use change and forestry for 203 countries and economies. The unweighted mean is 6.52 t CO₂e per person, the median 4.11, the first quartile 1.86, and the third quartile 7.35.
The indicator is broader than carbon dioxide alone. It combines CO₂, methane, nitrous oxide, hydrofluorocarbons, perfluorocarbons and sulfur hexafluoride from energy, industry, waste and agriculture, converts them to carbon-dioxide equivalent using IPCC AR5 global-warming potentials, and divides the result by population.
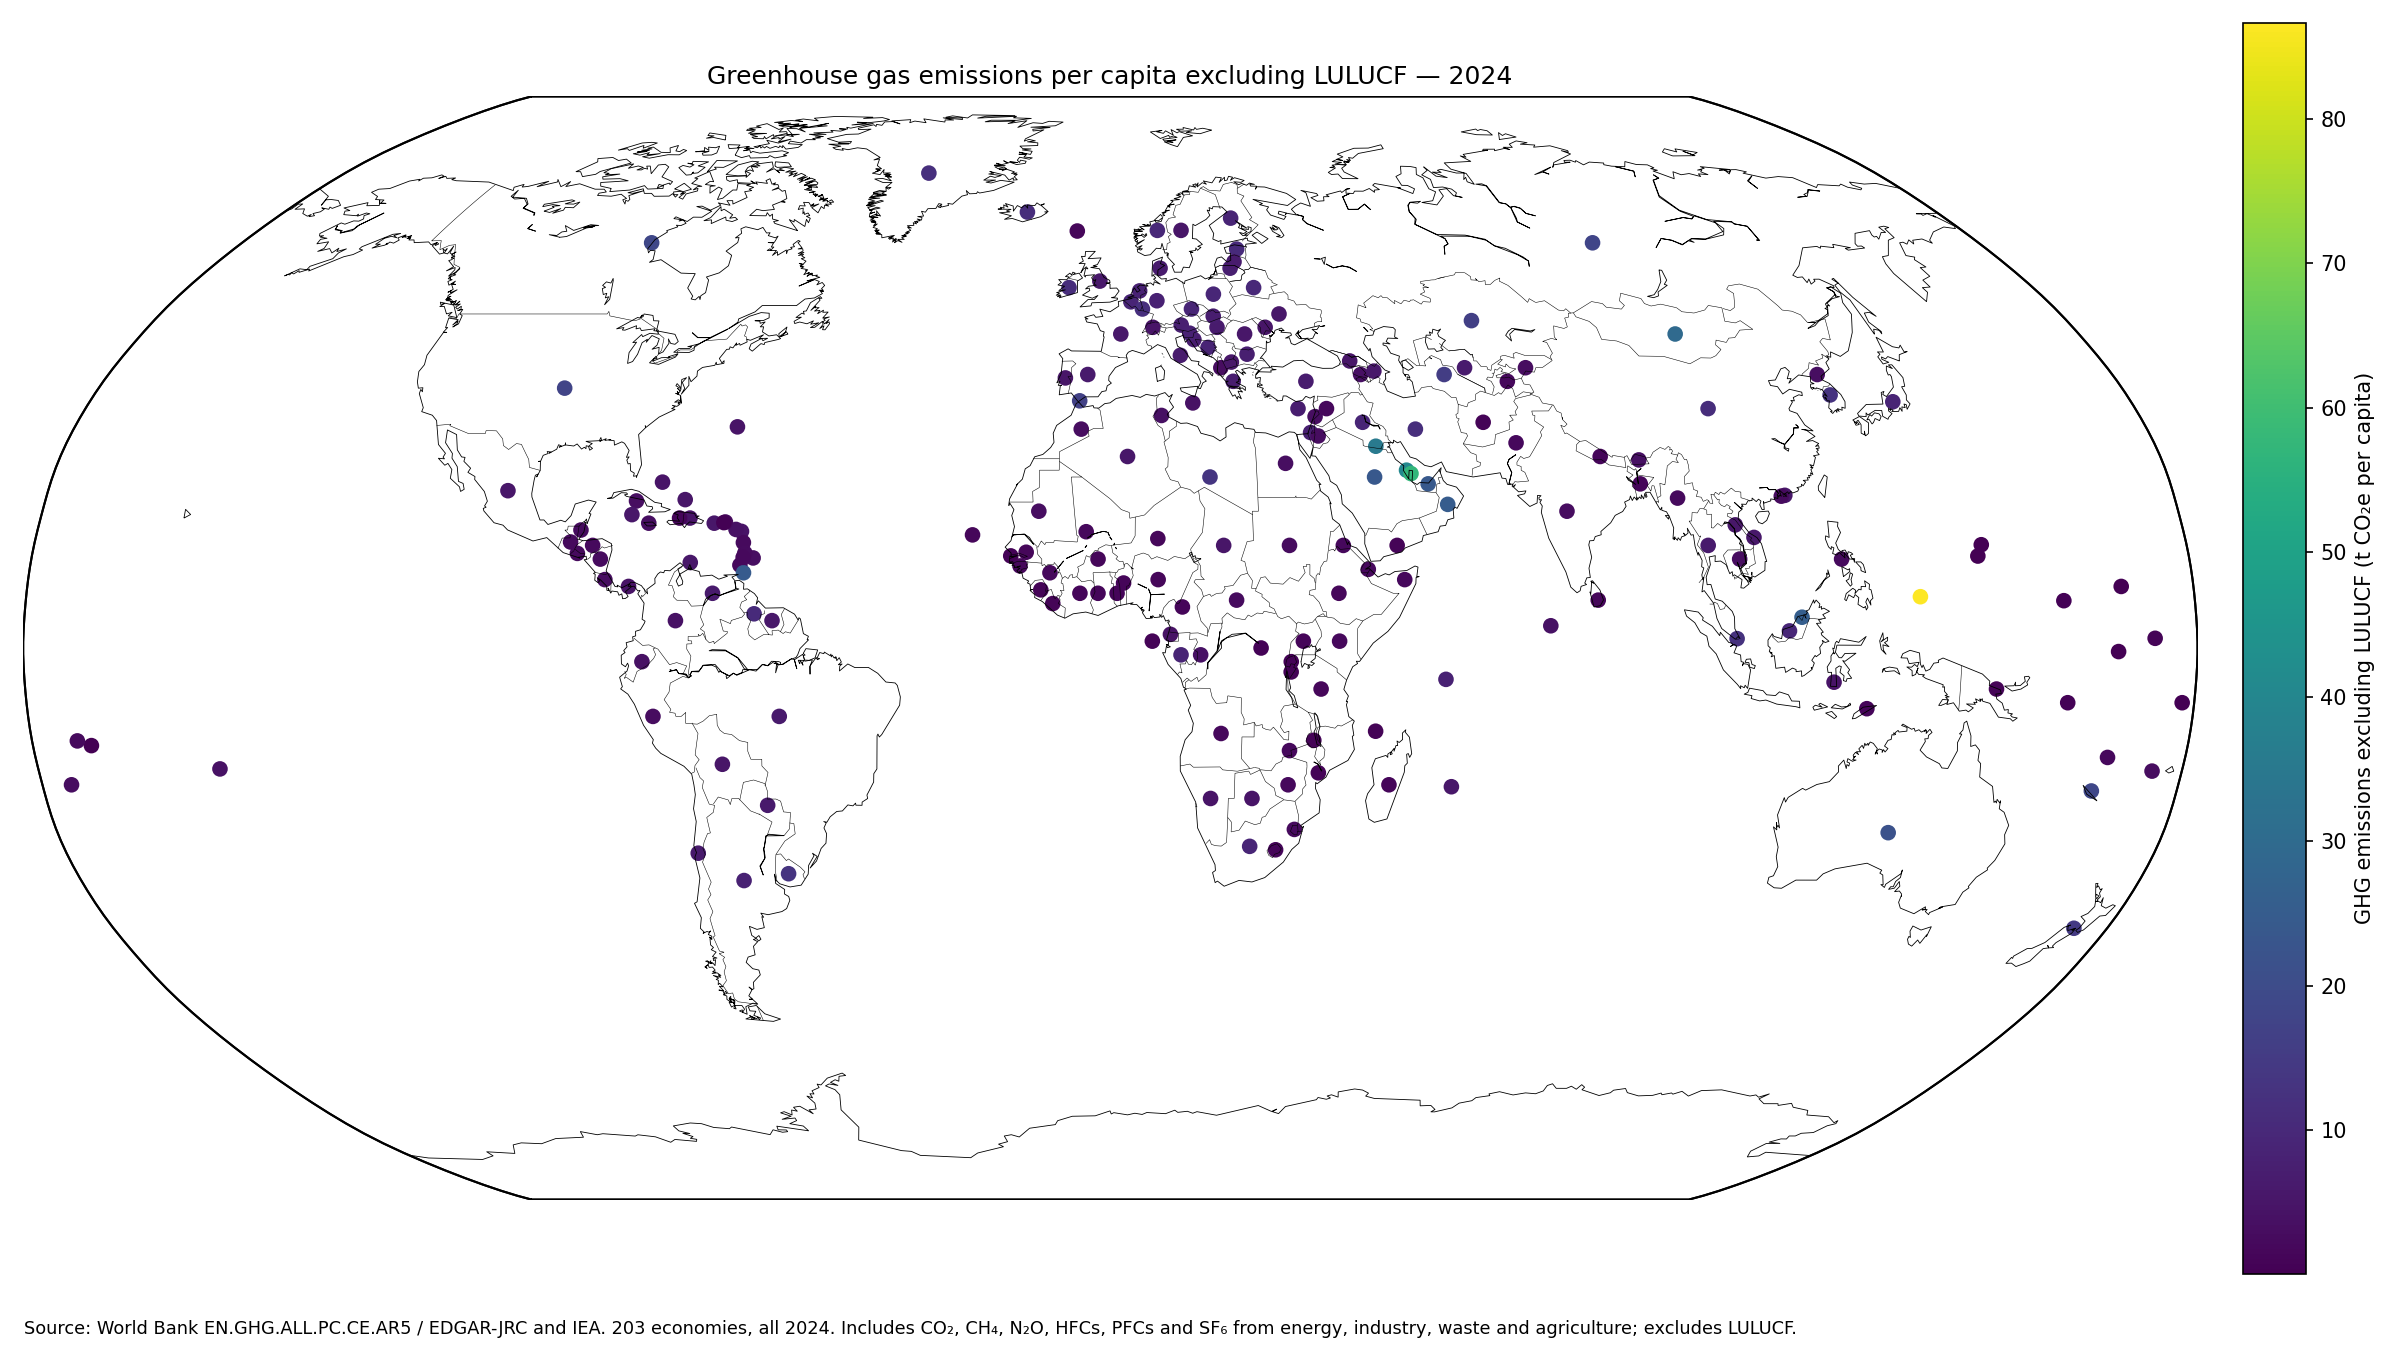
Table of Contents
Six greenhouse gases are combined in CO₂-equivalent units
The World Bank indicator definition explicitly includes CO₂, CH₄, N₂O, HFCs, PFCs and SF₆. Because these gases have different warming effects, the series standardizes them to carbon-dioxide equivalent using IPCC Fifth Assessment Report factors.
A value of 10 t CO₂e per capita therefore does not mean ten tonnes of carbon dioxide alone. Methane, nitrous oxide and fluorinated gases can contribute to the converted total. Gas-specific indicators are needed to identify which gases drive a country’s result.
LULUCF is deliberately excluded
LULUCF stands for Land Use, Land-Use Change and Forestry. Forest carbon uptake, deforestation, land conversion and other land-sector fluxes can be large and uncertain, so this particular indicator removes those fluxes from the total.
Countries with large forest sinks do not receive a subtraction for those sinks here, while countries with large land-use emissions do not have those emissions added. That is why an including-LULUCF series can differ substantially.
Energy, industry, waste and agriculture form the core scope
The total includes emissions associated with fuel use and energy systems, industrial activity and processes, waste management, and agriculture. The dominant source differs by economy according to electricity generation, fossil-fuel production, industrial structure, livestock, crops and waste systems.
A high total does not mean every sector is high. Fossil-fuel producers can have large energy and fugitive emissions, while agricultural economies may receive a larger contribution from methane and nitrous oxide.
The median across 203 economies is 4.11 t CO₂e per capita
The median is 4.11 t CO₂e per person. The middle half of observations lies between 1.86 and 7.35. The mean of 6.52 is above the median because a relatively small number of high-emission economies extends the upper tail.
20 observations are below 1 tonne, 36 from 1 to under 2, 60 from 2 to under 5, 56 from 5 to under 10, 20 from 10 to under 20, and 11 are at least 20 t CO₂e per capita.
| 2024 GHG per-capita band | Economies | Share of 203 |
|---|---|---|
| Below 1 t | 20 | 9.9% |
| 1 to under 2 t | 36 | 17.7% |
| 2 to under 5 t | 60 | 29.6% |
| 5 to under 10 t | 56 | 27.6% |
| 10 to under 20 t | 20 | 9.9% |
| 20 t or more | 11 | 5.4% |
Palau and several Gulf economies have very high per-capita values
Palau has the highest 2024 observation at 86.68 t CO₂e per person, followed by Qatar at 56.95, Bahrain 40.55, Kuwait 35.39, Mongolia 29.61, Brunei Darussalam 25.64, and Oman 25.04.
The high end mixes very small populations with economies that have energy-intensive industry, fossil-fuel production, refining or high energy use. Dividing territorial emissions by a small population can produce a very large per-person number even when absolute emissions are not among the world’s largest.
| Rank | Country or economy | 2024 t CO₂e per capita |
|---|---|---|
| 1 | Palau | 86.68 |
| 2 | Qatar | 56.95 |
| 3 | Bahrain | 40.55 |
| 4 | Kuwait | 35.39 |
| 5 | Mongolia | 29.61 |
| 6 | Brunei Darussalam | 25.64 |
| 7 | Oman | 25.04 |
| 8 | Trinidad and Tobago | 24.55 |
| 9 | United Arab Emirates | 24.04 |
| 10 | Saudi Arabia | 23.76 |
| 11 | Australia | 21.75 |
| 12 | Canada | 18.61 |
| 13 | New Caledonia | 18.39 |
| 14 | Russian Federation | 17.93 |
| 15 | United States | 17.39 |
The lowest observations are below 1 t CO₂e per person
Northern Mariana Islands, Marshall Islands, Guam, Naoero, American Samoa and the U.S. Virgin Islands sit at the very low end, followed by the Democratic Republic of Congo, Federated States of Micronesia, Rwanda and Burundi.
A low per-capita value does not mean emissions are absent. It also does not include a credit for forest uptake because LULUCF is outside the boundary of this series.
| Low-end rank | Country or economy | 2024 t CO₂e per capita |
|---|---|---|
| 1 | Northern Mariana Islands | 0.09 |
| 2 | Marshall Islands | 0.11 |
| 3 | Guam | 0.11 |
| 4 | Naoero | 0.12 |
| 5 | American Samoa | 0.19 |
| 6 | Virgin Islands (U.S.) | 0.23 |
| 7 | Tuvalu | 0.43 |
| 8 | Congo, Dem. Rep. | 0.54 |
| 9 | Micronesia, Fed. Sts. | 0.54 |
| 10 | Rwanda | 0.59 |
| 11 | Burundi | 0.60 |
| 12 | Gambia, The | 0.67 |
| 13 | Solomon Islands | 0.76 |
| 14 | Afghanistan | 0.77 |
| 15 | Liberia | 0.79 |
Per-capita rankings can differ sharply from total-emissions rankings
A populous country can have very large total emissions while remaining closer to the middle on a per-person basis. A small economy with energy-intensive production can have a high per-capita figure even if its absolute national total is modest.
Total emissions answer how much an economy adds to the atmospheric flow in absolute terms. Per-capita emissions normalize by population and answer a different question about average territorial emissions intensity per resident.
This is not a personal household carbon-footprint measure
The numerator contains emissions from power plants, industrial facilities, oil and gas production, agriculture, and waste systems. Dividing that national total by population does not mean every resident directly emitted the reported amount.
Emissions from producing exported goods or fuels can remain assigned to the producing economy. Consumption-based carbon footprints reallocate some of those emissions through trade and are conceptually different.
The total-GHG measure is broader than CO₂ per capita
A carbon-dioxide-only indicator excludes methane, nitrous oxide and fluorinated gases. Those gases can be important in livestock, agriculture, waste, fuel production and industrial applications.
Comparing total GHG per capita with CO₂ per capita can therefore reveal whether non-CO₂ gases make a large contribution to an economy’s climate footprint.
All 203 observations use the same 2024 reference year
Unlike latest-value datasets that mix observation years, every numeric value in this file is from 2024. Cross-country differences are therefore not complicated by an obvious reference-year mismatch.
The common year does not eliminate inventory uncertainty. EDGAR combines international activity data, fuel use, emission factors and sector classifications to estimate emissions consistently across economies.
The AR5 conversion basis matters
Methane, nitrous oxide and fluorinated gases are translated into CO₂-equivalent values using global-warming-potential factors. This series uses the IPCC Fifth Assessment Report, or AR5, basis.
Another source using AR4 or AR6 factors can produce a different CO₂e total even with the same underlying gas emissions. GWP basis should therefore be checked before comparing databases.
A high value is not a one-number policy verdict
Per-capita emissions reflect energy supply, industrial structure, climate, transport, fossil-fuel production, agriculture, income, population and many other factors. The ratio does not identify one policy as the cause of a country’s level.
Trend analysis is more informative when paired with gas-specific and sector-specific series. Power decarbonization, methane control, industrial changes and agricultural shifts affect the total in different ways.
Source and calculation notes
The source is World Bank World Development Indicators series EN.GHG.ALL.PC.CE.AR5, based on the EDGAR Community GHG Database from the JRC European Commission and IEA data. Mean, median, quartiles, distribution bands and rankings are calculated directly from 203 numeric observations for 2024.
All 203 country codes are matched to geographic centroids for the map, producing a 100% match. The dataset contains numeric values for all 203 rows used here, so no missing observation is converted to zero.
Frequently Asked Questions
Does this indicator include only carbon dioxide?
No. It combines CO₂, CH₄, N₂O, HFCs, PFCs and SF₆ in AR5 carbon-dioxide-equivalent units.
What does excluding LULUCF mean?
It means greenhouse-gas fluxes from land use, land-use change and forestry are left out of the total.
Is per-capita GHG a personal household footprint?
No. It is national territorial emissions from energy, industry, waste and agriculture divided by population.
Related Articles
Green Map creates custom-edited map images using open geographic data sources such as geoBoundaries, Natural Earth, OpenStreetMap, and government open data. These maps are edited visual materials, not raw data files, and are provided for education, documents, presentations, and graphic reference.