World Bank indicator SE.PRM.PRIV.ZS provides the latest non-empty private share of primary-school enrollment for 207 countries and economies. The observation years are highly uneven, ranging from 1976 to 2025. Across the latest observations, the unweighted mean is 17.83%, the median 12.30%, the first quartile 4.64%, and the third quartile 24.39%.
The statistic is based on students rather than school counts. Its numerator is pupils enrolled in private primary institutions, and its denominator is total primary enrollment in public and private institutions. A 20% value therefore means about 20 of every 100 enrolled primary pupils are in private institutions.
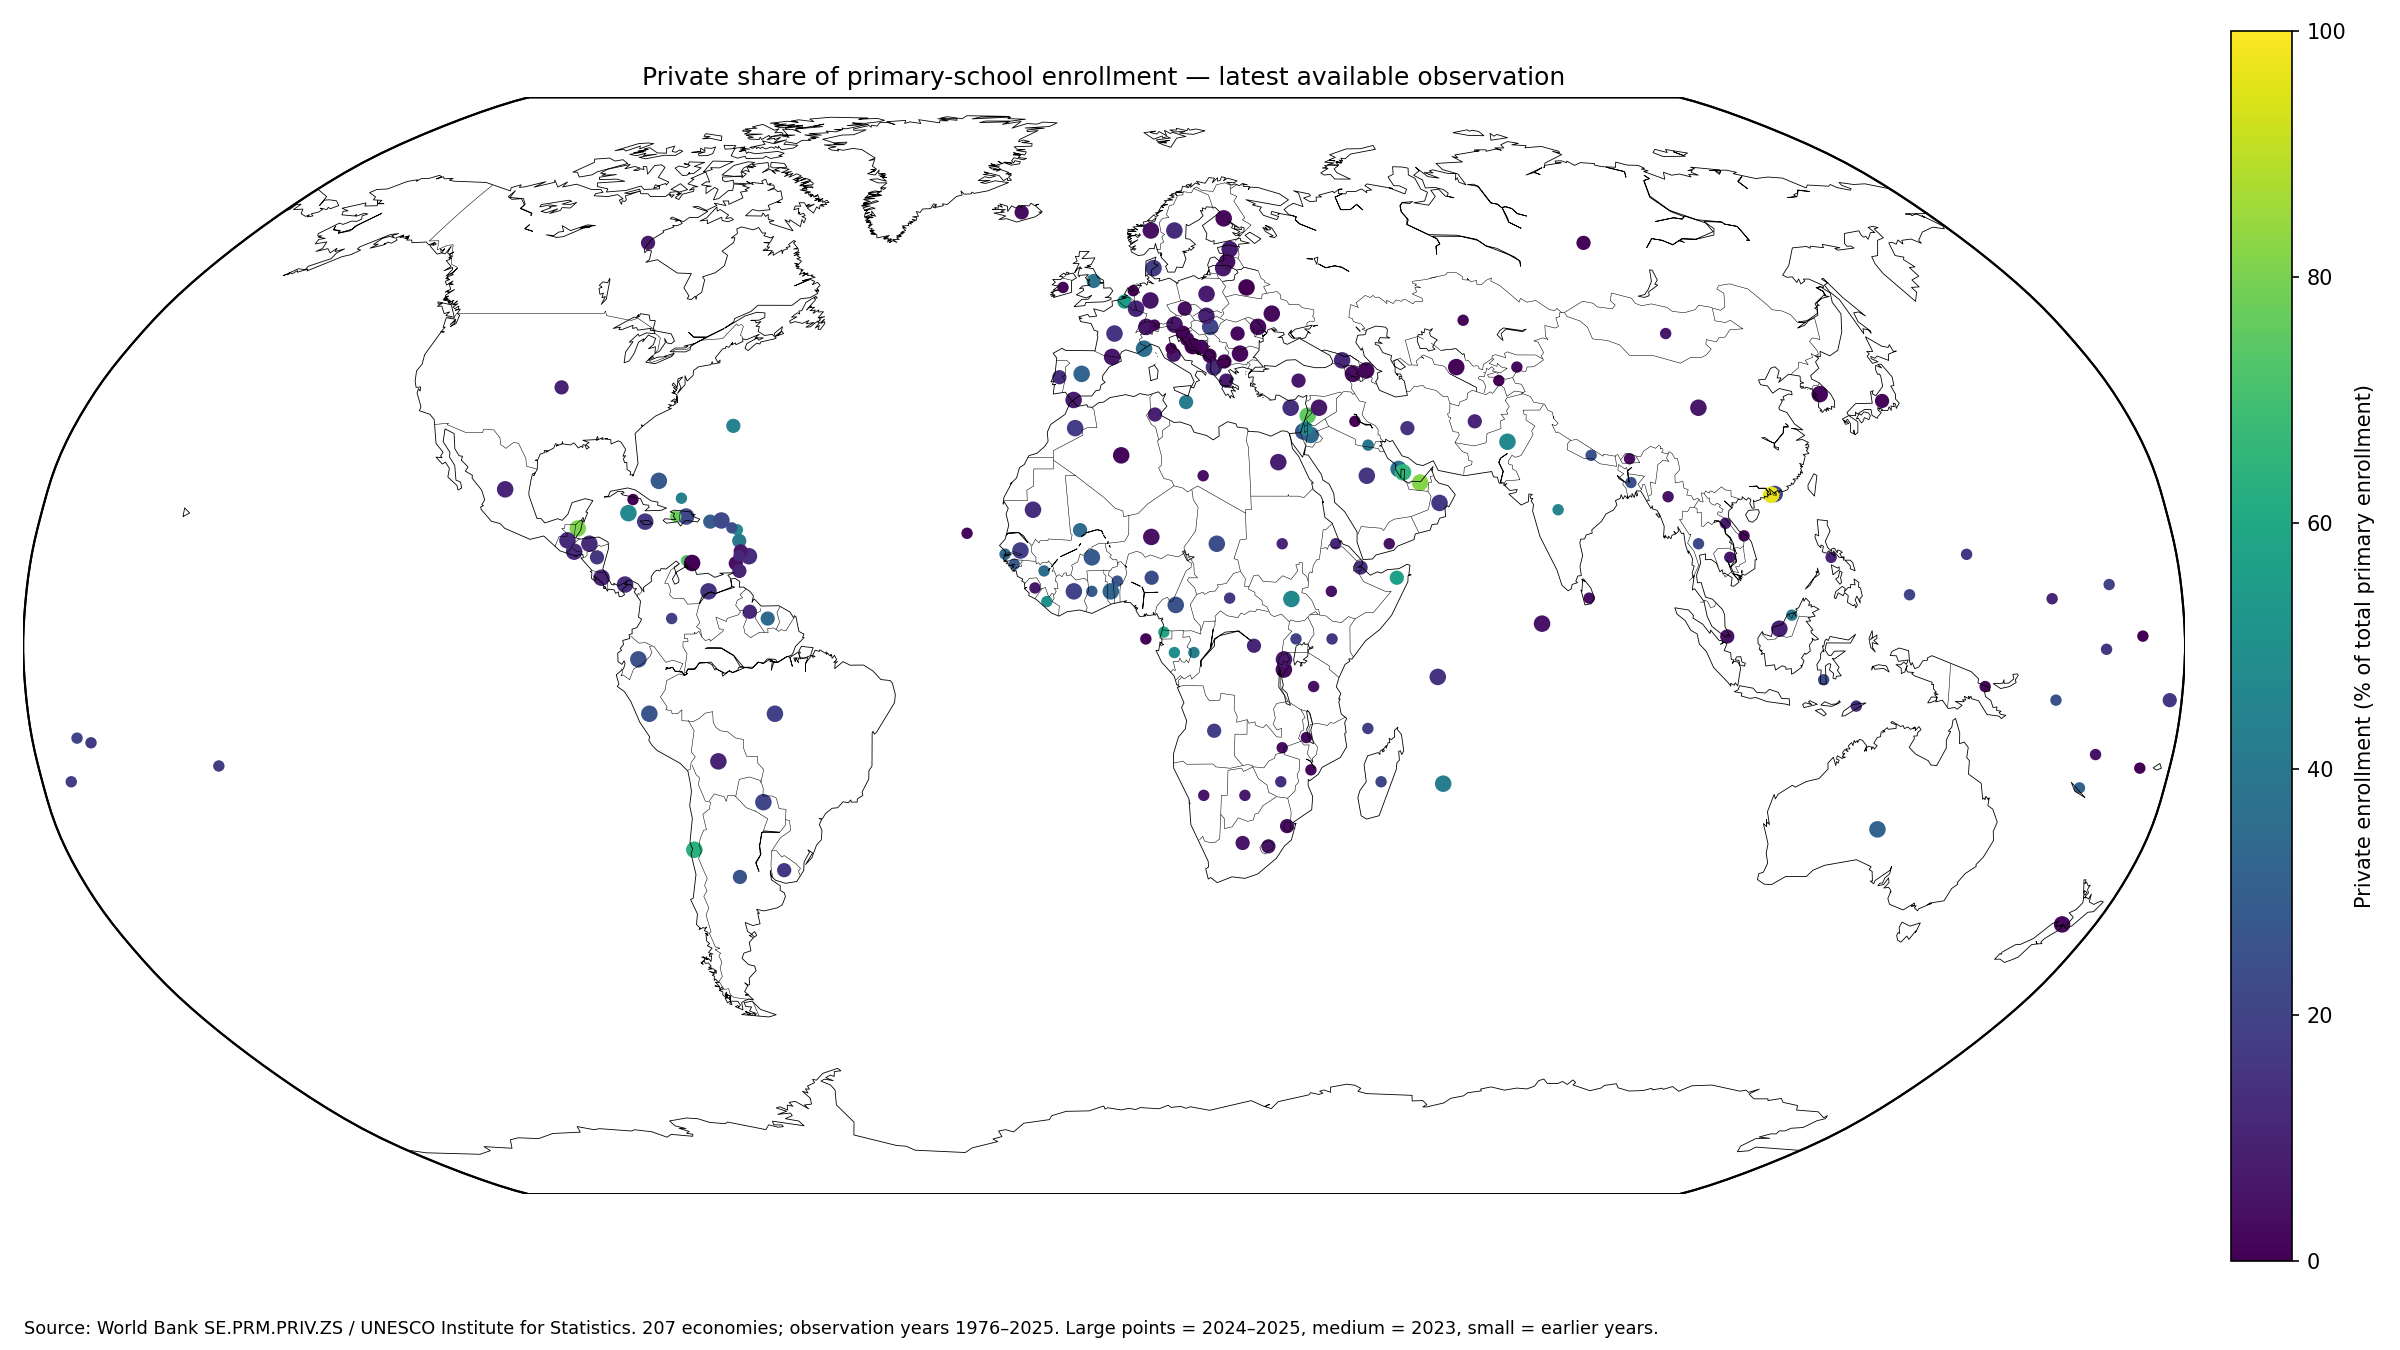
Table of Contents
The indicator counts pupils, not the number of private schools
The World Bank metadata glossary calculates the share by dividing enrollment in private educational institutions at the primary level by total primary enrollment in both public and private institutions, then multiplying by 100.
Children of primary-school age who are not enrolled are outside the denominator. The indicator therefore does not answer what proportion of all children attend private school and should not be substituted for a primary enrollment rate.
Private status is determined by control and management
UNESCO UIS treats a private educational institution as one controlled and managed by a non-governmental body. Religious organizations, foundations, NGOs, associations, communities, businesses and individuals can operate private institutions, whether or not they are organized for profit.
Public subsidies do not automatically make an institution public. A privately controlled school can receive substantial government support, which is one reason the public-private boundary can be more complex than a simple funding split.
The latest-observation median is 12.30%
The median across 207 latest observations is 12.30%. The middle half lies between 4.64% and 24.39%. The mean of 17.83% is higher than the median because a smaller number of very high private-enrollment shares extends the upper tail.
55 observations are below 5%, 34 are from 5% to under 10%, 49 from 10% to under 20%, 43 from 20% to under 40%, 18 from 40% to under 60%, and 8 are at least 60%.
| Latest private primary-enrollment share | Economies | Share of 207 |
|---|---|---|
| Below 5% | 55 | 26.6% |
| 5% to under 10% | 34 | 16.4% |
| 10% to under 20% | 49 | 23.7% |
| 20% to under 40% | 43 | 20.8% |
| 40% to under 60% | 18 | 8.7% |
| 60% or more | 8 | 3.9% |
The highest latest observations do not all refer to the same year
Macao SAR, China records 96.43%, the United Arab Emirates 81.64%, Belize 80.72%, Haiti 76.71%, and Lebanon 75.51% in their latest available observations.
Haiti’s value is from 1998, Aruba’s from 2014, and Equatorial Guinea’s from 2015. The full latest-value ranking is therefore a coverage-oriented comparison, not a synchronized 2024 or 2025 ranking.
| Latest-observation rank | Country or economy | Observation year | Private primary-enrollment share |
|---|---|---|---|
| 1 | Macao SAR, China | 2024 | 96.43% |
| 2 | United Arab Emirates | 2024 | 81.64% |
| 3 | Belize | 2024 | 80.72% |
| 4 | Haiti | 1998 | 76.71% |
| 5 | Lebanon | 2024 | 75.51% |
| 6 | Aruba | 2014 | 73.42% |
| 7 | Qatar | 2024 | 65.28% |
| 8 | Chile | 2024 | 63.54% |
| 9 | Equatorial Guinea | 2015 | 58.67% |
| 10 | Somalia, Fed. Rep. | 2023 | 56.53% |
| 11 | Belgium | 2023 | 53.94% |
| 12 | Liberia | 2020 | 49.63% |
| 13 | Gabon | 2019 | 49.12% |
| 14 | Antigua and Barbuda | 2018 | 48.76% |
| 15 | Cayman Islands | 2024 | 47.19% |
The synchronized 2024 subset covers 83 economies
Among the 83 observations from 2024, Macao SAR, China records 96.43%, the United Arab Emirates 81.64%, Belize 80.72%, Lebanon 75.51%, Qatar 65.28%, and Chile 63.54%.
| 2024 rank | Country or economy | Private primary-enrollment share |
|---|---|---|
| 1 | Macao SAR, China | 96.43% |
| 2 | United Arab Emirates | 81.64% |
| 3 | Belize | 80.72% |
| 4 | Lebanon | 75.51% |
| 5 | Qatar | 65.28% |
| 6 | Chile | 63.54% |
| 7 | Cayman Islands | 47.19% |
| 8 | Pakistan | 46.98% |
| 9 | South Sudan | 46.87% |
| 10 | Mauritius | 42.07% |
| 11 | Bahrain | 37.73% |
| 12 | Monaco | 35.30% |
| 13 | Jordan | 33.95% |
| 14 | Togo | 32.50% |
| 15 | Australia | 31.75% |
The 2024 subset has an unweighted mean of 19.53% and a median of 12.93%. Its first quartile is 6.26% and third quartile 25.04%. This subset is more useful when the goal is a same-year country comparison.
The 2024 distribution remains extremely wide
In 2024, 16 observations are below 5%, 16 are from 5% to under 10%, 22 from 10% to under 20%, 19 from 20% to under 40%, 4 from 40% to under 60%, and 6 are at least 60%.
The same reference year contains values close to zero and others above 80%. That spread documents major differences in how public and private institutions share primary enrollment, but it is not by itself evidence that one system is better.
Only two latest observations are from 2025
Burundi has a 2025 value of 3.07% and Mexico 10.18%. A source period extending through 2025 should not be interpreted as if all 207 economies had 2025 data.
There are 83 observations from 2024 and 45 from 2023, giving 130 observations from 2023 or later. 40 latest observations are older than 2020, and the oldest dates to 1976.
| Observation year | Economies |
|---|---|
| 2025 | 2 |
| 2024 | 83 |
| 2023 | 45 |
| 2022 | 9 |
| 2021 | 12 |
| 2020 | 16 |
| 2019 | 7 |
| 2018 | 10 |
| 2017 | 4 |
| 2016 | 2 |
| 2015 | 1 |
| 2014 | 2 |
| 2013 | 1 |
| 2010 | 1 |
| 2006 | 1 |
| 1998 | 2 |
| 1996 | 1 |
| 1995 | 1 |
| 1994 | 1 |
| 1993 | 2 |
| 1992 | 1 |
| 1991 | 2 |
| 1976 | 1 |
A high private share does not imply high primary-school participation
The denominator contains pupils who are already enrolled. Out-of-school children are not included in the private-share calculation, so an economy can have a high private share and still have enrollment challenges.
Primary gross enrollment ratios, adjusted net enrollment rates, completion rates, and out-of-school rates answer different questions about access and participation. This series describes provider composition only.
The percentage is not the share of schools that are private
A small number of large private schools can educate a large share of pupils, while many small private schools can account for a modest student share. Institution counts and pupil shares can therefore move differently.
Questions about the number or percentage of private schools require institution-level counts rather than this enrollment series.
A high private share is not an education-quality measure
The indicator contains no direct information on learning outcomes, teacher qualifications, class size, fees, affordability, facilities, or admissions. A high or low private share cannot establish that quality is better or worse.
Public-private performance comparisons require additional evidence on student backgrounds, selection, government support, local context and school resources.
Reported zero is different from missing data
Six of the 207 numeric latest observations are exactly 0%. Curacao has a reported zero in 2024, while several other zero observations are much older. These values are source observations rather than missing values filled with zero.
An economy not present in the latest-value coverage should not be inferred to have 0% private enrollment. Missing coverage and a reported numeric zero are different states.
Unregistered private schools can be undercounted
World Bank metadata notes that religious or private schools not registered with the government, or not following the common national curriculum, may not be captured in official statistics.
A very low recorded private share therefore does not necessarily prove that non-public education is entirely absent. National registration systems and the statistical coverage of UIS matter.
The reference year can represent a school year spanning two calendar years
UIS education statistics assign a reference year to a school year. If a school year begins in one calendar year and ends in the next, the observation can be labeled with the year in which that school year ends.
Country academic calendars differ, so identical year labels do not guarantee identical months. The 2024 subset is still far more time-consistent than the full 1976–2025 latest-value comparison.
The simple country mean is not a global pupil-weighted share
The 17.83% overall mean and 19.53% 2024 mean give every economy equal weight. A country with tens of millions of primary pupils and a small territory each contribute one percentage.
A global private-enrollment share would require weighting countries by total primary enrollment or using an official aggregate. The simple means here summarize the cross-country distribution only.
Source and calculation notes
The source is World Bank World Development Indicators series SE.PRM.PRIV.ZS, based on UNESCO Institute for Statistics data. The analysis uses 207 latest non-empty observations for rankings and distribution statistics and separately summarizes the 83 observations from 2024.
All 207 country codes are matched to geographic centroids for the map, producing a 100% match. Point size distinguishes 2024–2025, 2023, and earlier observations, and no missing observation is converted to zero.
Frequently Asked Questions
Is the private primary-school share the percentage of schools that are private?
No. It is private-primary enrollment divided by total primary enrollment in public and private institutions.
Does a high private share mean a high primary enrollment rate?
Not necessarily. The indicator describes the public-private composition of pupils who are already enrolled, not the share of all children who attend school.
Are all 207 observations from 2025?
No. Observation years range from 1976 to 2025, and only Burundi and Mexico have 2025 observations in this latest-value dataset.
Related Articles
Green Map creates custom-edited map images using open geographic data sources such as geoBoundaries, Natural Earth, OpenStreetMap, and government open data. These maps are edited visual materials, not raw data files, and are provided for education, documents, presentations, and graphic reference.