California recorded the largest 2024 value in the U.S. Energy Information Administration series for renewable fuel consumption in the Electric Power Sector Non-CHP category. With the query fixed to consumption-for-eg, fueltypeid=REN, and sectorid=90, California reported 30,252.6, followed by Michigan at 18,156.1 and New York at 14,372.7. EIA labels this series in thousand physical units. That label needs to remain attached to the numbers because this is not a megawatthour generation table and it is not the Btu-based renewable consumption series.
Adding the 50 states and the District of Columbia produces a comparison total of 186,226.3 within this exact series. California represents 16.2% of that 51-jurisdiction sum, the top three account for 33.7%, and the top ten account for 69.2%. Those shares describe the distribution of the reported physical-unit field only. They are not renewable electricity shares, market shares, or percentages of a state’s power supply. The distinction is especially important because EIA also publishes Btu-based fuel-consumption fields that place different energy sources on a common heat-content basis.
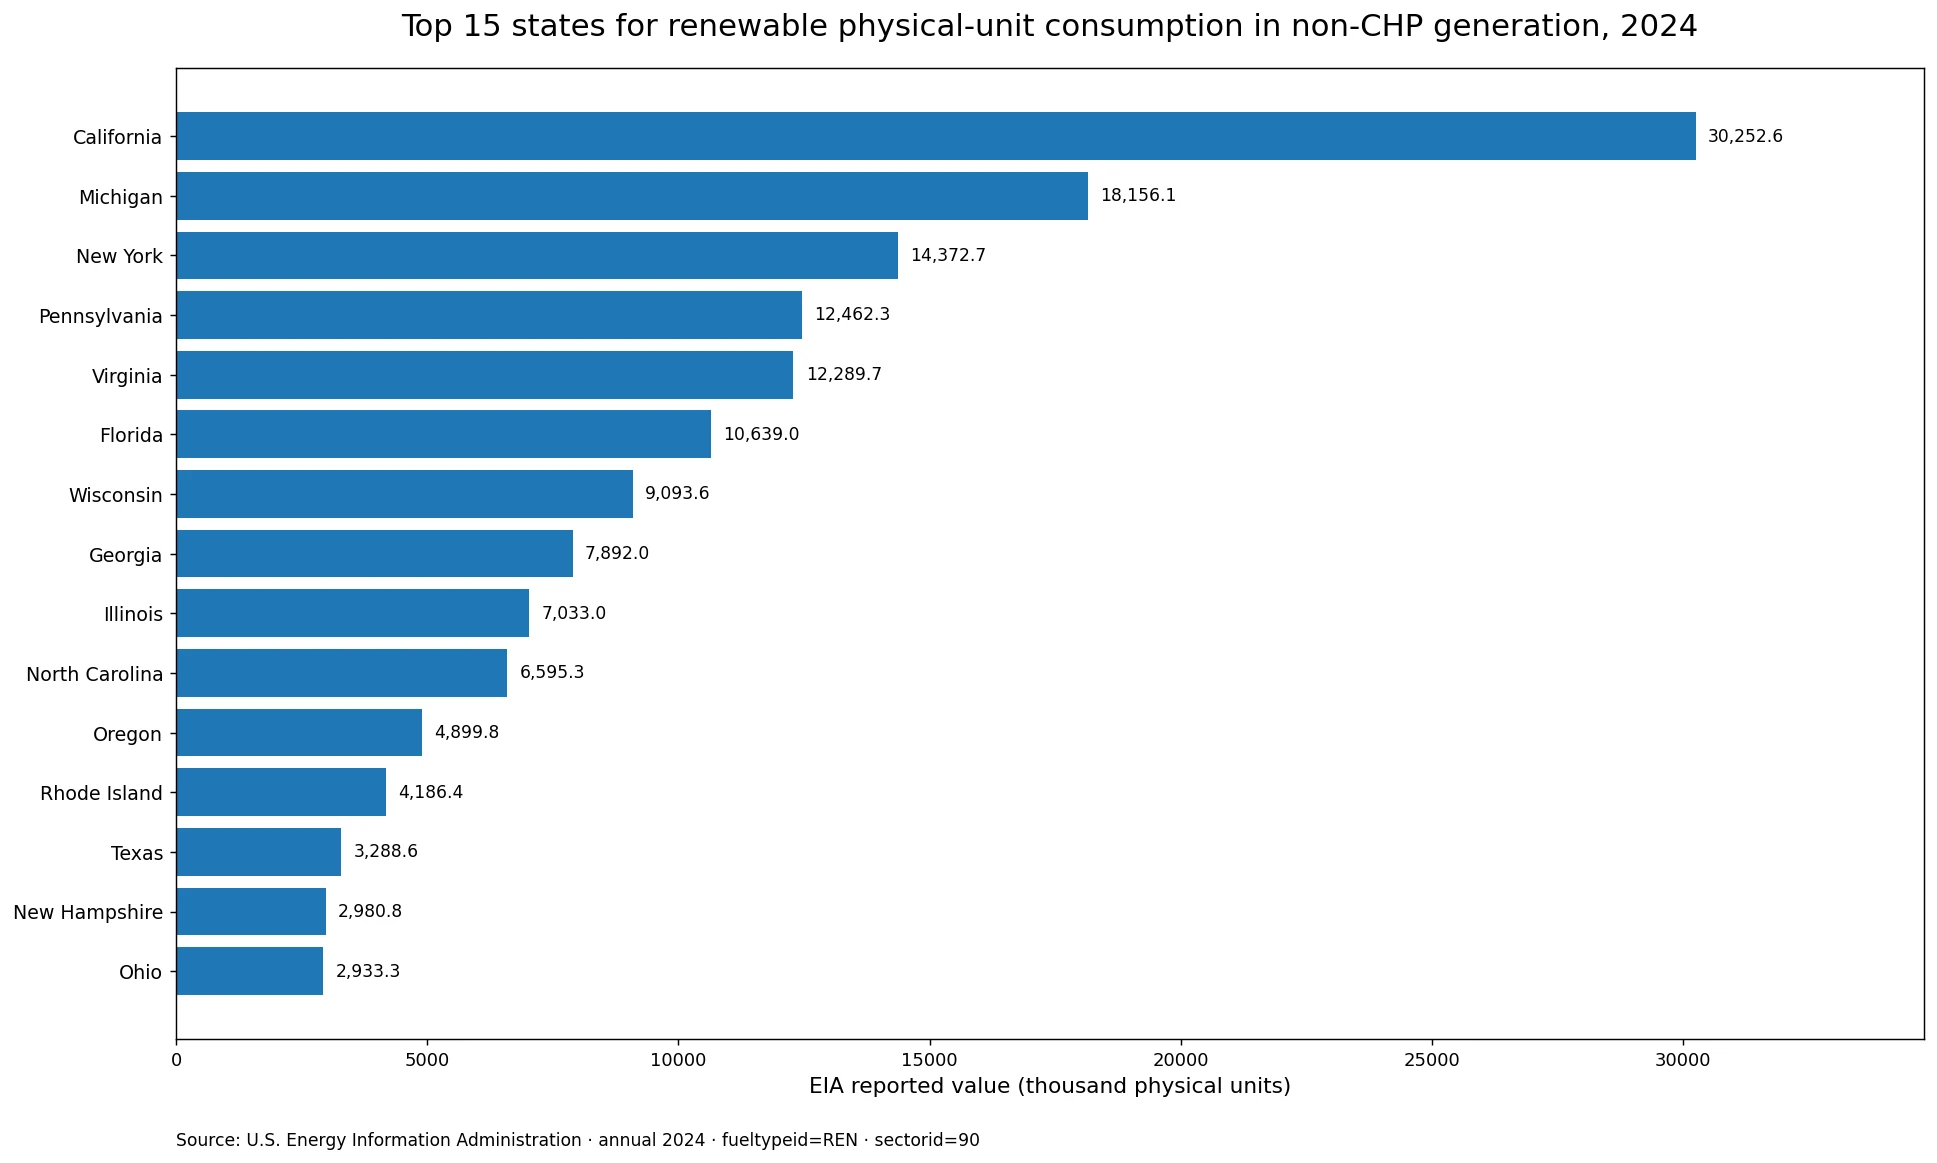
Table of Contents
The unit is part of the statistic, not a formatting detail
EIA’s electric power operational data include several measures that can sound similar in a headline. Generation is reported separately from fuel consumption, and fuel consumption itself can appear as a physical quantity or as a heat-content value. This dataset uses the physical-quantity field, consumption-for-eg. Its metadata identify the unit as thousand physical units. For that reason, the safest reading is literal: the article compares state values as EIA publishes them under this particular fuel and sector combination.
The numbers should not be relabeled as MWh, MMBtu, barrels, tons, or cubic feet without fuel-specific evidence. Form EIA-923 collects physical fuel quantities using units appropriate to the fuel being reported, while Btu fields are designed to express energy content on a common basis. Because this state slice is already aggregated under the REN fuel facet, keeping EIA’s generic physical-unit label is preferable to inventing a more specific unit. Readers who want an energy-equivalent comparison should use the corresponding Btu series rather than treating these raw physical values as if they were heat content.
California stood well above the middle of the distribution
California’s 30,252.6 was about 1.67 times Michigan’s second-place value. New York ranked third at 14,372.7, followed by Pennsylvania at 12,462.3 and Virginia at 12,289.7. Together, the five largest jurisdictions represented 47.0% of the 51-jurisdiction sum. The upper tier is therefore concentrated, but it is not dominated by a single state.
The state pattern also does not support a simple one-region story. California and Oregon place the West in the upper group, Michigan, Wisconsin, and Illinois represent the Midwest, and New York, Pennsylvania, Virginia, North Carolina, Florida, and Georgia add large values from the East and South. That geographic spread suggests that the ranking reflects multiple underlying power-system structures. The supplied state table, however, does not identify the specific renewable technologies or fuels responsible for each value, so it cannot establish a causal explanation for the ranking.
The top ten represented about 69.2% of the 51-jurisdiction sum
The first ten jurisdictions—California, Michigan, New York, Pennsylvania, Virginia, Florida, Wisconsin, Georgia, Illinois, and North Carolina—account for 69.2% of the comparison total. California alone contributes 16.2%, Michigan 9.7%, and New York 7.7%. The top-three share is 33.7%. These calculations are useful for describing concentration inside the dataset, but they should not be described as the share of U.S. renewable generation or the share of renewable energy use in each state.
A ranking based on absolute reported quantities is also influenced by the scale of the local electric power sector. Larger systems can appear high because they operate more generation, while smaller jurisdictions can have low absolute values even when renewables play an important role in their local mix. A relative measure would require a denominator, such as total generation, total fuel-energy input, population, or installed capacity. None of those denominators is part of this four-column state dataset.
Top 15 jurisdictions in 2024
| Jurisdiction | EIA reported value (thousand physical units) | Share of 51-jurisdiction sum |
|---|---|---|
| California | 30,252.6 | 16.25% |
| Michigan | 18,156.1 | 9.75% |
| New York | 14,372.7 | 7.72% |
| Pennsylvania | 12,462.3 | 6.69% |
| Virginia | 12,289.7 | 6.60% |
| Florida | 10,639.0 | 5.71% |
| Wisconsin | 9,093.6 | 4.88% |
| Georgia | 7,892.0 | 4.24% |
| Illinois | 7,033.0 | 3.78% |
| North Carolina | 6,595.3 | 3.54% |
| Oregon | 4,899.8 | 2.63% |
| Rhode Island | 4,186.4 | 2.25% |
| Texas | 3,288.6 | 1.77% |
| New Hampshire | 2,980.8 | 1.60% |
| Ohio | 2,933.3 | 1.58% |
The spacing between ranks is uneven. California is more than four times North Carolina, the tenth-ranked state, and more than nine times Texas, which ranks thirteenth in this slice. By contrast, Pennsylvania and Virginia are close to one another. Looking at the original values therefore adds context that a simple ordinal ranking would hide.
The mean was 3,651.5, but the median was 1,590.8
Across all 51 jurisdictions, the mean is 3,651.5 and the median is 1,590.8. The mean is about 2.30 times the median, indicating a right-skewed distribution in which several large state values pull the average upward. The first quartile is 605.8 and the third quartile is 3,134.7, so the middle half of the observations falls between those two values. California is more than 8.3 times the mean.
This difference matters when describing a “typical” jurisdiction. The average alone would imply a higher central level than most observations actually have. The median and quartiles show that many states sit far below the leading group. Concentration measures and central-tendency measures therefore tell complementary parts of the story: the upper tail is substantial, while a large portion of jurisdictions remains in a much lower range.
Five reported zeros are real observations, not missing records
Five jurisdictions—Alaska, the District of Columbia, North Dakota, South Dakota, and Wyoming—have values of zero. The dataset contains 51 rows and no missing values, so those zeros were retained as published rather than treated as blanks or replaced through imputation. At the same time, a zero in this exact REN/sector 90/consumption-for-eg slice should not be generalized to “no renewable electricity” in that jurisdiction. Other EIA fuel, generation, sector, or technology series can report different values because they answer different questions.
This is also a visualization issue. A genuine zero and missing data should be kept distinct. The chart shown here focuses on the top 15 for readability, but the summary statistics use all 51 observations, including the five zeros.
Why the ranking can differ from the Btu renewable series
A Btu-based series converts or accounts for energy using a common heat unit, making it more suitable when the question is the scale of energy input across different fuels. The physical-unit series preserves a quantity field instead. This candidate also fixes the sector to Electric Power Sector Non-CHP, so its scope differs from broader all-sector renewable tables. When fuel facet, sector facet, field, or unit changes, the statistical identity changes as well.
That is why a state can rank high in one renewable table and much lower in another without any inconsistency. A Btu article, a physical-unit consumption article, and a net-generation article each measure a different aspect of the power system. They should be linked for context, not merged numerically. For analytical work, the field name and unit should be written down before comparing any two series.
Source and calculation method
The primary source is the U.S. Energy Information Administration Electric Power Operational Data, which EIA identifies as monthly and annual state, sector, and energy-source data based on Form EIA-923. This slice uses annual 2024 observations, consumption-for-eg, fueltypeid=REN, and sectorid=90. The supplied dataset contains one row for every state and the District of Columbia and has no missing values.
The 186,226.295 comparison total is the sum of those 51 rows, not a separately imported national observation. The mean, median, quartiles, rankings, and concentration shares were calculated directly from the same values. No cross-year substitutions, missing-value fills, or unit conversions were added. The chart uses the 15 largest observations while the descriptive statistics use the full set.
Four rules for interpreting this table
- Keep the unit as EIA’s thousand physical units; do not relabel the values as MWh or MMBtu.
- Sector 90 is Electric Power Sector Non-CHP, so the table does not automatically represent every CHP, industrial, or commercial fuel-use category.
- Large absolute values do not establish a high renewable share, high efficiency, or better policy performance.
- A reported zero is not the same as missing data and does not imply zero renewable generation in every other EIA series.
The main empirical result is straightforward: California led at 30,252.6, Michigan and New York followed, and the top ten jurisdictions represented 69.2% of the state-and-D.C. sum. The more important analytical result is that the unit determines what can be concluded. This physical-unit series is useful for mapping the distribution of EIA’s reported quantity field, while Btu consumption and MWh generation should remain separate measures.
Frequently Asked Questions
Which state had the largest 2024 value in this physical-unit series?
California ranked first at 30,252.6 thousand physical units, followed by Michigan and New York.
Can thousand physical units be read as MWh or MMBtu?
No. This is EIA’s consumption-for-eg physical-quantity field. Generation in MWh and energy-equivalent consumption in Btu are separate measures.
Do the five zero values mean missing data?
No. All 51 jurisdictions have observations in the supplied dataset. The five zeros are reported values for this exact fuel, sector, and field combination.
Related Articles
Green Map creates custom-edited map images using open geographic data sources such as geoBoundaries, Natural Earth, OpenStreetMap, and government open data. These maps are edited visual materials, not raw data files, and are provided for education, documents, presentations, and graphic reference.