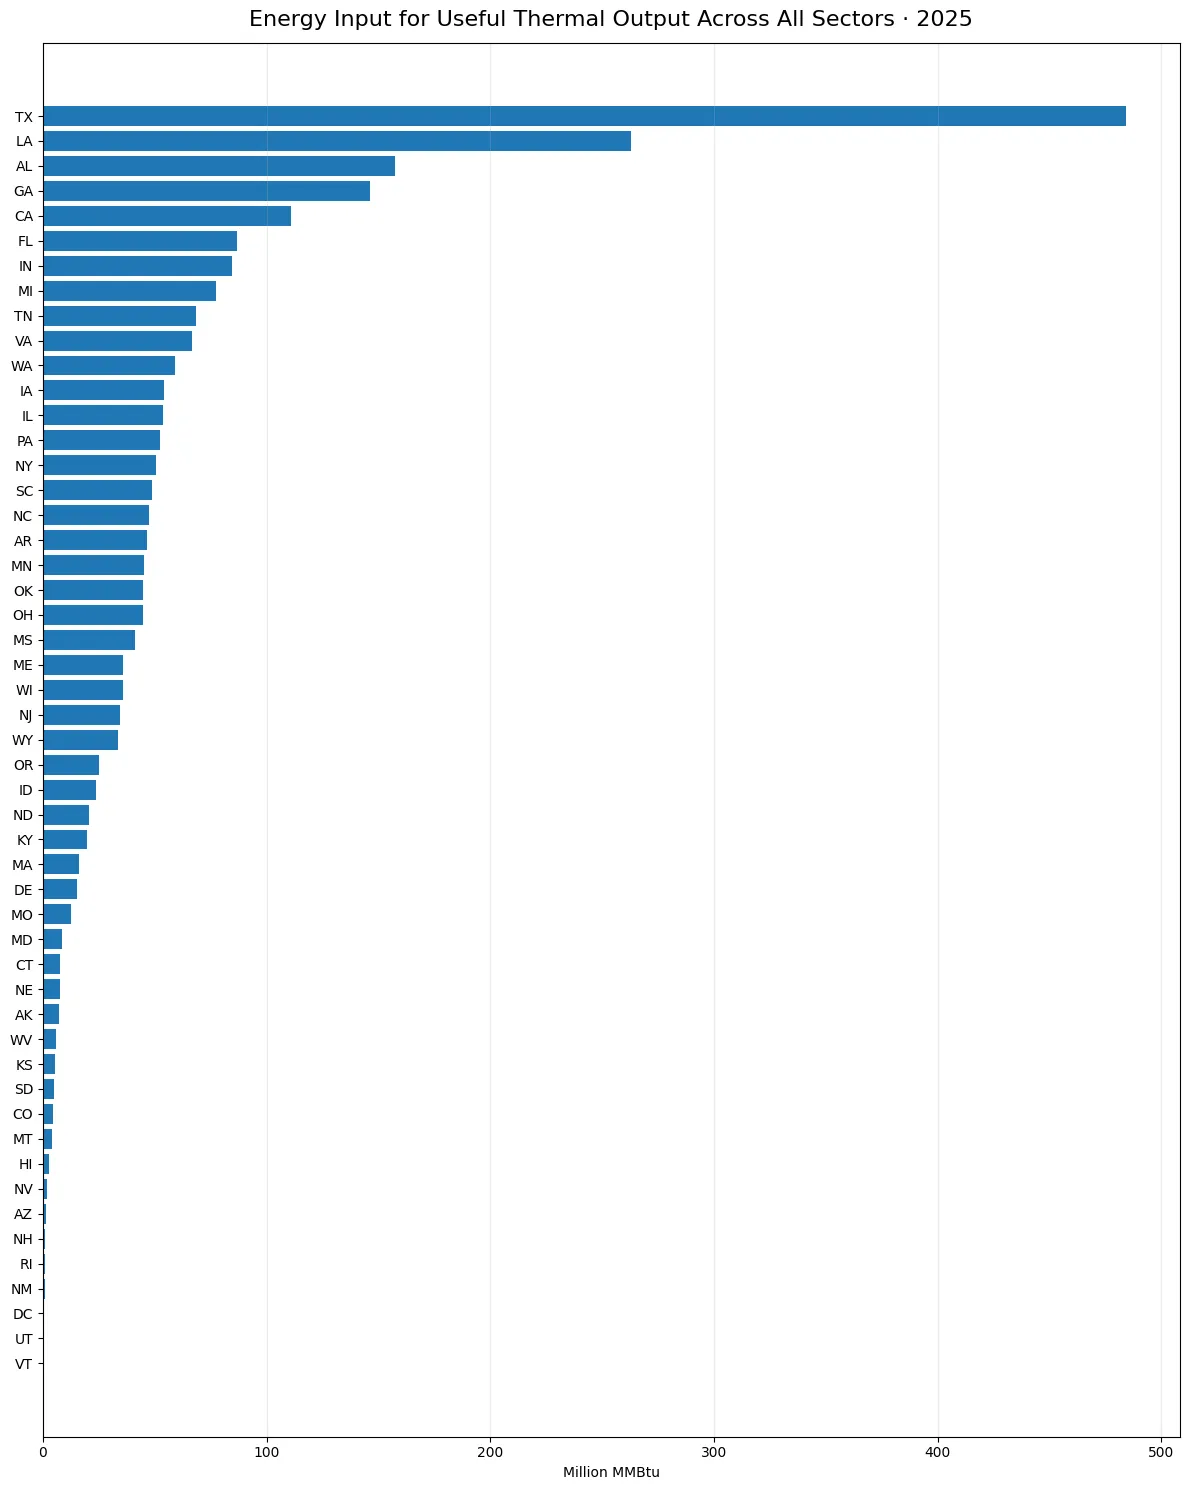
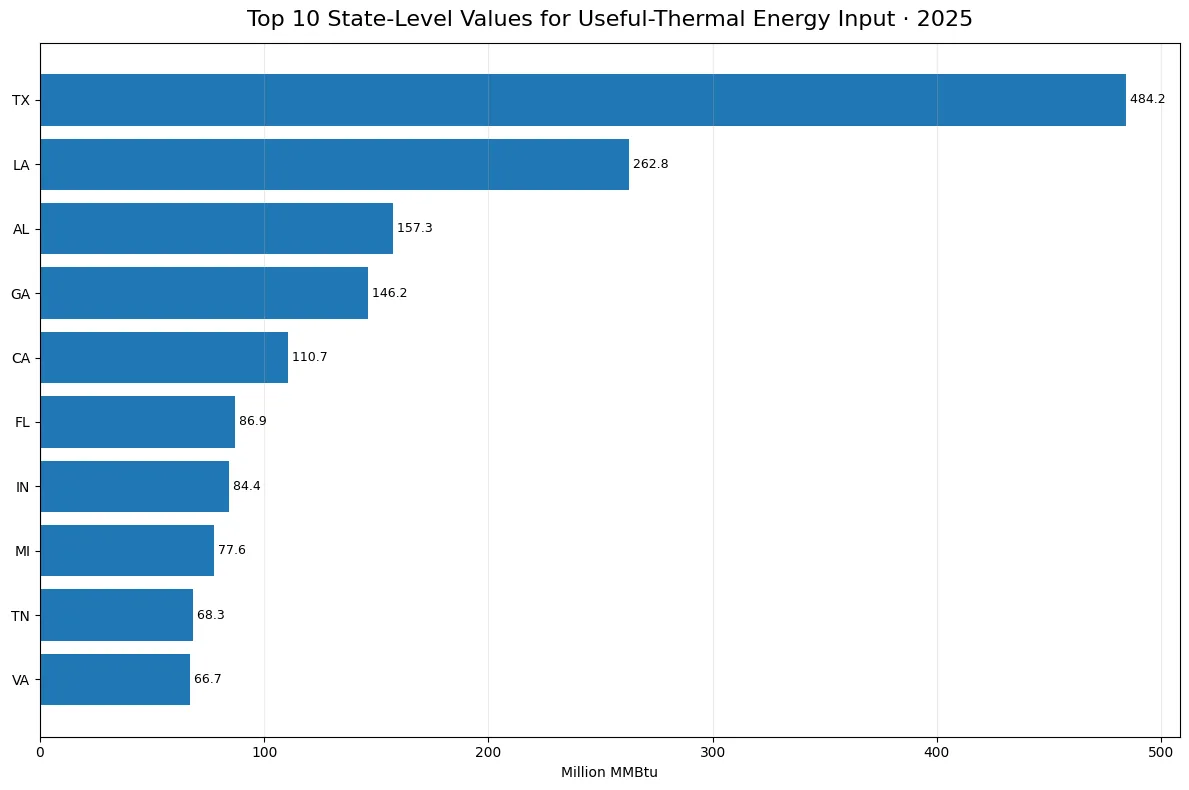
Texas recorded the largest 2025 fuel-energy input for useful thermal output in the EIA state-level observations, at 484.217 million MMBtu. Louisiana followed at 262.796 million MMBtu and Alabama at 157.326. Across the 50 states and the District of Columbia, the 51 published observations sum to 2,470.778 million MMBtu. Texas represented 19.60% of that comparable total. The metric is an energy-input measure for useful thermal output, not electricity generation measured in megawatt-hours.
The source is the U.S. Energy Information Administration Electric Power Operational Data. The comparison fixes fueltypeid at ALL, sectorid at 99, the field at consumption-uto-btu, the frequency at annual, and the year at 2025. Every one of the 51 jurisdictions has a positive reported value. There are no source-missing observations and no reported zeros in this slice, so the ranking does not depend on imputing missing values or replacing them with zero.
Table of Contents
What consumption-uto-btu measures
The field name expands to consumption of fuels for useful thermal output, expressed on a Btu basis. It measures the heat-energy content of fuels consumed to produce useful thermal output within the EIA electric-power operational framework. That makes it fundamentally different from net generation, which is an electricity-output measure, and from generating capacity, which describes the maximum potential output of equipment. It also differs from physical fuel quantities such as barrels, short tons, or cubic feet. Million MMBtu places fuels on a common energy basis so unlike physical units can be compared in one measure.
The ALL fuel facet means the value combines the fuel categories represented in this EIA operational series. Sector 99 is labeled All Sectors within the same data system. Neither label should be expanded into a claim about every use of energy in the entire U.S. economy. Transportation fuels, household heating outside this operational scope, and many other final-energy uses belong to different statistical systems. The safest interpretation is therefore narrow: this is the EIA state-level useful-thermal fuel-energy measure under the ALL and sector 99 facets for 2025.
Texas and Louisiana stand out at the top
Texas contributed 19.60% of the 51-jurisdiction sum. Louisiana contributed 10.64% and Alabama 6.37%. Together, the three leading jurisdictions accounted for 36.60%. The gap between Texas and Louisiana was 221.421 million MMBtu, showing a substantial separation between first and second place. Georgia ranked fourth at 146.183 million MMBtu, while California ranked fifth at 110.735 million MMBtu.
A high value does not, by itself, identify the reason a jurisdiction uses more fuel energy for useful thermal output. Differences can reflect the mix of facilities, combined heat and power operations, industrial thermal demand connected with the electric-power system, fuel availability, utilization rates, and other operating conditions. Those possible drivers require additional evidence. The present observations establish the size and distribution of the metric, not a causal explanation for why Texas, Louisiana, or any other state appears where it does in the ranking.
| Jurisdiction | Code | Million MMBtu | Share of 51-jurisdiction sum |
|---|---|---|---|
| Texas | TX | 484.217 | 19.60% |
| Louisiana | LA | 262.796 | 10.64% |
| Alabama | AL | 157.326 | 6.37% |
| Georgia | GA | 146.183 | 5.92% |
| California | CA | 110.735 | 4.48% |
| Florida | FL | 86.926 | 3.52% |
| Indiana | IN | 84.430 | 3.42% |
| Michigan | MI | 77.592 | 3.14% |
| Tennessee | TN | 68.341 | 2.77% |
| Virginia | VA | 66.705 | 2.70% |
The top 10 account for 62.54% of the comparable sum
The ten largest observations make up 62.54% of the 51-jurisdiction sum. The leading three alone make up 36.60%. This points to a distribution that is meaningfully concentrated at the top, but not confined to only one or two states. Below the top ten, jurisdictions such as Washington, Iowa, Illinois, Pennsylvania, and New York still report values in the tens of million MMBtu. Useful-thermal fuel-energy use is therefore geographically broad even though the largest jurisdictions pull a substantial part of the total toward the upper end.
The arithmetic mean is 48.447 million MMBtu, while the median is 33.447. The mean is higher because the largest observations, especially Texas and Louisiana, pull it upward. For a skewed distribution like this, the median helps describe a more typical middle position: half of the 51 jurisdictions are at or below roughly 33.447 million MMBtu. Reading the mean, median, and concentration shares together provides more context than using the first-place value alone.
Small observations are reported values, not missing data
Vermont has the smallest reported value at 0.21197 million MMBtu. Utah, the District of Columbia, New Mexico, and Rhode Island are also near the lower end. These values are not blanks. Treating them as missing or dropping them would change the distribution and overstate the typical size. Because all 51 jurisdictions have reported values, the ranking can retain both very small and very large observations without a missing-value adjustment.
A small useful-thermal value also should not be read as low overall energy consumption or low electricity production. Electricity-generation fuel use is measured with fields such as consumption-for-eg-btu, while a broader fuel-energy total can be represented by total-consumption-btu. Fuel-specific versions can isolate petroleum, fossil fuels, renewables, or other groups. A jurisdiction can therefore rank low here and rank very differently on generation, total fuel input, or a particular fuel category. Metric identity matters as much as the state name.
How this differs from total-consumption-btu
The distinction between consumption-uto-btu and total-consumption-btu is essential. The present field covers fuel energy used for useful thermal output. The total-consumption-btu field combines the relevant consumption used for electricity generation and useful thermal output. If a reader substitutes one field for the other, the resulting title, state shares, and interpretation change. Comparing the two can be informative, but only when fuel, sector, year, unit, and geographic coverage are held constant. Otherwise the difference can reflect a changed definition rather than a real operational pattern.
The Btu basis also solves a different problem from physical-unit data. A barrel of petroleum, a short ton of coal, and a volume of natural gas cannot simply be added as raw quantities. Converting their energy content to a common Btu basis makes aggregation across fuel types possible. The resulting million-MMBtu value is useful for comparing energy input, but it is still not a direct measure of thermal output efficiency. Efficiency would require a suitable output measure and a carefully matched denominator, neither of which is supplied by this single metric.
Useful comparisons for a fuller energy picture
A stronger follow-up analysis would separate the ALL fuel total into individual fuel groups and compare generation-related consumption with useful-thermal consumption. Sector distinctions also matter, especially where combined heat and power activity is important. Looking at several years under the same facet settings would show whether a high 2025 value is persistent or temporary. None of these extensions requires changing the meaning of the present observation; they simply add dimensions that can help explain the distribution.
Normalization can answer a different class of questions. The current ranking compares absolute energy inputs, so large systems can naturally appear near the top. A per-capita measure, a value per unit of useful thermal output, or a value relative to installed capacity would require additional denominators. Those ratios might help investigate intensity or efficiency, but they cannot be inferred safely from the absolute values alone. For this reason, the state-level chart should be read as a scale comparison rather than an efficiency league table.
What to retain from the 2025 comparison
Texas led the 2025 useful-thermal fuel-energy observations at 484.217 million MMBtu, followed by Louisiana and Alabama. The top three represented 36.60% of the 51-jurisdiction sum and the top ten 62.54%. The mean of 48.447 exceeded the median of 33.447, consistent with the influence of large observations at the top. The main interpretive boundary is equally important: this is an EIA ALL-fuels, sector-99, consumption-uto-btu measure for useful thermal output, not total U.S. energy use and not electricity generation.
Frequently Asked Questions
Which jurisdiction had the largest 2025 useful-thermal fuel-energy input?
Texas was highest at 484.217 million MMBtu, equal to 19.60% of the sum of the 51 reported observations.
Does consumption-uto-btu measure electricity generation?
No. It measures the energy content of fuels consumed for useful thermal output. Electricity generation is an output measure reported in units such as MWh.
Does sector 99 All Sectors mean all energy use in the U.S. economy?
No. It is the All Sectors facet within EIA Electric Power Operational Data and should not be expanded to every end use of energy in the economy.
Were missing state values replaced with zero?
No. All 51 state-level jurisdictions have positive reported values in this 2025 slice, with no source-missing observations.
Related Articles
Green Map creates custom-edited map images using open geographic data sources such as geoBoundaries, Natural Earth, OpenStreetMap, and government open data. These maps are edited visual materials, not raw data files, and are provided for education, documents, presentations, and graphic reference.