The 2024 World Bank series for female primary gross enrollment contains usable observations for 134 countries and economies. Another 83 of the 217 rows have no value for that year. Across the reporting economies, the median is 99.30% and the unweighted mean is 100.59%. Sierra Leone records 166.35%, Rwanda 146.68%, and Malawi 140.69% at the upper end, while Niger is lowest at 63.28%, followed by the British Virgin Islands at 73.55% and Burkina Faso at 78.30%. Sixty-one observations exceed 100%, which is a normal possibility for this particular indicator rather than an automatic data error.
The indicator code SE.PRM.ENRR.FE measures the female gross enrollment ratio in primary education. It compares all female students enrolled in primary education, irrespective of their age, with the female population in the official age group for primary school. Because the numerator can include children who entered late or early, repeated a grade, or returned after an interruption, it can be larger than the official-age population used in the denominator. A value of 120% therefore describes enrollment volume relative to the official-age population; it does not mean that 120% of girls of primary-school age are enrolled.
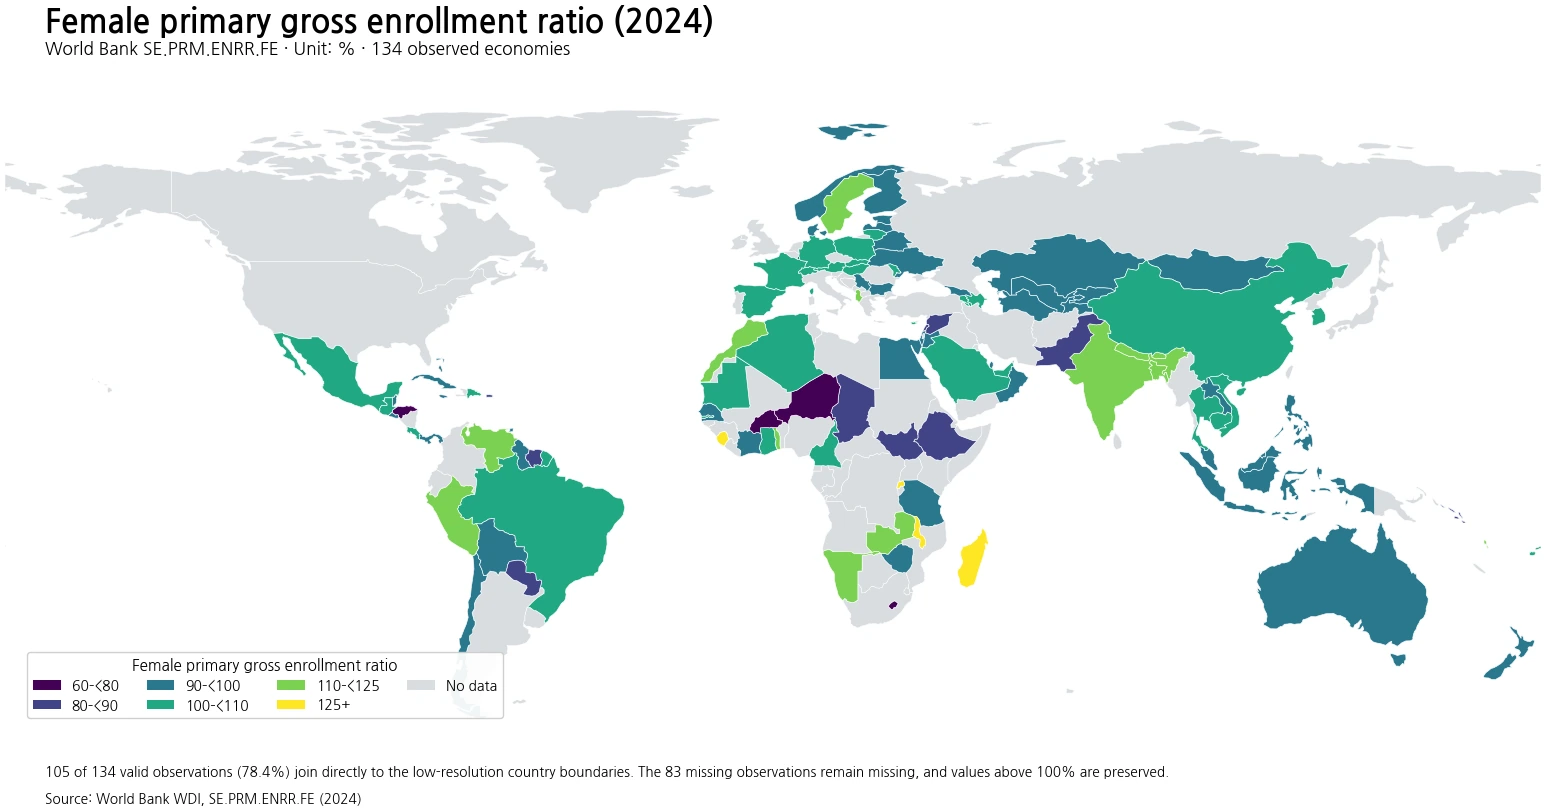
Table of Contents
A median near 100% hides a meaningful spread
The middle half of the observed values runs from 94.49% at the first quartile to 105.72% at the third quartile. A total of 115 reporting economies are at or above 90%, while 61 are at or above 100%. Only four observed values are below 80%. Those figures show that the distribution is concentrated around the size of the official primary-school-age female population, yet it is not tightly capped at 100%. The shape reflects the design of a gross ratio as much as it reflects the scale of enrollment.
The simple mean of 100.59% is slightly above the median because a number of very high observations pull it upward. Sierra Leone, Rwanda, Malawi, and Madagascar all exceed 130%. This average should not be described as a global female primary enrollment rate. Every reporting economy counts once in the calculation, regardless of population. A small island economy and a country with hundreds of millions of residents have the same weight in this descriptive mean. A population-weighted global rate would require enrollment counts and official-age populations, not an average of national percentages.
Why 100% is not a ceiling for a gross enrollment ratio
Gross enrollment is designed to capture the overall volume of participation in an education level. That broad coverage is useful, but it also means the measure does not enforce age alignment. If many pupils are older than the official primary age because of late entry or grade repetition, total enrollment can rise above the reference population. Early entrants and students returning after time out of school can have the same effect. For that reason, clipping values to 100% would remove information that the indicator was specifically designed to retain.
The consequence is that higher is not always equivalent to better in a simple ranking sense. A ratio above 100% may coexist with broad access, but it can also reflect age distortion within the school system. The indicator alone cannot separate those mechanisms. Net enrollment, age-specific attendance, repetition, progression, and completion statistics are needed to answer different questions. Gross enrollment is most informative when it is read as the size of enrollment relative to the official-age population, not as a direct score of system quality.
The highest reported ratios are not a league table of education quality
| Country or economy | Female primary gross enrollment, 2024 |
|---|---|
| Sierra Leone | 166.35% |
| Rwanda | 146.68% |
| Malawi | 140.69% |
| Madagascar | 135.63% |
| Nepal | 124.50% |
| Turks and Caicos Islands | 124.06% |
| India | 119.86% |
| Sweden | 119.32% |
| Bhutan | 119.29% |
| Monaco | 118.87% |
The upper group spans economies with very different population sizes, school structures, and demographic profiles. Sierra Leone is at 166.35%, Rwanda at 146.68%, Malawi at 140.69%, and Madagascar at 135.63%. Nepal, the Turks and Caicos Islands, India, Sweden, Bhutan, and Monaco complete the top ten. The shared feature is a high gross ratio, but this dataset does not identify the reason behind it. It cannot tell whether the value mainly reflects late entry, repetition, re-entry, early entry, or another feature of enrollment and population structure.
Preserving the published values matters analytically. Replacing every observation above 100% with 100 would compress the upper tail and change the median, mean, map classes, and country ordering. It would also turn a gross ratio into something closer to a bounded percentage even though that is not how the source defines the series. The correct response to a 166% observation is therefore to explain the denominator and numerator, not to silently modify the number.
Reported low values are different from missing observations
| Country or economy | Female primary gross enrollment, 2024 |
|---|---|
| Niger | 63.28% |
| British Virgin Islands | 73.55% |
| Burkina Faso | 78.30% |
| Lesotho | 78.60% |
| Honduras | 79.48% |
| Solomon Islands | 80.63% |
| Curacao | 81.22% |
| Lebanon | 81.40% |
| Ethiopia | 81.41% |
| Syrian Arab Republic | 81.51% |
The lowest reported observations range from 63.28% in Niger to 81.51% in the Syrian Arab Republic within the bottom ten. These are measured values. They must be kept separate from the 83 economies without a 2024 observation. A missing value says that the source does not provide a usable observation for this comparison; it does not indicate zero enrollment. Treating missing rows as zero would create false low performers, depress summary statistics, and fill the map with invented values.
A low gross ratio directly says that total female primary enrollment is small relative to the size of the official-age female population. It does not by itself explain why. Questions about school supply, household constraints, migration, conflict, distance, or dropout require separate evidence. Keeping that distinction between measurement and explanation prevents the country comparison from turning into unsupported causal claims.
The female series alone does not measure a gender gap
This article uses the female series only. It therefore cannot establish whether girls have higher or lower enrollment than boys in a given economy. A gender comparison requires the male primary gross enrollment ratio for the same year and definition, ideally with matching availability. A female ratio of 110% could coexist with a male ratio close to 110%, above it, or below it. Without the companion series, any statement about gender balance would go beyond the evidence in this dataset.
Year alignment also matters. Comparing a 2024 female observation with a male observation from another year can mix real gender differences with changes over time or revisions in reporting. The safest comparison uses the same indicator family, same provider, same reference year, and the same country coverage. Here the focus remains narrower: how the 2024 female gross ratio varies across reporting countries and economies.
The map is a spatial summary, not a complete inventory
The low-resolution boundary layer directly matches 105 of the 134 valid observations, or 78.4%. Several small islands and separately reported economies do not have an independent polygon or a matching ISO3 code in that boundary file. Their values still remain in the statistical distribution and the ranking tables. The map should therefore be read as a geographic overview of the matched economies rather than as proof that only the colored areas have data.
The legend is also descriptive, not evaluative. The bins are shaped around a distribution that clusters close to 100%, with separate bands below 90%, from 90% to 100%, and above 100%. Economies that share a color are not necessarily similar in education policy, age structure, or progression patterns. Spatial clustering can be a useful prompt for further investigation, but it does not establish a common cause.
Useful companion indicators answer different education questions
A net enrollment ratio narrows the question to children in the official age range. A completion rate shifts attention from being enrolled to reaching the end of primary education. Attendance measures can provide another perspective when administrative enrollment and actual participation differ. Learning assessments address whether students acquire specific skills. Male and female series together can describe gender balance. None of those measures is interchangeable with the gross enrollment ratio, and combining them is more informative than asking one number to carry every interpretation.
For example, a country can show a gross ratio above 100% while still having age distortion or incomplete progression. Another can record a ratio below 100% but improve quickly in completion or learning outcomes. The gross ratio is valuable precisely because it captures enrollment volume broadly. Its limitation becomes manageable when the reader keeps the definition narrow and uses other indicators for age alignment, persistence, completion, and learning.
Data scope and calculation choices
The comparison uses the World Bank WDI series SE.PRM.ENRR.FE for 2024. Of 217 country and economy rows, 134 have a numeric observation and 83 are missing for the reference year. Summary statistics are calculated only from the 134 observed values. Each economy is weighted equally when the mean and median are reported; no population weighting is applied. The top and bottom tables also use the original published ratios without capping values above 100%.
For the map, observed values are joined to a low-resolution world boundary dataset through ISO3 codes. A boundary mismatch does not change the status of the source observation. Missing source values remain missing, while valid values for small economies remain part of the analysis even when they cannot be shaded as a polygon. These choices separate source data quality from cartographic coverage and avoid manufacturing geographic values that do not exist.
What the 2024 comparison tells us
Among the 134 reporting economies, female primary gross enrollment is centered very close to 100%, but the range from 63.28% to 166.35% is wide. Sixty-one observations exceed 100%, which makes the definition of a gross ratio essential to any interpretation. The map and tables are best used to identify differences in the scale of female primary enrollment relative to the official-age female population. They do not by themselves rank education quality, explain the causes of low or high enrollment, or measure the gender gap. Those questions require additional indicators.
Frequently Asked Questions
Can the female primary gross enrollment ratio exceed 100%?
Yes. Gross enrollment counts all female pupils enrolled in primary education regardless of age, while the denominator is the official primary-school-age female population.
Do the 83 economies without a 2024 value have a 0% ratio?
No. They are missing source observations for the reference year and must remain separate from real low or zero values.
Can the female series alone show a gender gap in primary enrollment?
No. A direct gender comparison requires the male series for the same year and the same gross-enrollment definition.
Related Articles
Green Map creates custom-edited map images using open geographic data sources such as geoBoundaries, Natural Earth, OpenStreetMap, and government open data. These maps are edited visual materials, not raw data files, and are provided for education, documents, presentations, and graphic reference.