UNESCO Institute for Statistics indicator ETOIP.02.PR.F reports the female percentage of enrolment in private pre-primary institutions. The 2024 extract contains 80 countries and territories, and every observation refers to the same year. That common reference year matters because it allows a genuine cross-sectional comparison rather than a ranking that mixes old and recent observations. The denominator is enrolment in private pre-primary education, so the indicator describes the sex composition inside that institutional group; it does not say what percentage of all girls attend private pre-primary institutions.
The distribution is tightly centered near parity. The median is 48.94% and the simple mean is 48.31%. 60 of the 80 observations fall between 48% and 52%, while 71 fall between 47% and 53%. These counts show that the main story is not a dramatic separation between countries. Most reported systems cluster close to an even female-male composition, with a small number of observations sitting well outside that central band.
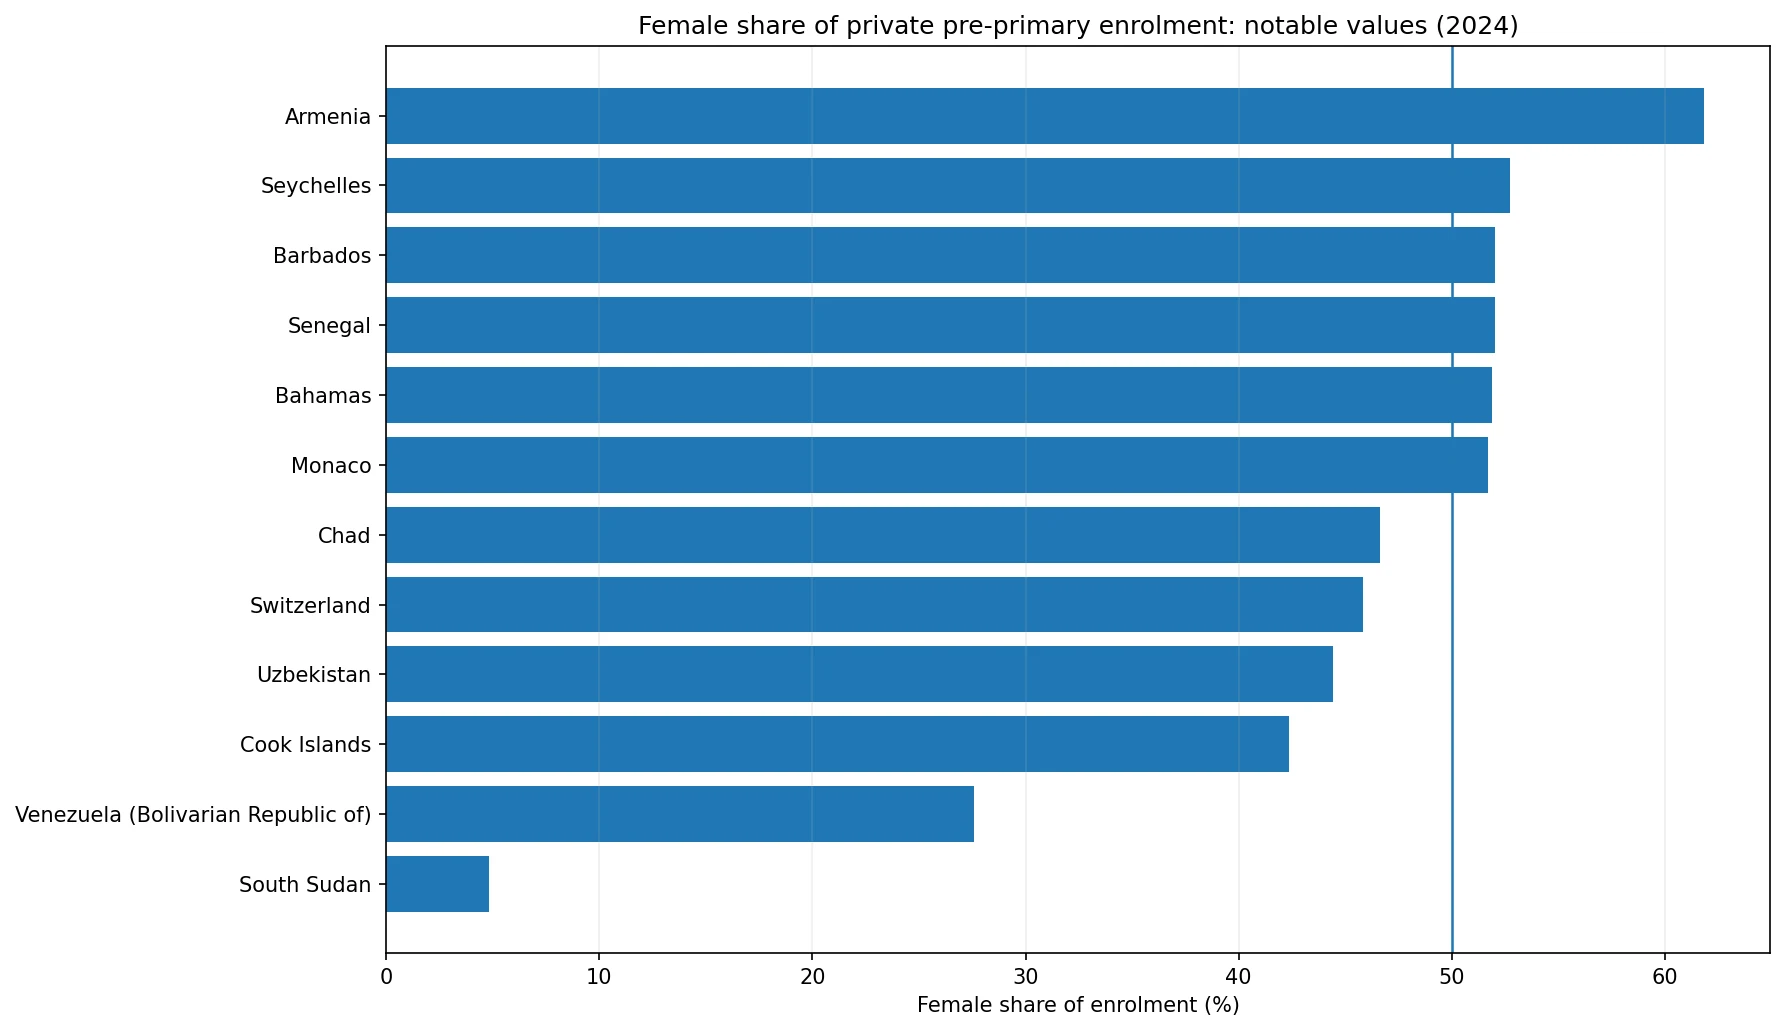
Table of Contents
What the indicator measures
A value of 49% means that females account for about 49% of enrolment in private pre-primary education in that country or territory. It should not be rewritten as “49% of girls are enrolled privately,” because that would use a different denominator. To answer the latter question, an analyst would need the number of girls in private pre-primary education divided by a population or enrolment total for girls. ETOIP.02.PR.F instead focuses on who makes up the enrolment within private institutions.
The 50% line is therefore a useful descriptive reference. Values above it indicate that females make up the larger share of private pre-primary enrolment, while values below it indicate that males make up the larger share. Yet 50% should not be treated as an automatic measure of equal access or equal opportunity. Population sex ratios, participation rates, institutional coverage and data-reporting practices can all affect the composition. Small deviations around 50% should be read cautiously.
Most observations are close to a balanced composition
65 observations are below 50% and 15 are above it. That looks asymmetric if only the counts are considered, but many of the below-50 values are just slightly below the reference line. The middle half of observations lies between 48.30% and 49.76%, an unusually narrow band for a cross-country dataset. This is why a simple count of countries on each side of 50% can be less informative than the distance from 50%.
The mean, 48.31%, is lower than the median, 48.94%, because a few very low observations pull the average downward. South Sudan at 4.82% and Venezuela at 27.58% are particularly influential in that respect. For a dataset with strong outliers, the median better describes a typical reported observation. The mean remains useful, but only when read alongside the shape of the distribution.
The highest and lowest reported shares
Armenia records the highest value in the 2024 extract at 61.84%. It is followed by Seychelles at 52.74%, Barbados at 52.03%, Senegal at 52.01%, the Bahamas at 51.88% and Monaco at 51.69%. Armenia is clearly separated from the rest of the upper group. Most other high values remain only a few percentage points above 50%, so ranking them should not be mistaken for evidence of large gender gaps.
At the lower end, South Sudan reports 4.82%, Venezuela 27.58%, the Cook Islands 42.37%, Uzbekistan 44.45%, Switzerland 45.83% and Chad 46.62%. The first two are far outside the dense central cluster. These reported values show that the observations are unusual, but they do not explain why. Explaining them would require country-specific documentation, enrolment counts, institutional definitions and preferably a time series.
| Country or territory | Year | Female share |
|---|---|---|
| Armenia | 2024 | 61.84% |
| Seychelles | 2024 | 52.74% |
| Barbados | 2024 | 52.03% |
| Senegal | 2024 | 52.01% |
| Bahamas | 2024 | 51.88% |
| Monaco | 2024 | 51.69% |
| South Sudan | 2024 | 4.82% |
| Venezuela (Bolivarian Republic of) | 2024 | 27.58% |
| Cook Islands | 2024 | 42.37% |
| Uzbekistan | 2024 | 44.45% |
| Switzerland | 2024 | 45.83% |
| Chad | 2024 | 46.62% |
Why rank position is less useful than distance from 50%
A country at 50.7% and another at 49.3% sit on opposite sides of the reference line, but both are close to a balanced composition. A strict ranking gives them different positions while obscuring how similar they are in substantive terms. For this indicator, grouping values by distance from 50% is often more meaningful than assigning significance to every rank. The fact that 60 of 80 observations fall between 48% and 52% is therefore more informative than the exact ordering of countries inside that band.
Large departures from 50% deserve more attention, but even there the indicator is descriptive rather than causal. A high female share does not automatically mean that girls have better overall access to pre-primary education, and a low share does not prove discrimination. The private sector could represent a small or large part of the national pre-primary system. Without knowing the size of that sector and the overall participation of girls and boys, the composition inside private institutions cannot stand in for national access.
Outliers should be checked, not explained away
The South Sudan and Venezuela observations are important precisely because they differ so much from the rest of the distribution. Good data practice is to preserve those official values rather than replace them with an assumed value or silently exclude them. At the same time, they should be labeled as unusual observations that may warrant additional verification. A single cross-section cannot distinguish between a real enrolment pattern, a narrow reporting universe, classification differences or other data-quality issues.
Missing observations should be kept separate from true zero values. A zero would indicate that the reported female share for the relevant private pre-primary enrolment was actually 0%, while a country with no 2024 value simply has no reported observation for this indicator in the available data. Countries without a reported value should therefore remain unclassified rather than being shown as 0% in charts, maps or comparisons.
The 80 observations are not a world average
The 2024 data do not cover every country and territory. Several large education systems are not represented. For that reason, the mean and median describe only the 80 countries and territories with reported observations and should not be presented as a global average. The included systems are also not weighted by population or enrolment size, so these summary statistics describe the distribution of country-level values rather than the share of all children worldwide.
A simple cross-country average also gives a small territory the same numerical weight as a large country. That can be appropriate when the question is about the distribution of country-level indicators, but it is not an estimate of the share of all children worldwide. Producing a global child-level percentage would require female and total enrolment counts for each system and an aggregation based on those counts.
What is needed to assess access and gender equity
If the policy question is whether girls and boys have equal access to pre-primary education, this indicator should be combined with participation measures. Gross or net enrolment rates by sex, population in the relevant age range, public-private enrolment shares, geographic access and household-level barriers would provide a fuller picture. A private-sector composition near 50% can coexist with low overall participation, just as a composition several points away from 50% can coexist with high national enrolment.
It is also useful to distinguish composition from scale. Suppose private institutions account for 10% of national pre-primary enrolment in one country and 70% in another. The same 48% female share would describe a much larger part of the national system in the second case. Without the private-sector share, the current indicator cannot tell the reader how much of the total education system the measured composition represents.
How to read the 2024 pattern
The strongest evidence from the 2024 data is concentration near parity: a median of 48.94%, 60 observations between 48% and 52%, and 75 between 45% and 55%. That pattern suggests that most reported private pre-primary systems have a female share close to half of enrolment. Armenia is a notable high-side exception, while South Sudan and Venezuela are much farther below the center than the rest of the lower group.
Those facts are sufficient for a careful descriptive conclusion. They are not sufficient to identify causes, evaluate national policy quality, or rank systems by fairness. The most responsible use of the indicator is to identify where the sex composition is close to balance and where an observation is unusual enough to justify follow-up with additional official evidence.
Source and interpretation limits
The data come from the UNESCO Institute for Statistics indicator ETOIP.02.PR.F, reported in percent for 2024. The published values are used directly, without estimating values for countries and territories that do not have a reported observation. Missing entries are kept separate from true zero values.
A time series would add an important next layer. If an unusual value persists over several years, that would be different from a one-year break. Similarly, pairing the female share with total private pre-primary enrolment and the private share of all pre-primary enrolment would separate changes in composition from changes in the scale of the private sector. Those additions would turn a useful snapshot into a more complete account of enrolment structure.
Frequently Asked Questions
What does 50% mean in this indicator?
It means females account for about half of enrolment in private pre-primary institutions. It does not mean that half of all girls attend private institutions.
Is the average of the 80 observations a global average?
No. It is an unweighted average of the 80 countries and territories with reported 2024 observations, not a population- or enrolment-weighted world estimate.
Should countries with no reported value be treated as 0%?
No. Missing data and a true zero are different. Jurisdictions without a reported 2024 observation should remain missing.
Related Articles
Green Map creates custom-edited map images using open geographic data sources such as geoBoundaries, Natural Earth, OpenStreetMap, and government open data. These maps are edited visual materials, not raw data files, and are provided for education, documents, presentations, and graphic reference.