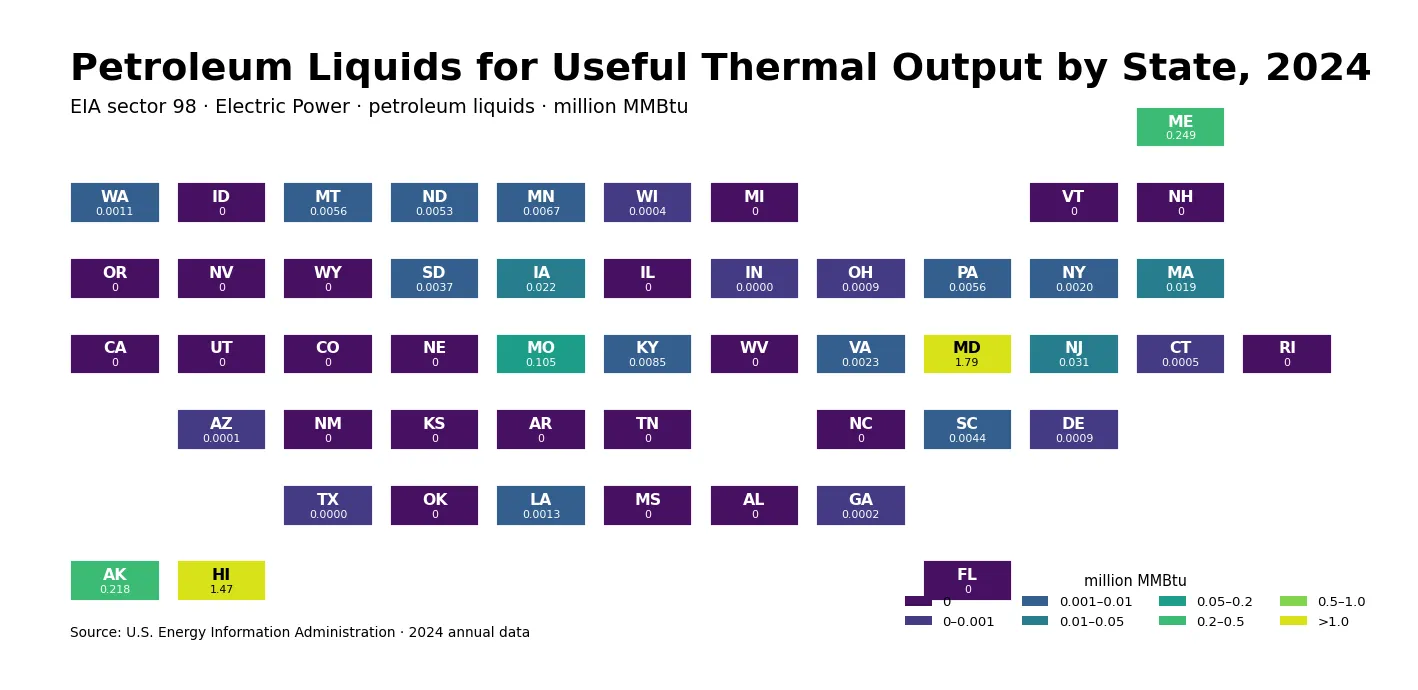
In the 2024 U.S. Energy Information Administration state series, petroleum under fuel facet PET recorded 67.13039 thousand barrels of consumption for useful thermal output across the 50 states. Only 13 states had positive values, while 37 states were reported as exactly zero. Alaska led with 38.828 thousand barrels, Missouri followed with 18.097, and Iowa ranked third at 3.889.
The distribution is exceptionally concentrated. Alaska and Missouri together account for 84.8% of the 50-state sum. The arithmetic mean is 1.34261 thousand barrels per state, but the median is 0.0. With more than half of the states at zero, the mean is not a good description of a typical state observation.
The data identity matters because this is the PET petroleum series, using EIA field consumption-uto and sector facet 90. A closely related series on the site uses fuel facet PEL for petroleum liquids. Many state values overlap, but the two series should not be treated as interchangeable. Wisconsin is a clear example: this PET series reports 1.210 thousand barrels, changing the ranking and the 50-state total.
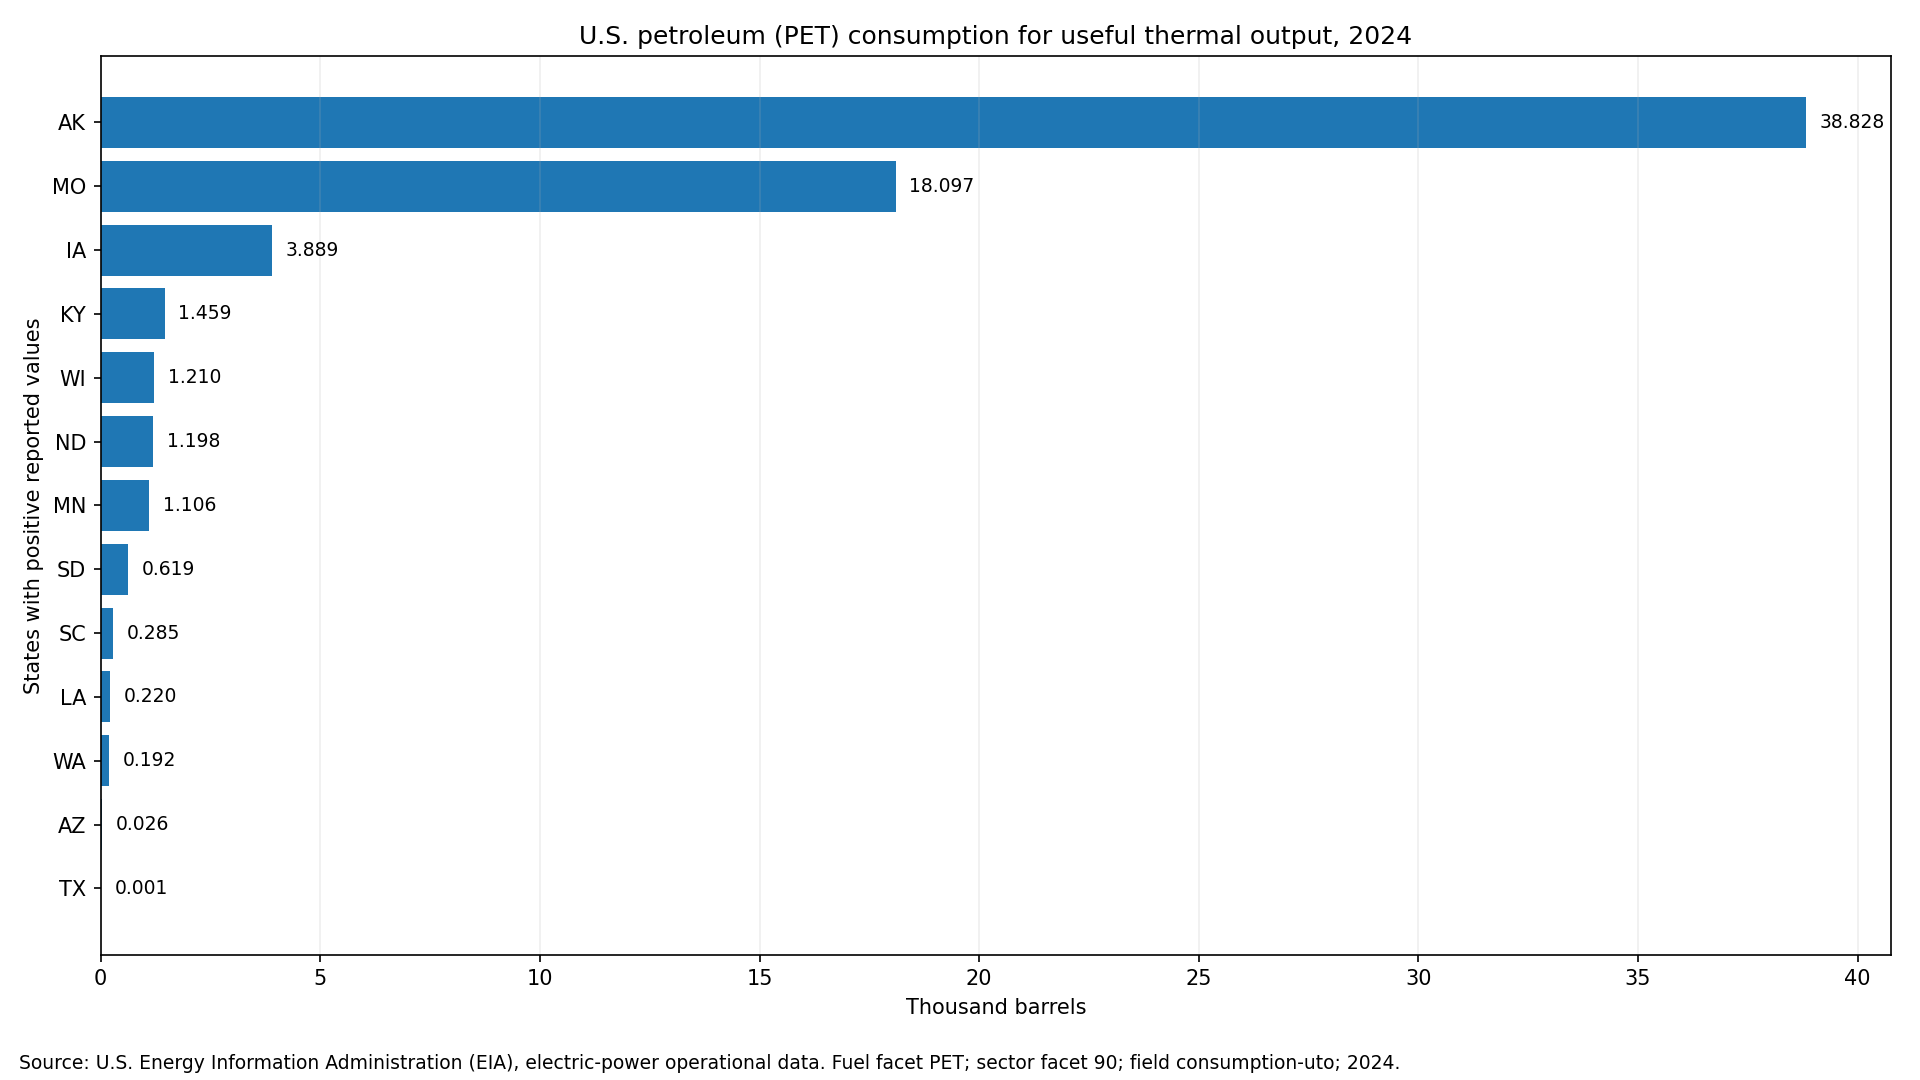
Table of Contents
Alaska and Missouri dominated the state total
Alaska alone represents 57.8% of the state sum, and Missouri contributes another 27.0%. Together they reach 84.8%. Adding Iowa lifts the top-three share to 90.6%. This is a long-tailed distribution rather than a gradual state ranking.
Kentucky ranked fourth at 1.459 thousand barrels and Wisconsin fifth at 1.210. The top five states account for 94.6% of the total, while the top ten reach 99.67%. The remaining positive observations are individually small compared with Alaska and Missouri.
| Rank | State | Code | Thousand barrels |
|---|---|---|---|
| 1 | Alaska | AK | 38.82800 |
| 2 | Missouri | MO | 18.09700 |
| 3 | Iowa | IA | 3.88900 |
| 4 | Kentucky | KY | 1.45900 |
| 5 | Wisconsin | WI | 1.21000 |
| 6 | North Dakota | ND | 1.19839 |
| 7 | Minnesota | MN | 1.10600 |
| 8 | South Dakota | SD | 0.61900 |
| 9 | South Carolina | SC | 0.28500 |
| 10 | Louisiana | LA | 0.22000 |
| 11 | Washington | WA | 0.19200 |
| 12 | Arizona | AZ | 0.02600 |
| 13 | Texas | TX | 0.00100 |
Only 13 states had positive values
The positive-value states were Alaska, Missouri, Iowa, Kentucky, Wisconsin, North Dakota, Minnesota, South Dakota, South Carolina, Louisiana, Washington, Arizona, and Texas. Texas was only 0.001 thousand barrels, but it is still a positive observation. Preserving that small value matters because it is statistically different from the exact zeros in the source.
The 37 zeros are also not missing values. All 50 state rows contain numeric observations for 2024. A zero therefore means the source reported zero for this exact combination of year, fuel facet, sector facet, and useful-thermal-output field. It should not be interpreted as no petroleum use of any kind in the state.
PET and PEL are related but not identical fuel series
EIA operational data contain several closely named petroleum categories. This article keeps fueltypeid PET as the defining fuel identity. A related article uses PEL for petroleum liquids. Similar labels and overlapping state values can make the two look like duplicate series, but the differing facet code means their totals and some state observations can diverge.
Wisconsin illustrates the difference. It is 1.210 thousand barrels in the PET data used here, high enough to rank fifth. The related PEL series uses a smaller Wisconsin value. For reproducible analysis, the fuel code, sector code, metric field, year, and unit all need to remain fixed. Copying rankings between nearby series can create a factual error even when most states happen to match.
Useful-thermal-output consumption is a narrow energy measure
This series is not total state petroleum consumption. It does not include transportation fuel demand, refinery throughput, every industrial use of petroleum, or all petroleum burned for electricity generation. It is one operational-data slice tied to EIA’s useful-thermal-output consumption field.
For the same reason, a high value is not a petroleum-dependence score. Alaska’s first-place value does not establish that Alaska has the highest petroleum share in its overall energy or electricity system. A question about dependence would require a denominator such as total generation, total fuel input, electricity sales, or statewide energy consumption.
Why concentration is more informative than the average
The unweighted mean of 1.34261 thousand barrels is obtained by dividing the 50-state sum by 50. But 37 zero observations and a top-two share of 84.8% make the mean highly sensitive to the largest states in this series. The median of zero more directly captures the fact that a typical position in the ordered state distribution is zero.
The top ten states account for 99.67% of the total. A linear chart therefore compresses Arizona and Texas near the axis. Those small values should still remain visible in a data table because they distinguish a measured positive quantity from an exact zero. Removing them would alter both the count of positive states and the shape of the distribution.
The state ranking does not identify causes
The values describe where the reported physical quantity was recorded, not why. Plant configuration, operating hours, fuel availability, thermal demand, and facility-level reporting could all affect state totals. This dataset does not contain those explanatory variables, so the large Alaska and Missouri observations should not be assigned a single cause from the state table alone.
The data also cover only one year. Because all 50 observations are from 2024, the cross-state comparison is temporally consistent, but no year-over-year growth rate can be calculated from this file. A trend analysis would require the same PET, sector 90, consumption-uto series for additional years.
Source and calculation notes
The source is the U.S. Energy Information Administration Electric Power Operational Data API. The fixed identity is 2024, fueltypeid PET, sectorid 90, field consumption-uto, and unit thousand barrels. The analysis uses all 50 reported state values and calculates the sum, mean, median, positive-count, and concentration shares directly without imputation. The official EIA API query reflects the same series identity.
The PET series is intentionally kept separate from the related PEL petroleum-liquids series. When comparing related posts, the facet code and unit are more reliable identifiers than a similar public title. That distinction also helps prevent near-duplicate statistics from being silently substituted for one another.
Frequently Asked Questions
Which state had the highest PET petroleum consumption for useful thermal output in 2024?
Alaska ranked first at 38.828 thousand barrels, followed by Missouri at 18.097 and Iowa at 3.889.
Do the 37 zero values mean missing data?
No. All 50 states have numeric 2024 observations. The 37 zeros are reported values for this exact EIA series.
Is PET the same as the PEL petroleum-liquids series?
No. They are closely related petroleum series with different fuel facet codes, and some state values and totals differ.
Related Articles
Green Map creates custom-edited map images using open geographic data sources such as geoBoundaries, Natural Earth, OpenStreetMap, and government open data. These maps are edited visual materials, not raw data files, and are provided for education, documents, presentations, and graphic reference.