Eurostat reports 2025 values for 31 European countries on the share of enterprises using machine learning, including deep learning, for data analysis. The business population is limited to enterprises with at least 10 persons employed, and the unit is percent of enterprises. A value of 10% therefore means that roughly one in ten enterprises within the survey scope reported using machine learning for data analysis. It does not mean that 10% of workers use the technology, and it should not be extended to micro-enterprises that are outside the stated size threshold.
Finland recorded the highest value at 12.85%, followed very closely by Denmark at 12.75% and Belgium at 11.15%. The median across the 31 observations was 4.62%, while the mean was 5.46%. Only 3 countries reached at least 10%, whereas 8 were below 3%. The maximum was about 8.3 times the minimum, showing a wide spread despite the common year, unit, and indicator definition.
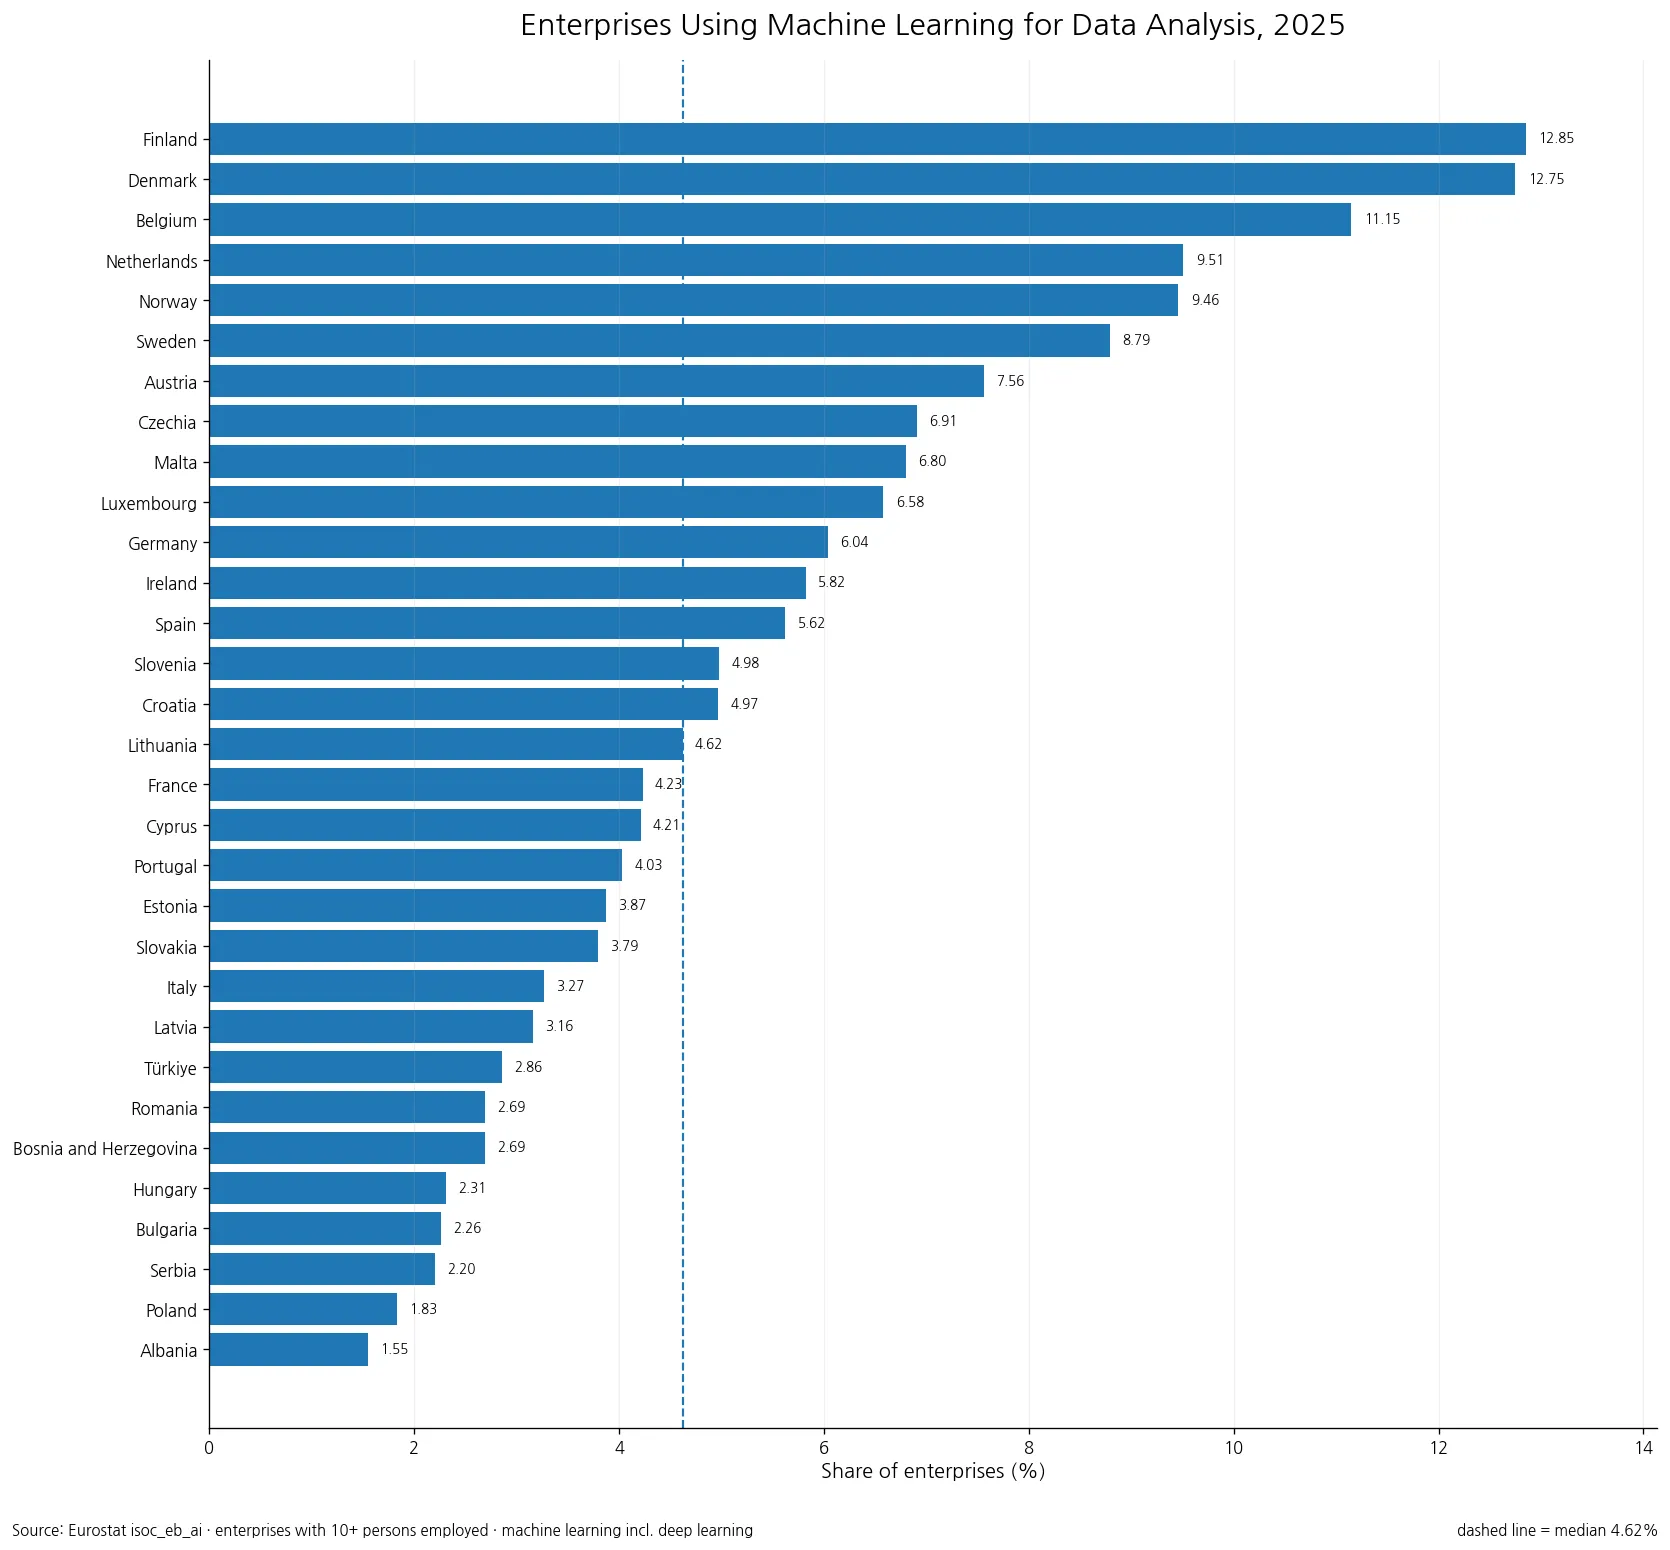
Table of Contents
What exactly does this Eurostat indicator measure?
The Eurostat E_AI_TML indicator is narrower than a general measure of artificial-intelligence adoption. It asks whether an enterprise uses machine learning, including deep learning, for data analysis. An enterprise may use another AI technology—such as speech recognition, natural-language processing, image recognition, or generative AI—without being counted here if machine learning is not being used for the stated analytical purpose. Conversely, firms using predictive, classification, or deep-learning models in analytical tasks can fall within this category.
The population boundary also matters. The series refers to enterprises with 10 or more persons employed and follows the industry coverage of Eurostat’s enterprise ICT statistics. It is therefore best interpreted as a standardized comparison of machine-learning diffusion among the covered business population, not as a complete census of every organization or every form of AI activity in an economy.
Only three countries were above 10%, while most were below 5%
Of the 31 countries, 13 had values of 5% or more and 18 were below 5%. That means more than half of the observed countries had fewer than one in twenty covered enterprises reporting machine learning for data analysis. Finland, Denmark, and Belgium were the only 3 countries at or above 10%. The gap between Finland and Denmark was just 0.10 percentage points, but the gap between third-ranked Belgium and the Netherlands in fourth place was 1.64 points.
| Country | Enterprises (%) |
|---|---|
| Finland | 12.85 |
| Denmark | 12.75 |
| Belgium | 11.15 |
| Netherlands | 9.51 |
| Norway | 9.46 |
| Sweden | 8.79 |
| Austria | 7.56 |
| Czechia | 6.91 |
| Malta | 6.80 |
| Luxembourg | 6.58 |
Several northern European observations were clustered near the top. Finland and Denmark were both above 12%, Norway stood at 9.46%, and Sweden at 8.79%. This pattern is descriptive rather than causal. The dataset alone does not show whether differences are driven by industry structure, firm size composition, data infrastructure, specialized labor, investment, management practices, regulation, or other factors. It records the prevalence of a particular technology-use case in 2025.
The median of 4.62% is a better guide to the middle of the distribution
The mean of 5.46% was higher than the median of 4.62%, because the values around 9–13% at the upper end pulled the arithmetic average upward. The first quartile was 3.01% and the third quartile 6.86%, so the middle half of countries fell roughly between those two values. The standard deviation was 3.15 percentage points. Looking at the median and quartiles alongside the mean gives a clearer picture of a distribution that is not centered symmetrically.
Lithuania sat exactly at the median with 4.62%. France at 4.23%, Cyprus at 4.21%, and Portugal at 4.03% were somewhat below it, while Slovenia at 4.98% and Croatia at 4.97% were somewhat above. Countries around the middle were separated by relatively small differences, whereas the distance widened toward both tails. This is one reason why a ranking alone can exaggerate small distinctions between neighboring values.
Eight countries were below 3%
8 of the 31 observations were below 3%. Albania was lowest at 1.55%, followed by Poland at 1.83%, Serbia at 2.20%, Bulgaria at 2.26%, and Hungary at 2.31%. Romania and Bosnia and Herzegovina were both at 2.69%, while Türkiye was at 2.86%. These numbers indicate that reported use of machine learning for data analysis remained relatively uncommon among enterprises in the survey scope in those countries in 2025.
| Country | Enterprises (%) |
|---|---|
| Albania | 1.55 |
| Poland | 1.83 |
| Serbia | 2.20 |
| Bulgaria | 2.26 |
| Hungary | 2.31 |
| Bosnia and Herzegovina | 2.69 |
| Romania | 2.69 |
| Türkiye | 2.86 |
| Latvia | 3.16 |
| Italy | 3.27 |
A low value should not be interpreted as “no AI use.” Enterprises may be using other AI tools, may apply machine learning to a different function, or may not classify their internal technology in the same way as the survey category. The indicator provides a deliberately specific lens. It is useful precisely because it isolates one technology-and-purpose combination, but that specificity also limits what can be inferred from it.
Machine-learning use is not the same as overall AI adoption
Several enterprise AI indicators can look similar at first glance. The share of enterprises using any AI technology, the share using AI for data analysis, and the share using machine learning for data analysis answer different questions. The first has the broadest technology scope. The current indicator is narrower because it requires both a specific technology—machine learning—and a specific purpose—data analysis.
This distinction explains why a country can have a substantially different value on another AI indicator without any inconsistency. A firm that uses generative AI to draft text but does not use machine learning in data-analysis processes can count in a broad AI measure while remaining outside this one. Comparisons across indicators should therefore align the numerator definition, enterprise-size threshold, industry coverage, year, and unit before drawing conclusions.
Higher adoption does not automatically mean higher productivity
A higher percentage of enterprises using machine learning does not by itself establish that an economy has higher productivity or that adopting firms receive larger returns. The indicator records whether the technology is used, not how intensively it is used, how accurate the models are, which decisions they support, or whether they reduce costs and raise output. Connecting adoption to economic performance requires enterprise-level evidence on investment, skills, sector, output, and productivity.
The reverse caution also applies. A country with a low national adoption rate may still contain a small group of highly advanced firms using sophisticated machine-learning systems. A country average compresses the entire firm distribution into one percentage. This measure is therefore much closer to a question of how widely a technology has diffused than to a question of how effectively it is used.
One year cannot reveal the speed of diffusion
All observations in this comparison refer to 2025, which makes the cross-country comparison clean but leaves no direct information about momentum. A country at 6% could be growing rapidly from a low base or could have remained around that level for several years. To study diffusion speed, the same E_AI_TML series should be followed across earlier and later years and compared using percentage-point changes as well as changes in rank.
A time-series analysis should also verify continuity in definitions. Survey wording, technology categories, and business coverage can evolve even when a statistical series appears similar. The safest interpretation is to compare years over which the metadata confirms a sufficiently consistent definition and to flag breaks rather than converting them into artificial jumps.
What the 2025 distribution tells us
Three points stand out. First, machine learning for data analysis was not yet widespread across the typical country in this set: the median was 4.62%, and 18 countries were below 5%. Second, the cross-country spread was large, with 11.30 percentage points between Finland at the top and Albania at the bottom. Third, this is a targeted adoption indicator. It should not be treated as a complete score of national AI capability, digitalization, or economic performance.
The most useful next comparisons would connect this series to other enterprise AI technologies and to multiple years. A technology-by-technology view can show whether machine learning is a leading or lagging component of AI adoption within each country, while a time series can show whether the gaps are narrowing or widening. The 2025 snapshot provides a strong baseline because all 31 observations share the same year and a clearly defined business population.
Frequently Asked Questions
What does the machine-learning enterprise share measure?
It is the percentage of enterprises with 10 or more persons employed that report using machine learning, including deep learning, for data analysis. It is narrower than overall AI adoption.
Which country had the highest value in 2025?
Finland was highest at 12.85%, followed by Denmark at 12.75% and Belgium at 11.15%.
What was the median across the 31 countries?
The median was 4.62%. The middle half of observations fell roughly between 3.01% and 6.86%.
Related Articles
Green Map creates custom-edited map images using open geographic data sources such as geoBoundaries, Natural Earth, OpenStreetMap, and government open data. These maps are edited visual materials, not raw data files, and are provided for education, documents, presentations, and graphic reference.