Average heat content for distillate fuel oil consumed in the U.S. Electric Power Sector Non-CHP varied only modestly across the 50 states in 2025. Oklahoma recorded the highest value at 5.9708, followed by Montana at 5.9173 and Maryland at 5.9166. At the other end, Alaska was lowest at 5.5588 and Colorado was next at 5.6015. The comparison is about the energy content of the fuel being consumed, not the volume of fuel burned or the amount of electricity generated.
The series is defined for distillate fuel oil in the Electric Power Sector Non-CHP and covers one annual observation for each state in 2025. The unit shown for the series is Btu per short tons. The values are compared as reported, without filling missing observations or combining them with other sectors. Heat content is a property of the fuel: a higher value means more heat energy per stated physical unit, but it does not by itself indicate higher generation, greater fuel consumption, or better plant efficiency.
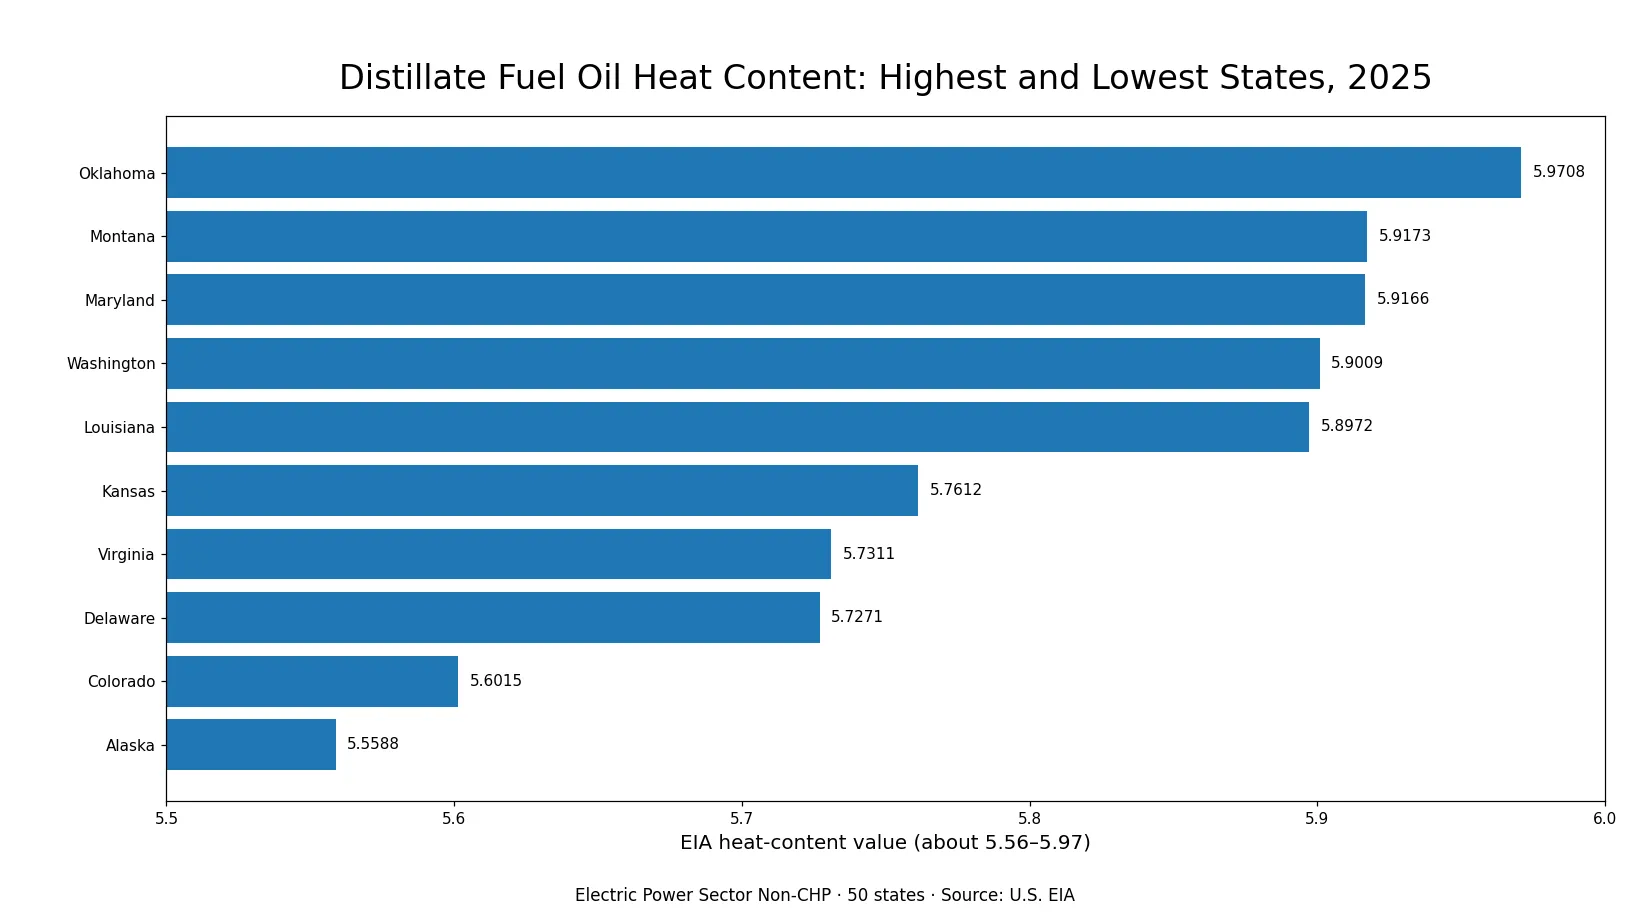
Table of Contents
Oklahoma was highest, but most states were tightly clustered
Oklahoma’s 5.9708 was the maximum among the 50 states. Montana and Maryland were nearly tied at 5.9173 and 5.9166, a difference of only 0.0007. Washington followed at 5.9009 and Louisiana at 5.8972. Even near the top of the ranking, several states were separated by only a few thousandths.
Across all states, the mean was 5.8048 and the median was 5.7981. The two measures are close, suggesting that the center of the distribution was not strongly pulled to one side. The first quartile was 5.7779 and the third quartile was 5.8306, so the middle half of states occupied a band only about 0.0527 wide. Ranking positions therefore look more dramatic than many of the underlying numerical differences.
The top ten ranged from 5.8374 to 5.9708
| Rank | State | 2025 value |
|---|---|---|
| 1 | Oklahoma | 5.9708 |
| 2 | Montana | 5.9173 |
| 3 | Maryland | 5.9166 |
| 4 | Washington | 5.9009 |
| 5 | Louisiana | 5.8972 |
| 6 | Arkansas | 5.8890 |
| 7 | South Dakota | 5.8885 |
| 8 | Idaho | 5.8800 |
| 9 | California | 5.8788 |
| 10 | Nevada | 5.8374 |
The ten highest values were in Oklahoma, Montana, Maryland, Washington, Louisiana, Arkansas, South Dakota, Idaho, California, and Nevada. Nevada, tenth at 5.8374, was only slightly above the national state mean. Texas was eleventh at 5.8316, while South Carolina and Wisconsin both recorded 5.8309.
The high-value group is geographically mixed. It includes southern states such as Oklahoma, Louisiana, and Arkansas; western states such as Montana, Washington, Idaho, California, and Nevada; and Maryland in the East. That mix means the one-year ranking should not be reduced to a simple regional explanation. Establishing why fuel heat content differs would require separate evidence about fuel sourcing, product characteristics, plant operations, and the composition of the fuel consumed.
Thirty-seven states were within 1% of the mean
The narrow spread is especially clear when the values are compared with the mean. Thirty-seven of the 50 states fell within plus or minus 1% of the 5.8048 mean. Expanding the band to plus or minus 2% captured 47 states. Most states therefore had average heat-content values that were very close to one another.
Iowa at 5.7987, Arizona at 5.7975, Connecticut at 5.7954, Illinois at 5.7934, and Vermont at 5.7931 illustrate how dense the middle of the distribution was. A difference of several ranking places can correspond to a very small absolute difference. For this metric, the value itself is more informative than rank alone.
Alaska and Colorado stood out at the lower end
| State | 2025 value |
|---|---|
| Alaska | 5.5588 |
| Colorado | 5.6015 |
| Delaware | 5.7271 |
| Virginia | 5.7311 |
| Kansas | 5.7612 |
| Tennessee | 5.7620 |
| Indiana | 5.7629 |
| Hawaii | 5.7652 |
| New Mexico | 5.7731 |
| New York | 5.7732 |
Alaska and Colorado were visibly separated from most of the lower half. Alaska recorded 5.5588 and Colorado 5.6015. Delaware was the next-lowest at 5.7271, followed by Virginia at 5.7311. Kansas, Tennessee, Indiana, Hawaii, New Mexico, and New York completed the bottom ten.
The difference between the maximum and minimum was 0.4120. Relative to the mean, that range was about 7.1%. This is large enough to identify the two endpoints clearly, but it is still consistent with a distribution in which most states are packed around 5.8. The data establish the size of the difference; they do not establish the reason for it.
Heat content is not a fuel-consumption ranking
Average heat content describes the amount of heat energy associated with a stated physical unit of fuel. Oklahoma ranking first does not mean Oklahoma consumed the most distillate fuel oil, and Alaska ranking last does not mean Alaska consumed the least. A consumption comparison would require a physical-unit or Btu-total consumption series. Likewise, a generation comparison would require net-generation data.
The distinction matters because EIA electricity tables contain several measures that can appear similar in search results. Average heat content, total fuel consumption, and net generation answer different questions. The first describes fuel characteristics, the second describes how much fuel was used, and the third describes how much electricity was produced. Comparing states correctly requires keeping the metric, sector, fuel type, unit, and year aligned.
Why the Non-CHP scope matters
This series is limited to the Electric Power Sector Non-CHP. Combined heat and power plants produce both electricity and useful thermal output, while non-CHP facilities are organized around electricity generation without that paired useful-heat output. Separating the two groups helps keep the fuel-use context consistent when comparing heat-content observations.
The result should therefore not be treated as the average heat content for every use of distillate fuel oil in a state. CHP plants, commercial or industrial uses outside this sector, and other petroleum products belong to different statistical scopes. A series with a different sector or fuel facet can produce a different state ordering even when the year is the same.
A single year cannot show a trend
Every observation in this comparison is for 2025. One cross-section cannot show whether Oklahoma has been rising, whether Alaska has been falling, or whether state differences are widening over time. Those questions require repeated observations from the same series, with the same sector, fuel definition, and unit.
The 2025 distribution can still serve as a baseline. When additional years are available, the same summary measures can be recalculated: the mean, median, interquartile range, maximum-minimum gap, and the number of states close to the mean. Tracking those measures would show whether the state distribution is becoming more uniform or more dispersed without relying on rank changes alone.
How to interpret the 2025 state comparison
Three points keep the interpretation precise. First, this is average heat content of distillate fuel oil, not total consumption. Second, the scope is the Electric Power Sector Non-CHP across the 50 states. Third, the series unit is Btu per short tons. The source is the U.S. Energy Information Administration Open Data system, and the article compares the annual state observations on a like-for-like basis.
The main pattern is not a dramatic state divide. Oklahoma was highest and Alaska lowest, but the great majority of states were concentrated near 5.8. That makes this series most useful for identifying small differences in fuel heat content and a few edge cases, rather than for describing large differences in electricity production or fuel use.
Frequently Asked Questions
Which state had the highest distillate fuel oil average heat content in 2025?
Oklahoma was highest at 5.9708 in the Electric Power Sector Non-CHP series, followed by Montana at 5.9173 and Maryland at 5.9166.
Which state had the lowest value?
Alaska was lowest at 5.5588, followed by Colorado at 5.6015.
Does this ranking show which states consumed the most distillate fuel oil?
No. Average heat content describes an energy characteristic of the fuel. Fuel consumption and net electricity generation are separate measures.
Related Articles
Green Map creates custom-edited map images using open geographic data sources such as geoBoundaries, Natural Earth, OpenStreetMap, and government open data. These maps are edited visual materials, not raw data files, and are provided for education, documents, presentations, and graphic reference.