Natural gas and other gases consumed for useful thermal output are highly concentrated in a small number of U.S. states. In the U.S. Energy Information Administration’s 2024 Electric Power Operations data, the 50 states and the District of Columbia total 1,493.66 million MMBtu for `consumption-uto-btu`, fuel category NGO, and sectorid=99. Texas is by far the largest observation at 463.17 million MMBtu, or 31.01% of the 51-jurisdiction total. Louisiana ranks second at 200.65 million MMBtu, or 13.43%.
This measure is not ordinary statewide natural-gas consumption and it is not fuel used only for electricity generation. The field is tied to useful thermal output: heat that is productively used, often in combined heat and power or related thermal applications. The unit is million MMBtu, so the ranking compares absolute thermal-energy input associated with that useful-heat measure.
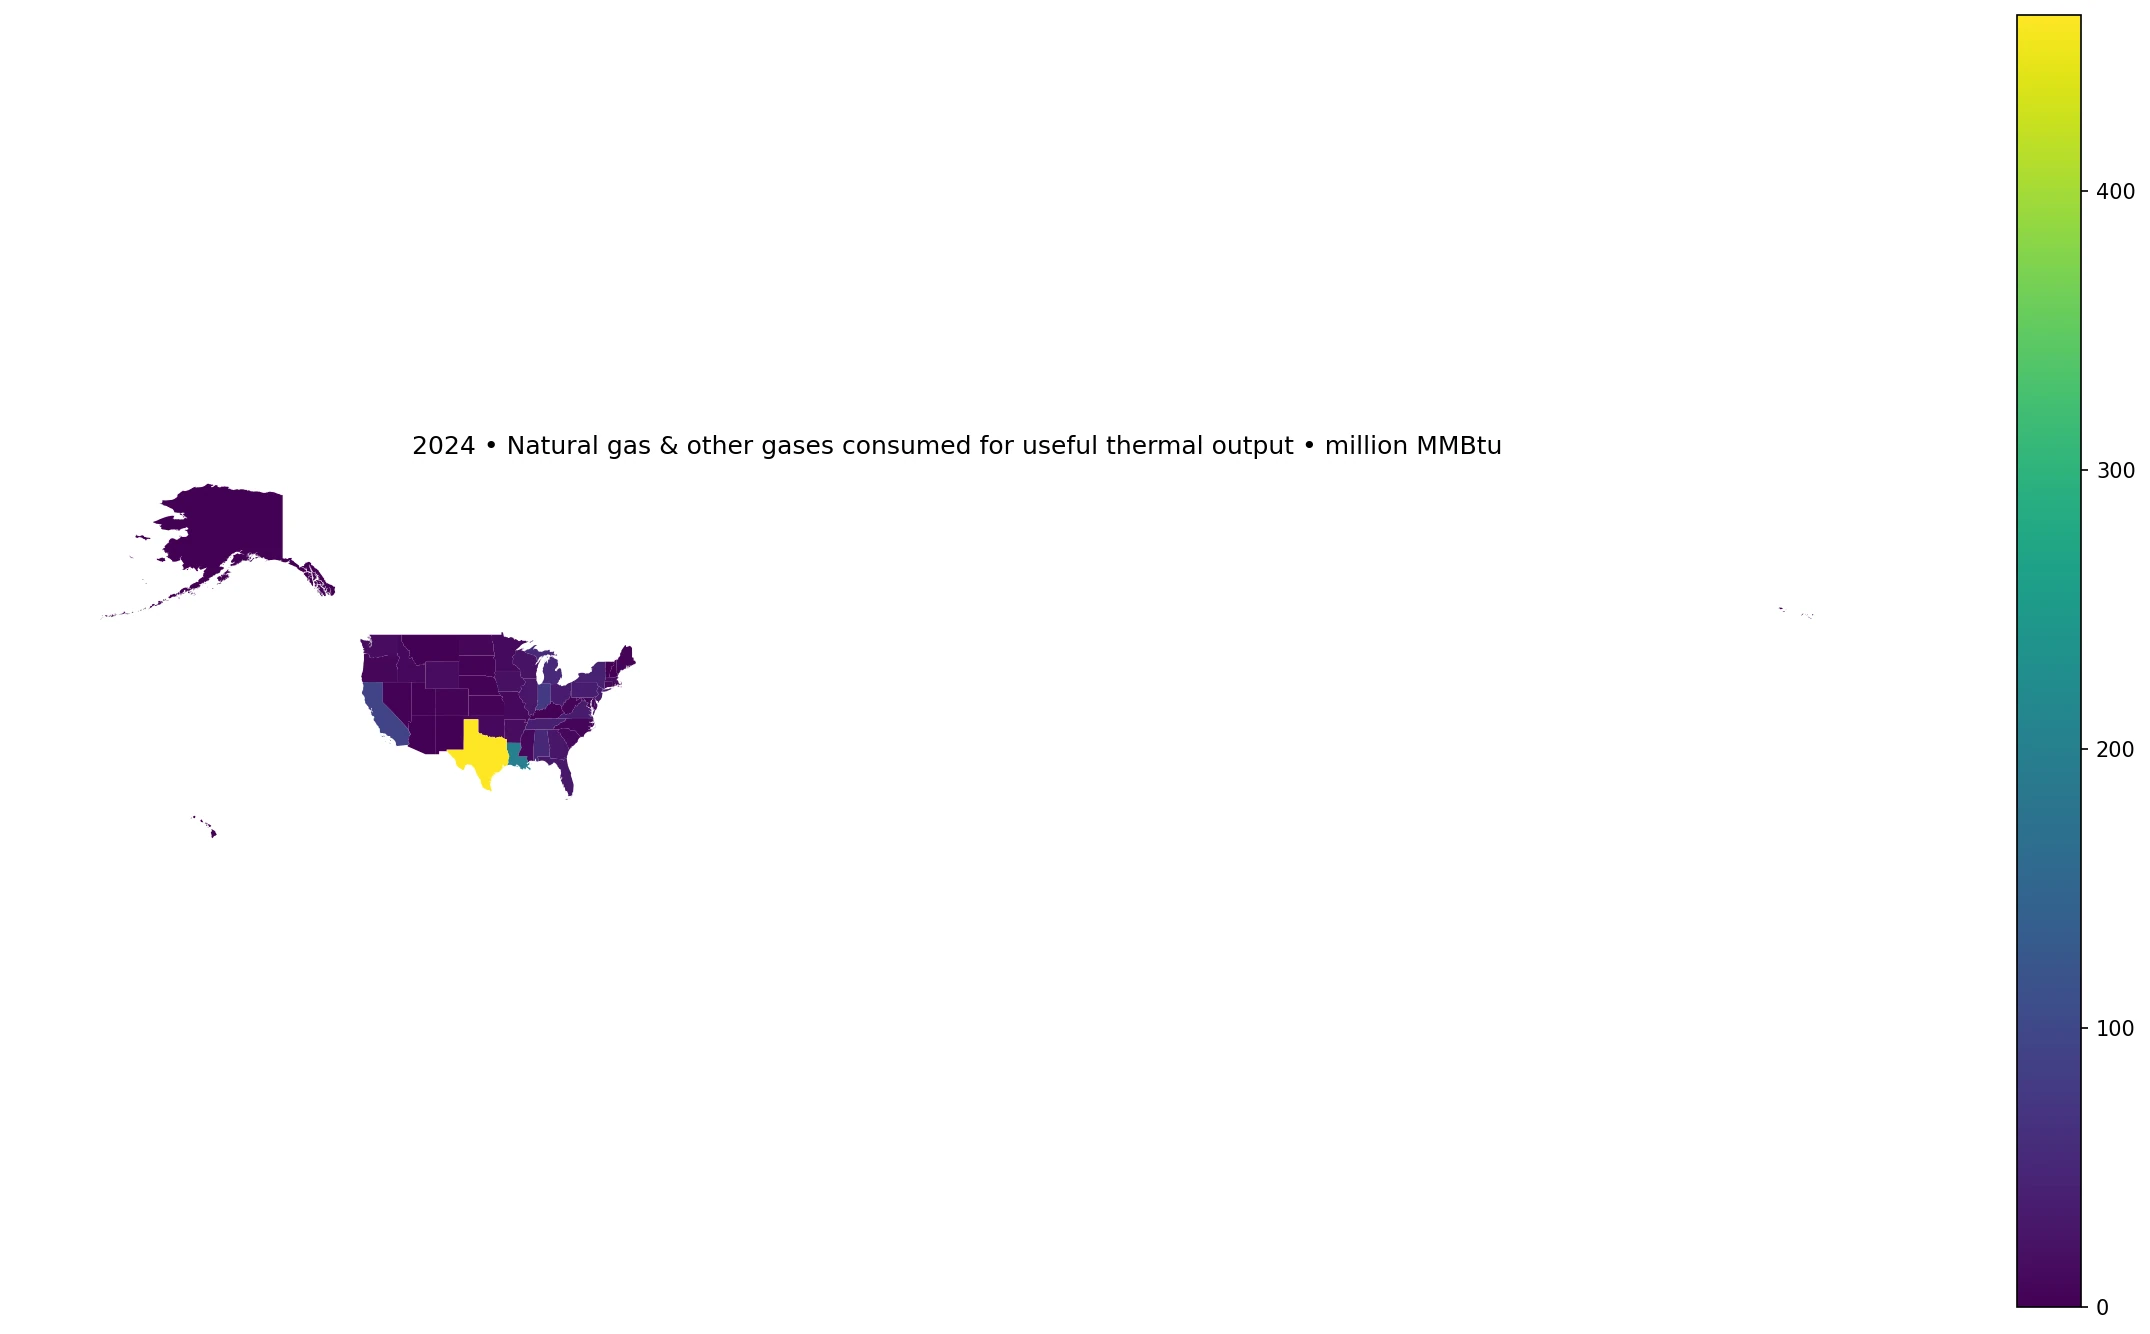
Table of Contents
The 51-jurisdiction total is 1,493.66 million MMBtu
The mean is 29.29 million MMBtu, but the median is only 10.19 million MMBtu. The average is therefore almost three times the median, a clear sign that a few very large observations pull the distribution upward. The first quartile is 2.82 million MMBtu and the third quartile is 28.35, placing the middle half of states in a relatively narrow band compared with the full range.
Only Texas and Louisiana exceed 100 million MMBtu. Six states reach at least 50 million MMBtu, while 25 jurisdictions are below 10 million MMBtu and nine are below 1 million MMBtu. The pattern is much more concentrated than a simple national average would suggest.
Texas and Louisiana account for 44.44% of the total
Texas alone accounts for 31.01% of the observed total. Adding Louisiana brings the combined share to 44.44%. California raises the top-three share to 50.67%, and the top five states—adding Indiana and Michigan—reach 59.40%. The ten largest observations account for 73.28% of all 51 values combined.
That concentration is consistent with useful-thermal operations being tied to the location of industrial heat demand, combined heat and power plants, and other facilities that can use recovered or jointly produced heat. The dataset itself, however, does not identify the specific facilities or industries responsible for each state total. Those explanations require facility-level or sector-level evidence.
The ten largest state observations
| State | million MMBtu | Share of 51-jurisdiction total |
|---|---|---|
| Texas | 463.17 | 31.01% |
| Louisiana | 200.65 | 13.43% |
| California | 93.03 | 6.23% |
| Indiana | 77.33 | 5.18% |
| Michigan | 53.09 | 3.55% |
| Alabama | 51.80 | 3.47% |
| New York | 42.60 | 2.85% |
| Tennessee | 39.50 | 2.64% |
| Pennsylvania | 37.41 | 2.50% |
| Ohio | 35.93 | 2.41% |
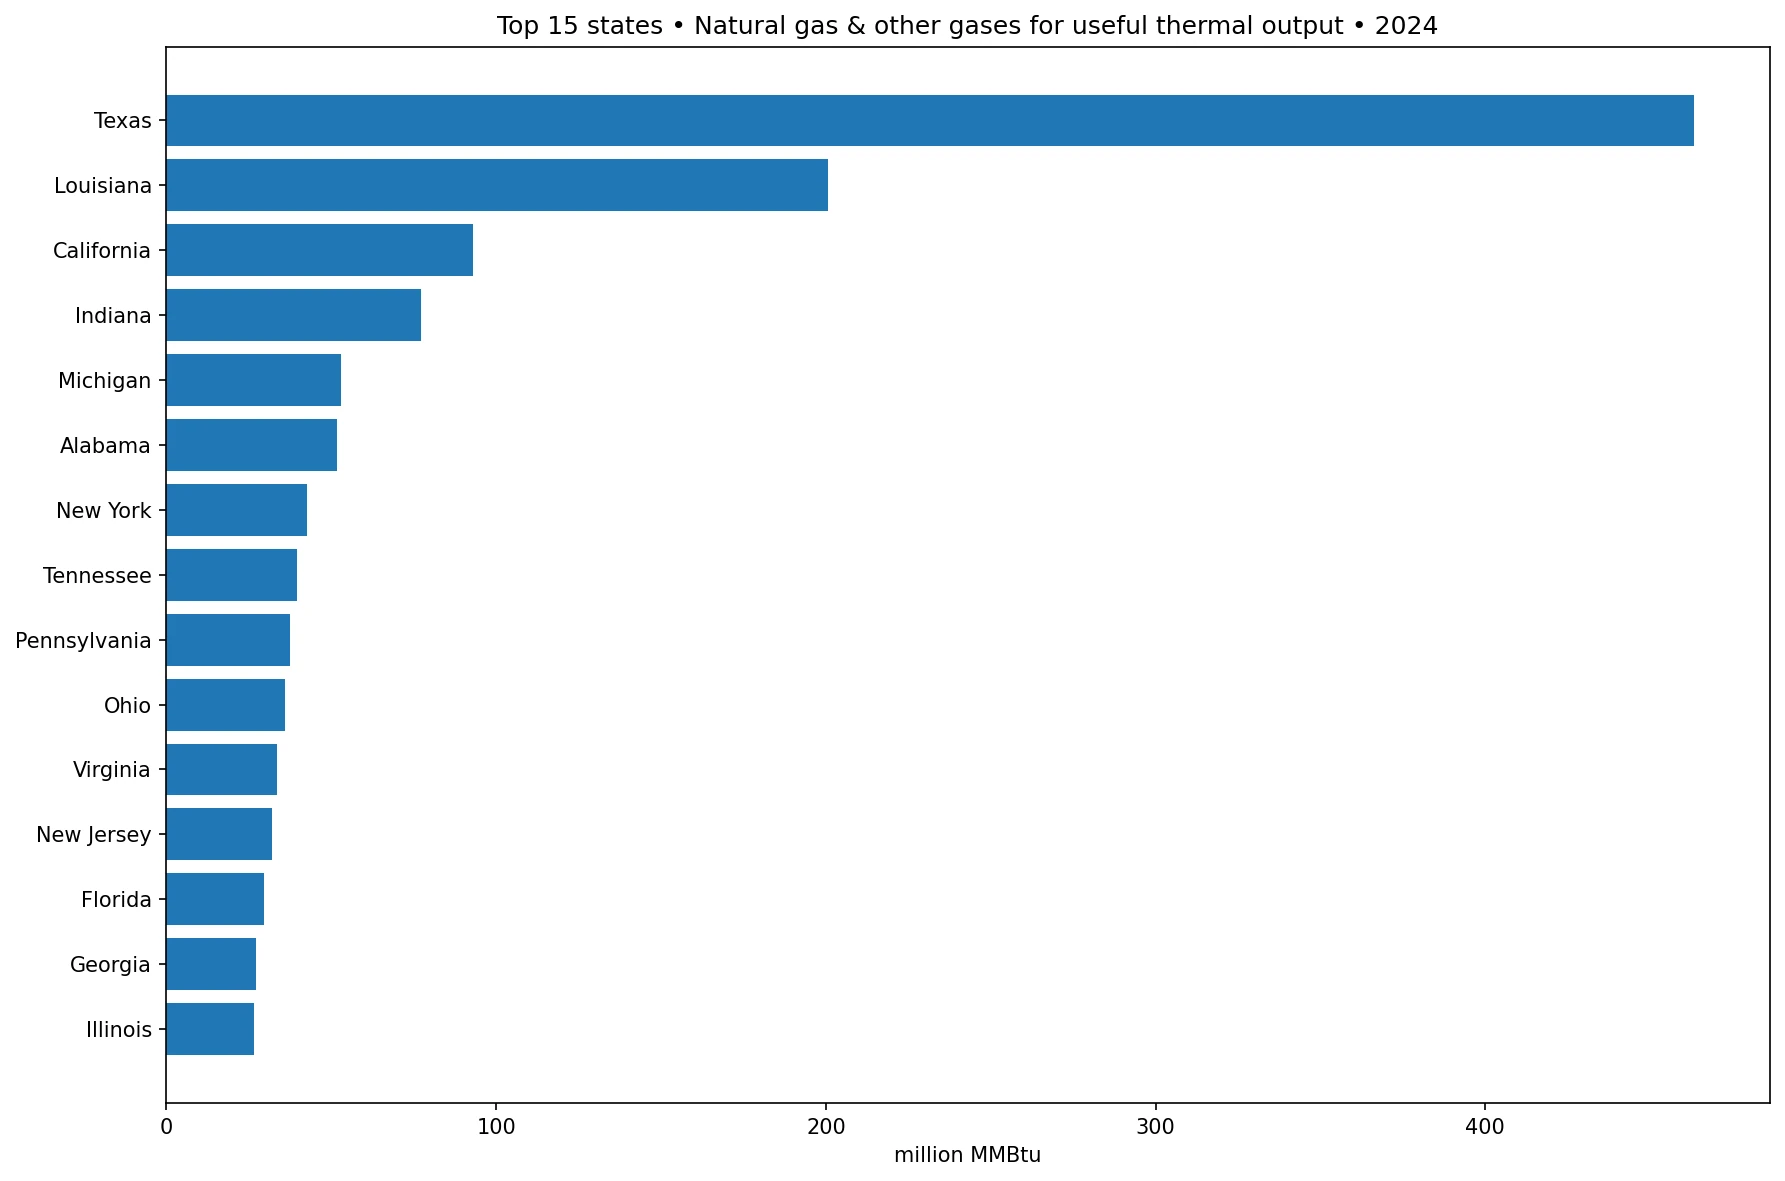
Texas at 463.17 million MMBtu is more than twice Louisiana’s 200.65 million MMBtu. California records 93.03, Indiana 77.33, Michigan 53.09, and Alabama 51.80 million MMBtu. New York, Tennessee, Pennsylvania, and Ohio complete the top ten. The geography is broad, but the first two observations dominate the national pattern.
The ranking is descriptive, not a measure of thermal efficiency or policy performance. A high value can reflect a large industrial base, extensive combined heat and power operations, high useful-heat demand, or several factors at once. The total alone cannot tell us how efficiently the fuel is converted into useful heat.
Nine jurisdictions are below 1 million MMBtu
| State or jurisdiction | million MMBtu | Share of 51-jurisdiction total |
|---|---|---|
| Hawaii | 0.00 | 0.00% |
| Vermont | 0.05 | 0.00% |
| Montana | 0.18 | 0.01% |
| New Hampshire | 0.25 | 0.02% |
| District of Columbia | 0.36 | 0.02% |
| Alaska | 0.42 | 0.03% |
| Utah | 0.68 | 0.05% |
| New Mexico | 0.77 | 0.05% |
| Rhode Island | 0.99 | 0.07% |
| Arizona | 1.42 | 0.10% |
Hawaii has an official 2024 value of 0.00 million MMBtu. Vermont is at 0.05, Montana 0.18, New Hampshire 0.25, the District of Columbia 0.36, Alaska 0.42, Utah 0.68, New Mexico 0.77, and Rhode Island 0.99 million MMBtu. These are published numeric observations, not missing values that were filled with zero.
A low value should not be interpreted as evidence that the state barely uses natural gas. This field covers only fuel consumption associated with useful thermal output in this EIA operational series. Residential heating, commercial use, industrial final consumption outside the relevant reporting scope, and electricity-generation fuel use are different statistical concepts.
Useful thermal output is different from electricity generation
Electric Power Operations includes several fuel-consumption fields. `consumption-uto-btu` is associated with useful thermal output, while fields such as `consumption-for-eg-btu` relate to electricity generation. Those two measures can overlap in the same combined heat and power facility, but they answer different questions and should not be substituted for one another.
Useful thermal output refers to heat that is captured and put to productive use, such as process steam, space heating, hot water, or other thermal applications. It is not simply waste heat. A facility that produces electricity and useful heat can therefore have fuel inputs linked to both electrical and thermal outputs.
The sector facet matters when comparing similar EIA series
This dataset uses sectorid=99. Closely related EIA posts can use a different sector facet even when the field and fuel category look similar. Changing the sector changes the universe of facilities contributing to the state total and can alter both rankings and shares.
That is why a 2025 article about natural gas and other gases used for electricity and useful heat should not be treated as the same series as this 2024 useful-thermal-only measure. One combines a broader operational concept, while this article focuses on the fuel input associated with useful thermal output.
Absolute consumption is not a measure of efficiency
Texas ranking first means it has the largest absolute amount of natural gas and other gases recorded under this useful-thermal measure. It does not tell us whether the state’s facilities are more or less efficient. Efficiency requires a comparison between energy input and the amount of useful thermal output produced.
Absolute totals are also affected by the scale of the industrial and energy system. A state with more large facilities can record a much higher total than a smaller state even if their unit efficiencies are similar. Normalizing by useful thermal output, industrial production, population, or another denominator would answer different questions and could produce a very different ranking.
The 2024 map is a snapshot, not a long-term trend
These values refer to one annual period. They do not show whether useful-thermal gas consumption is increasing or decreasing in each state. Fuel prices, industrial operating rates, plant maintenance, weather, changes in combined heat and power capacity, and shifts in process-heat demand can all affect annual observations.
A trend analysis would need to keep the EIA route, field, fueltypeid, sectorid, geography, and unit constant across years. Switching from `consumption-uto-btu` to a generation-consumption field would create a different series rather than a continuation of this one.
How the map, table, and chart complement one another
The map shows where high values are concentrated geographically. The ranking table preserves the exact values and national shares, including very small jurisdictions. The top-15 chart makes the magnitude of Texas and Louisiana easier to compare with the next group of states.
Distribution statistics add a fourth perspective. A mean of 29.29 million MMBtu might suggest a typical state is near 30, but the median of 10.19 shows that half of the jurisdictions are at or below roughly one third of that average. The difference is created by the heavy concentration at the top.
Data source and calculation method
The source is the U.S. Energy Information Administration’s Electric Power Operations (Annual and Monthly) API. The query uses the 2024 annual frequency, field `consumption-uto-btu`, fueltypeid=NGO for natural gas and other gases, and sectorid=99. The unit is million MMBtu, with 51 official observations covering all 50 states and the District of Columbia.
The total, mean, median, quartiles, rankings, and state shares are calculated directly from those 51 observations. Hawaii’s published zero is retained as a valid numeric value, and no missing observation is converted to zero. State codes were joined to U.S. state boundaries, and all 51 observations matched successfully.
Frequently Asked Questions
Is fuel used for useful thermal output the same as fuel used for electricity generation?
No. This article uses `consumption-uto-btu`, which is tied to useful thermal output. Electricity-generation fuel consumption is reported in separate EIA fields.
Is Hawaii’s zero a missing value?
No. It is an official numeric 2024 observation in the source data. Missing values were not converted to zero.
Does Texas ranking first mean it is less thermally efficient?
No. Absolute consumption depends on system scale and useful-heat demand. Efficiency requires comparing fuel input with useful thermal output.
Related Articles
Green Map creates custom-edited map images using open geographic data sources such as geoBoundaries, Natural Earth, OpenStreetMap, and government open data. These maps are edited visual materials, not raw data files, and are provided for education, documents, presentations, and graphic reference.