Texas generated the largest amount of renewable electricity in the 2025 U.S. Energy Information Administration series for the Electric Power Sector Non-CHP category. Its published net generation was 188,874.988 thousand MWh, equal to 18.20% of the sum of the 51 state and District of Columbia observations. California followed with 112,213.389 thousand MWh (10.81%), and Washington ranked third with 74,779.084 thousand MWh (7.21%). Together, those three jurisdictions accounted for 36.22% of the 2025 state-level sum. The exact EIA slice uses fueltypeid=REN, sectorid=90, field=generation, annual frequency, and a unit of thousand megawatthours.
That identity matters because several EIA electricity series use similar language but measure different populations or quantities. Sector 90 is the Electric Power Sector Non-CHP, so it excludes combined heat and power activity. The REN fuel facet combines renewable energy sources rather than isolating solar, wind, hydroelectric, geothermal, or biomass generation. The generation field is an electricity-output measure in MWh, not a fuel-input measure in Btu. An Independent Power Producer-only series, an Electric Utility series, or a solar-only series can therefore produce a different ranking without contradicting these results.
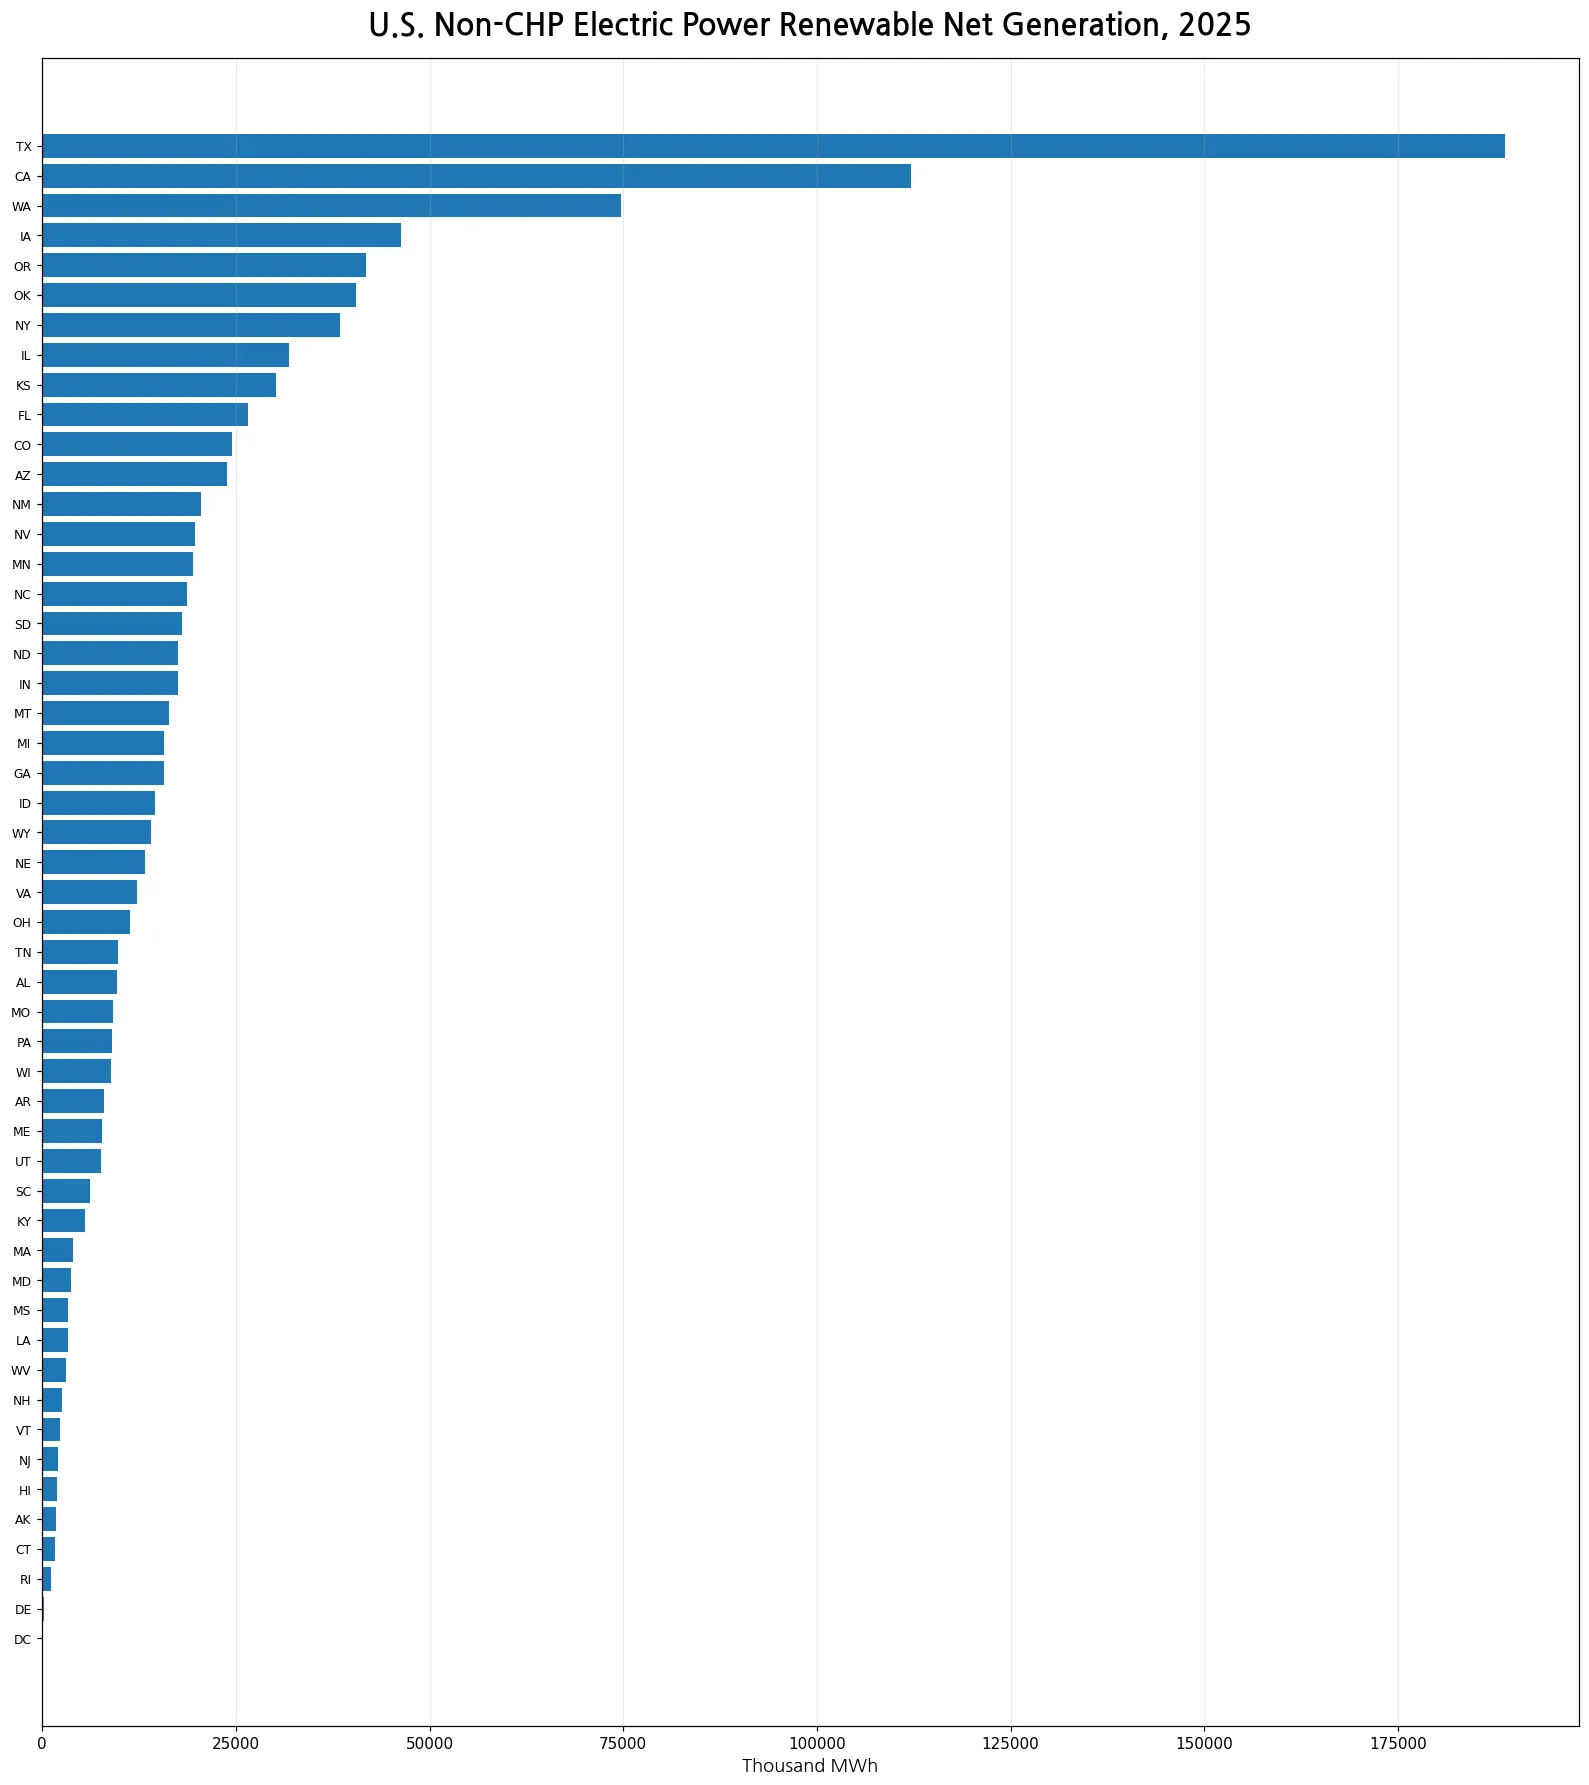
Table of Contents
Texas, California, and Washington dominate the upper end of the distribution
Texas generated about 1.68 times California’s renewable electricity and about 2.53 times Washington’s in this series. The top three states together represented 36.22% of the 51-observation sum, and the top five reached 44.72%. This concentration is the clearest feature of the distribution. It does not, however, identify the technologies responsible for the result. Texas may have a different combination of wind and solar than Washington, where hydropower is important, but the REN aggregate does not reveal those shares. Technology-specific EIA fuel facets would be required to attribute each state’s total to individual renewable sources.
Iowa, Oregon, and Oklahoma form the next group of large producers
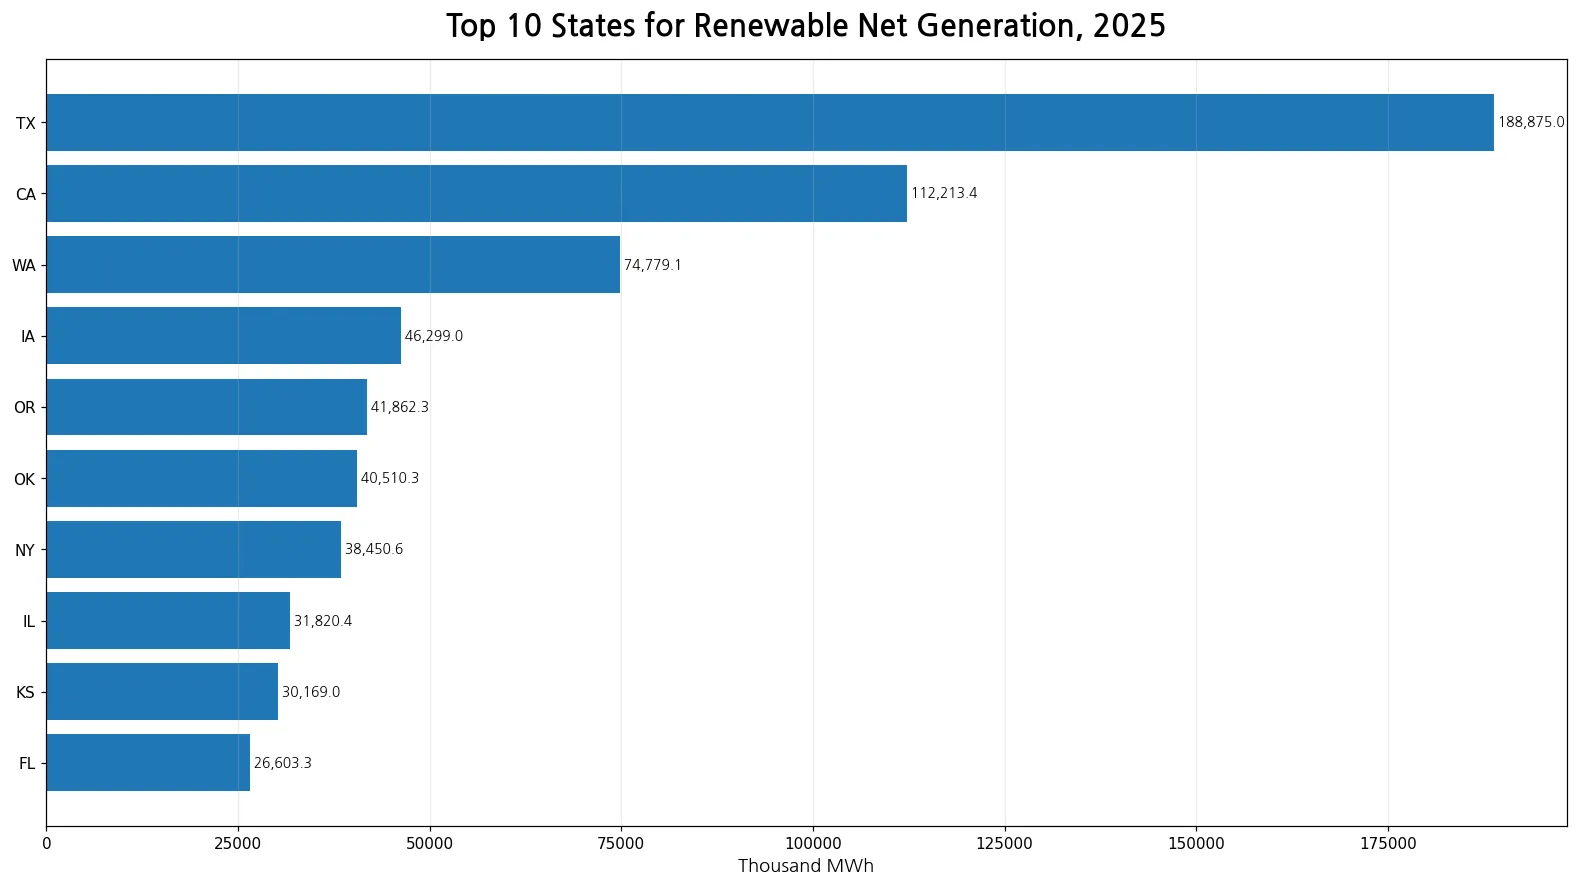
Iowa ranked fourth at 46,298.982 thousand MWh, Oregon fifth at 41,862.331, and Oklahoma sixth at 40,510.284. New York, Illinois, Kansas, and Florida complete the top ten. In total, the ten largest state observations account for 60.87% of the state-level sum. That means fewer than one-fifth of the 51 jurisdictions contribute roughly three-fifths of renewable generation in this particular EIA slice. The pattern is not limited to one region: the top ten include states from the South, West Coast, Pacific Northwest, Midwest, Great Plains, and Northeast.
| State | Thousand MWh | Share of 51-observation sum |
|---|---|---|
| Texas | 188,874.988 | 18.20% |
| California | 112,213.389 | 10.81% |
| Washington | 74,779.084 | 7.21% |
| Iowa | 46,298.982 | 4.46% |
| Oregon | 41,862.331 | 4.03% |
| Oklahoma | 40,510.284 | 3.90% |
| New York | 38,450.554 | 3.71% |
| Illinois | 31,820.390 | 3.07% |
| Kansas | 30,168.953 | 2.91% |
| Florida | 26,603.337 | 2.56% |
The mean is much higher than the median
The average of the 51 observations is 20,345.482 thousand MWh, while the median is only 12,295.460 thousand MWh. The mean is about 1.65 times the median because the very large values in Texas, California, and Washington pull the average upward. This difference is useful for understanding what a middle-ranked state looks like. A reader who saw only the average might imagine that a typical jurisdiction produces around 20,000 thousand MWh, even though half of the observations are at or below about 12,295 thousand MWh. Reporting both measures gives a more balanced view of the skewed distribution.
All 51 jurisdictions have published values in the 2025 slice
The data contain one value for each of the 50 states plus the District of Columbia. There are 0 missing values and 0 reported zeros. The smallest observation is the District of Columbia at 50.816 thousand MWh. Because every jurisdiction has a published number, the ranking does not require imputing missing observations or treating unavailable data as zero. That makes the cross-state comparison especially straightforward. In datasets with gaps, a no-data region must be kept separate from a true zero, but that distinction does not create a coverage issue here.
Sector 90 excludes combined heat and power generation
The sector facet is one of the most important boundaries in this dataset. Sectorid=90 is Electric Power Sector Non-CHP, where CHP refers to combined heat and power. A broader Electric Power sector or a narrower ownership category can contain a different set of facilities and therefore different generation totals. When comparing the 2025 result with another article or another EIA API query, sectorid should be matched along with the year, fuel facet, field, and unit. Otherwise, an apparent change can come from a definition change rather than from an actual change in renewable electricity output.
REN combines multiple renewable technologies
The REN fuel category aggregates renewable sources instead of reporting one technology. It is therefore accurate to say that Texas had the largest renewable net generation in this sector slice, but it would not be accurate to label the entire Texas value as wind generation or the entire Washington value as hydropower. Solar, wind, hydroelectric, geothermal, biomass, and other eligible renewable sources can contribute in different proportions by state. The aggregate is useful for measuring total renewable electricity output on a common MWh basis, while a technology-level explanation requires separate fuel-specific series.
High renewable generation is different from a high renewable share
This ranking uses absolute net generation. A state can generate a large amount of renewable electricity and still have a modest renewable percentage if its total electricity generation is also very large. Conversely, a smaller state can have a high renewable share while producing fewer renewable MWh in absolute terms. The two questions—where the most renewable electricity was generated and where renewables made up the largest percentage of generation—are related but not interchangeable. Calculating the second measure requires a compatible denominator representing total generation under the same sector definition.
Population and land area are also outside the scope of this ranking
The values are not adjusted for population, land area, electricity demand, or economic size. Large states can naturally appear near the top of an absolute generation ranking, but some smaller states such as Iowa or Kansas can also rank highly because renewable generation is large relative to their size. Per-capita or per-area comparisons could answer different questions, yet they would require adding another dataset and would no longer be a direct reading of the EIA generation series. The figures here stay with the original state totals to preserve a clear and reproducible comparison.
A single year should not be treated as a long-term trend
Renewable generation can change from year to year because of new capacity, hydrological conditions, wind and solar resources, maintenance schedules, transmission constraints, curtailment, market conditions, and other factors. Texas ranking first in 2025 is a clear statement about this annual cross-section, not proof that it has always ranked first or will remain first. A trend analysis should use the same REN fuel facet, sector 90 boundary, generation field, and unit across multiple years. Mixing sectors or fuel definitions would make year-to-year changes difficult to interpret.
The top 10 list includes several different regional electricity systems
The leading group is geographically diverse. Texas and Florida represent the South, California and Oregon the West Coast, Washington the Pacific Northwest, Iowa and Illinois the Midwest, Kansas and Oklahoma the central plains, and New York the Northeast. That variety matters because renewable resource mixes and grid structures differ greatly across these states. A common aggregate measure makes their output comparable, but it should not erase those differences. The ranking is best seen as a starting point for more detailed state or technology analysis rather than a complete explanation of each electricity system.
What can be concluded directly from the 2025 data
Several conclusions are directly supported by the published observations: Texas is first, California is second, Washington is third, the top three account for 36.22% of the 51-state sum, and the top ten account for 60.87%. The full distribution is right-skewed, all 51 jurisdictions have non-missing positive observations, and the median is well below the mean. The data do not directly establish the causes of state differences, renewable capacity factors, renewable shares of total generation, electricity prices, emissions reductions, or policy effectiveness. Those questions require additional variables.
Source and calculation method
The source is the U.S. Energy Information Administration electricity/electric-power-operational-data annual series. The query is fixed to 2025 with fueltypeid=REN, sectorid=90, and field=generation, reported in thousand megawatthours. The 51 published observations sum to 1,037,619.579 thousand MWh, with a mean of 20,345.482 and a median of 12,295.460 thousand MWh. State shares are calculated by dividing each state’s value by the sum of the same 51 observations. No missing values were imputed, no zeros were manufactured, and no values from a different year or sector were combined. EIA may revise annual observations later, so the same query can be rerun when updated data are available.
Frequently Asked Questions
Which state had the most non-CHP renewable net generation in 2025?
Texas ranked first at 188,874.988 thousand MWh, about 18.20% of the sum of the 51 published observations.
What does sectorid=90 mean?
It is the EIA Electric Power Sector Non-CHP category, excluding combined heat and power activity.
Does REN mean solar generation only?
No. REN is an aggregate renewable fuel category. Technology-specific contributions require separate EIA fuel facets.
Does the top renewable generation state also have the highest renewable share?
Not necessarily. This ranking uses absolute MWh. Renewable share requires total generation under a compatible definition as the denominator.
Related Articles
Green Map creates custom-edited map images using open geographic data sources such as geoBoundaries, Natural Earth, OpenStreetMap, and government open data. These maps are edited visual materials, not raw data files, and are provided for education, documents, presentations, and graphic reference.