Most tertiary graduates can be assigned to a recognizable field such as education, engineering, health, business, science, or the arts. A smaller group may be reported under an unknown or unspecified field. World Bank series SE.TER.GRAD.OT.ZS measures the share of all tertiary graduates that falls into this residual field category.
This is not a popularity ranking for a real academic major called “unspecified.” It is better understood as a classification and reporting measure within field-of-study statistics. The latest-observation table contains 161 countries and areas dated from 1999 to 2020, so the main map uses only the 92 observations dated 2018–2020.
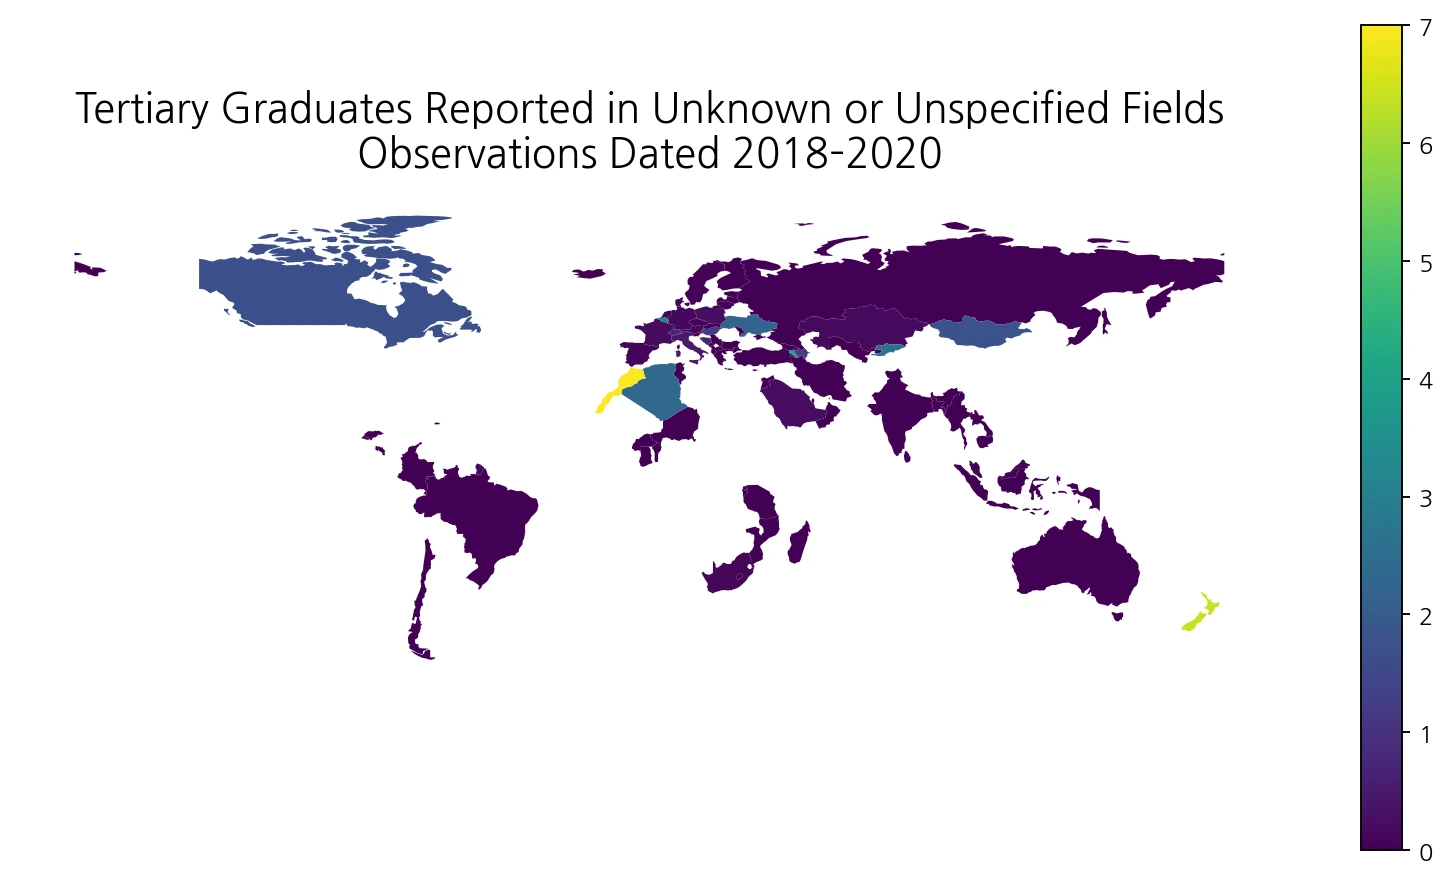
Table of Contents
‘Unspecified field’ is a residual classification, not a normal subject category
UNESCO UIS classifies tertiary graduates across fields such as education, arts and humanities, social sciences, business and law, natural sciences, ICT, engineering, agriculture, health and welfare, and services. Graduates that cannot be clearly classified by field, or whose field information is not sufficiently disaggregated, can be placed in an unknown or unspecified category.
UNESCO education-data instructions ask countries to convert national field classifications to the international framework where possible. When data cannot be disaggregated, or when programmes fall into generic or otherwise unassignable categories, figures can be reported as not known or unspecified. A high percentage therefore does not mean that students deliberately chose an academic discipline named “unspecified.”
Fifty-eight of 92 recent observations are exactly zero
Among the 92 observations dated 2018–2020, 58 (63.0%) are reported at 0.00%. Only 34 are above zero. The median is therefore 0.00%, while the unweighted mean is 0.72%. The mean is pulled upward by a small number of much larger values.
| 2018–2020 unspecified-field share | Countries/areas | Share of 92 |
|---|---|---|
| 0% | 58 | 63.0% |
| >0% to <0.1% | 10 | 10.9% |
| 0.1% to <0.5% | 9 | 9.8% |
| 0.5% to <1% | 2 | 2.2% |
| 1% to <3% | 8 | 8.7% |
| 3% to <10% | 4 | 4.3% |
| 10% or more | 1 | 1.1% |
A zero value should not automatically be treated as proof of perfect statistical quality. It means that no tertiary graduates were reported in this residual category for the observation. The country may have classified every graduate into a specific field, but reporting conventions and national mapping procedures can also matter.
Morocco stands out at 27.84% in the recent subset
Morocco records 27.84% in 2019, far above every other 2018–2020 observation. New Zealand is 6.41% in 2018, Grenada 5.68%, Armenia 4.00%, and Belgium 3.19%. The Kyrgyz Republic is 2.66%, Algeria 2.34%, Ukraine 2.22%, Bahrain 1.76%, Mongolia 1.72%, and Canada 1.70%.
| Country/area | Observation year | Graduates in unspecified fields |
|---|---|---|
| Morocco | 2019 | 27.84% |
| New Zealand | 2018 | 6.41% |
| Grenada | 2018 | 5.68% |
| Armenia | 2019 | 4.00% |
| Belgium | 2018 | 3.19% |
| Kyrgyz Republic | 2019 | 2.66% |
| Algeria | 2018 | 2.34% |
| Ukraine | 2019 | 2.22% |
| Bahrain | 2019 | 1.76% |
| Mongolia | 2018 | 1.72% |
| Canada | 2018 | 1.70% |
| Hungary | 2018 | 1.27% |
| Azerbaijan | 2019 | 1.25% |
| Bosnia and Herzegovina | 2019 | 0.74% |
| Switzerland | 2018 | 0.68% |
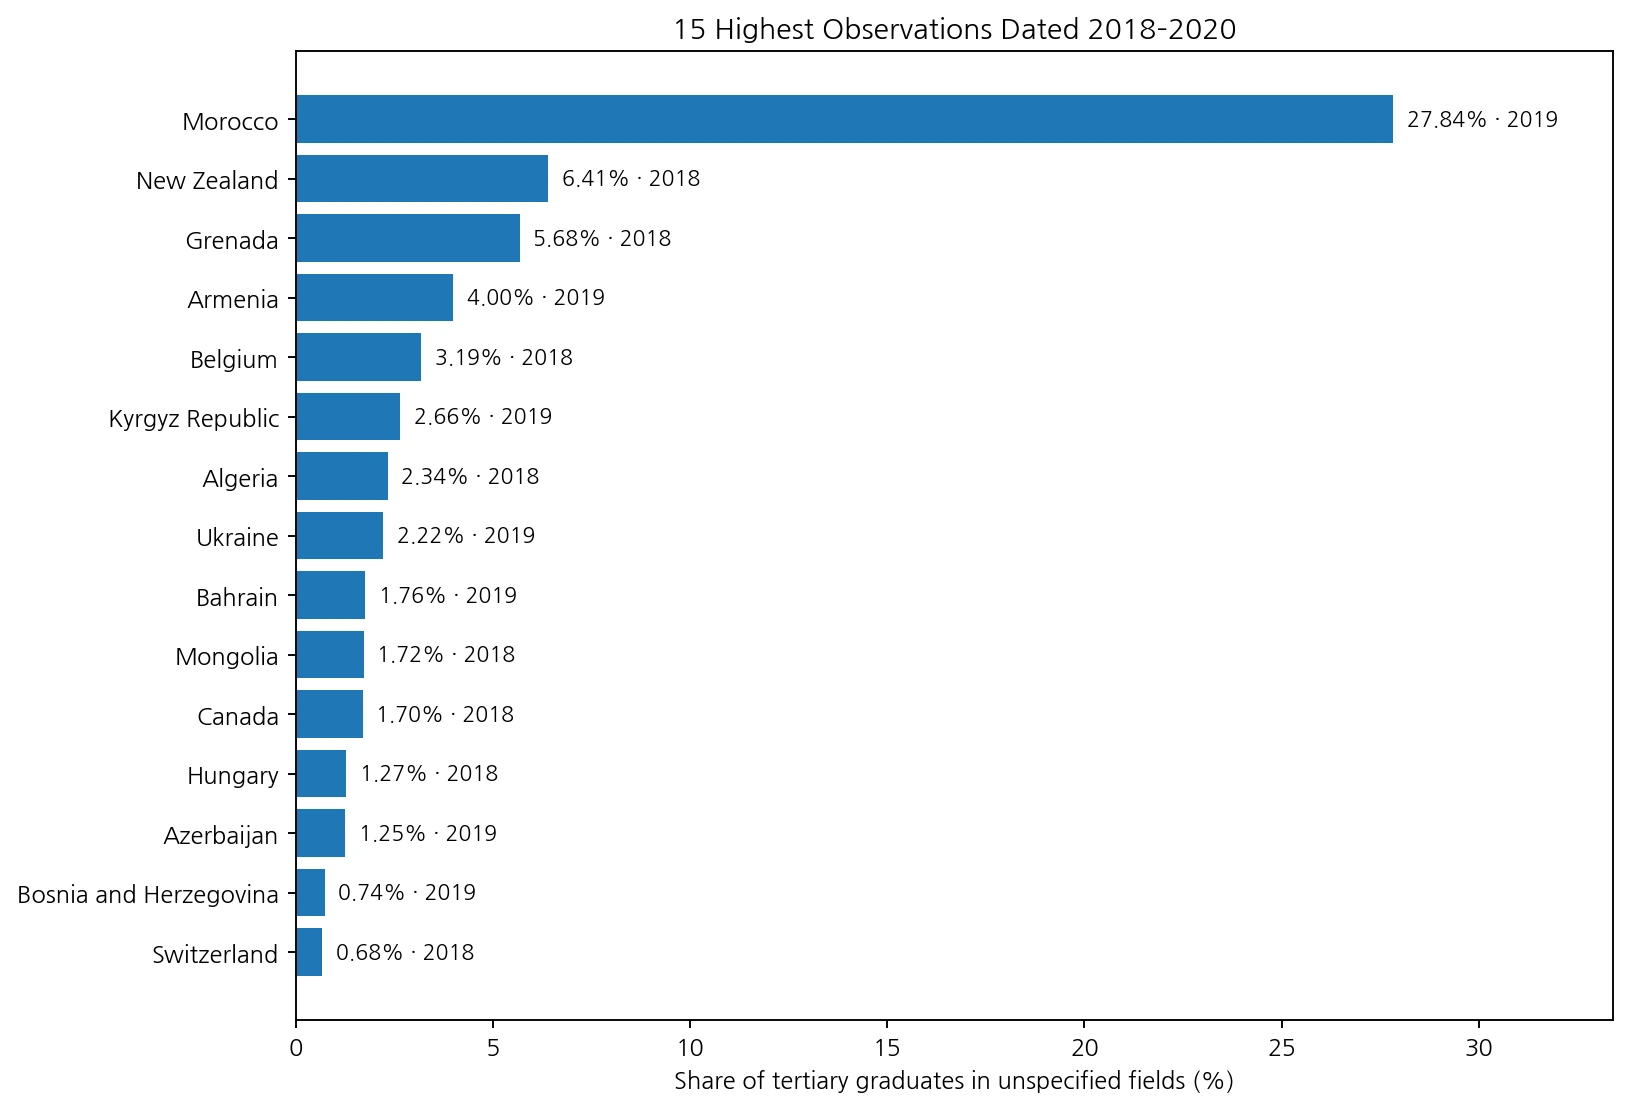
These values should not be interpreted as differences in student subject preferences or education quality. A high residual share signals that a larger portion of graduates was not allocated to one of the standard field categories in that statistical submission. Explaining why requires country-specific documentation on field coding, reporting scope, and possible classification changes.
Korea, the United States, and the United Kingdom have older last observations
Korea’s latest retained value is 0.03% in 2017, the United States is 0.00% in 2016, the United Kingdom 0.65% in 2016, and Mexico 0.03% in 2017. Those observations are valid historical values, but they are excluded from the 2018–2020 map because mixing them into a recent ranking would combine different reporting periods.
| Country | Latest observation year | Graduates in unspecified fields |
|---|---|---|
| Korea, Rep. | 2017 | 0.03% |
| United States | 2016 | 0.00% |
| United Kingdom | 2016 | 0.65% |
| Canada | 2018 | 1.70% |
| Germany | 2018 | 0.16% |
| France | 2018 | 0.20% |
| Australia | 2018 | 0.02% |
| India | 2019 | 0.00% |
| Brazil | 2018 | 0.00% |
| New Zealand | 2018 | 6.41% |
| Morocco | 2019 | 27.84% |
| Belgium | 2018 | 3.19% |
Canada, Germany, France, Australia, India, Brazil, New Zealand, Morocco, and Belgium all have observations inside the 2018–2020 window. Their differences mainly describe how graduates were distributed across the international field-classification categories in those reporting years, not which subjects students preferred.
Why the full 161-row latest-value table is not used as one current map
Only 92 of the 161 latest observations are dated 2018–2020. Forty-four are from 2015–2017, 12 from 2010–2014, and 13 from 1999–2009. A maximum year of 2020 does not mean that every country in the table was measured in 2020.
| Latest observation period | Countries/areas | Share of 161 |
|---|---|---|
| 1999–2009 | 13 | 8.1% |
| 2010–2014 | 12 | 7.5% |
| 2015–2017 | 44 | 27.3% |
| 2018–2020 | 92 | 57.1% |
Cuba illustrates the problem clearly. Its latest retained value is 41.14% in 2016, the highest value in the full 161-row table, but it is not placed beside Morocco’s 2019 value in the main recent ranking. The observation remains important historically, but it belongs to a different reporting period.
The indicator does not measure field diversity or the popularity of majors
A low unspecified-field share does not prove that students have more diverse study choices, and a high share does not show that a country lacks certain disciplines. To study subject choice, the relevant indicators are the shares of tertiary graduates in clearly defined fields such as engineering, ICT, health, natural sciences, business, education, or the arts.
The residual indicator is most useful as a quality check before comparing those substantive field shares. If a country has a very large unspecified category, its percentages in named fields may need to be interpreted with extra caution because a meaningful part of the graduate population was not assigned to those categories.
The large number of zeros makes outliers more informative than the mean
More than half of the recent observations are exactly zero, and most of the remainder are below 0.5%. That means a simple average does not describe the shape of the distribution very well. The median, the number of zero observations, and the small set of countries with unusually high residual shares are more informative.
The map uses the same logic. If Morocco’s 27.84% were used as the full color-scale maximum, most countries between zero and 6% would be visually compressed. The display scale is therefore capped at 7%, while the underlying data, rankings, labels, and calculations retain the original values.
International field classifications improve comparability, but they do not remove every reporting difference
UNESCO UIS uses the ISCED Fields of Education and Training framework to support international comparison of graduate distributions. National education systems, however, use different programme and subject structures, which must be mapped into the common framework. UNESCO notes that comparisons depend on consistent field definitions and can be affected by incomplete data, exclusions, double counting, and classification differences.
The unknown or unspecified category is especially sensitive to those issues because it is where unclassifiable or insufficiently detailed information can accumulate. Small country differences should therefore not be interpreted as policy performance scores. The indicator is better treated as descriptive evidence about how completely graduate fields were classified in a particular statistical observation.
Data source and calculation method
The statistical source is World Bank Education Statistics series SE.TER.GRAD.OT.ZS, titled “Percentage of graduates from tertiary education graduating from programmes in unspecified fields, both sexes (%).” It represents the percentage of all tertiary graduates reported in the unknown or unspecified field category. The underlying international field-of-study framework is maintained by the UNESCO Institute for Statistics.
UNESCO UIS defines the percentage of tertiary graduates by field as graduates in each field divided by total tertiary graduates. Its formal-education survey instructions state that graduates who cannot be classified by field, or data that cannot be disaggregated into a defined field, should be reported under a not-known or unspecified category.
The main map and tables use the 92 observations dated 2018–2020. Country-level means are unweighted by the number of graduates. ISO-3 codes are joined to a Natural Earth low-resolution world layer, where 79 polygons match directly.
- World Bank – Percentage of tertiary graduates in unspecified fields
- UNESCO UIS – Distribution of graduates in tertiary education by field of education
- UNESCO UIS – Survey of Formal Education instruction manual
Frequently Asked Questions
Is ‘unspecified field’ an actual academic major?
No. It is a residual statistical category for graduates whose field is unknown, unspecified, or cannot be assigned to a standard field category.
Does a high unspecified-field share mean lower education quality?
No. The measure is primarily about how graduate fields were classified and reported, not the quality of the education system.
Why does the main comparison use 92 observations from 2018–2020 instead of all 161 latest values?
The full latest-observation set spans 1999–2020. Restricting the map to 2018–2020 reduces the risk of mixing older classification systems into a recent comparison.
Does a 0% value prove perfect field-of-study data?
Not necessarily. It means no graduates were reported in the residual unspecified category for that observation, but national reporting and classification practices still matter.
Related Articles
- Global Short-Cycle Tertiary Attainment Map – Adults 25+ by Country
- Post-Secondary Attainment for Adults 25+ – 2020–2024 Map
- Global Upper-Secondary Attainment Map – Adults 25+ by Country
Green Map creates custom-edited map images using open geographic data sources such as geoBoundaries, Natural Earth, OpenStreetMap, and government open data.
These maps are edited visual materials, not raw data files, and are provided for education, documents, presentations, and graphic reference.