Natural gas occupies very different positions in national power systems. In some economies it supplies almost all electricity generation; in others it is absent or only marginal. The World Bank indicator EG.ELC.NGAS.ZS makes that contrast visible by expressing electricity produced from natural gas as a percentage of total electricity production. The verified dataset used here contains 209 economies and one latest non-empty observation for each.
The first limitation matters as much as the ranking: these are not all observations from the same year. There are 38 values dated 2024, 75 dated 2023, and 96 dated 2021. The results therefore represent a latest-available comparison covering 2021–2024, not a uniform 2024 world snapshot. This is useful for seeing the broad structure of gas dependence, but it should not be treated as a perfectly synchronized cross-country table.
Table of Contents
What the natural-gas electricity share measures
The indicator reports the percentage of total electricity production generated from natural gas. The World Bank definition treats gas as natural gas and excludes natural gas liquids. A value of 60% means that about three-fifths of electricity produced in that economy during the observation year came from natural-gas sources. It does not mean that 60% of all energy consumption was gas, and it does not reveal the absolute quantity of electricity generated.
That distinction is essential for comparisons. A small power system with a 90% gas share can produce much less gas-fired electricity in absolute terms than a very large system with a 30% share. The indicator is strongest as a measure of generation mix and dependence on a fuel category. Questions about plant output, fuel use, capacity, imports, prices, emissions, or reliability require additional datasets.
The highest latest observations are close to complete dependence
The top of the distribution is striking. Turkmenistan records 99.98% in 2023, Bahrain 99.71%, Trinidad and Tobago 99.56%, and Algeria 98.96%. Qatar is at 96.65%, Oman 95.54%, Tunisia 95.09%, Singapore 93.72%, and Azerbaijan 92.39%. These values indicate power systems in which natural gas dominated the generation mix during the reported year rather than merely serving as one fuel among several.
| Economy | Observation year | Natural-gas share |
|---|---|---|
| Turkmenistan | 2023 | 100.0% |
| Bahrain | 2023 | 99.7% |
| Trinidad and Tobago | 2023 | 99.6% |
| Algeria | 2023 | 99.0% |
| Qatar | 2023 | 96.7% |
| Oman | 2023 | 95.5% |
| Tunisia | 2023 | 95.1% |
| Singapore | 2023 | 93.7% |
| Azerbaijan | 2023 | 92.4% |
| Malta | 2023 | 85.7% |
| Moldova | 2023 | 84.7% |
| Gibraltar | 2023 | 81.0% |
High percentage values should not be confused with the largest gas-fired electricity markets. The ranking says how concentrated electricity production is in natural gas, not how many terawatt-hours are generated. A country with a lower percentage may still burn substantially more gas for power if its electricity system is much larger. For market-size analysis, this percentage series needs to be paired with generation volumes.
The distribution has two very different ends
Of the 209 economies, 90 have a latest recorded value of exactly 0%, or about 43.1% of the dataset. At the other end, 40 economies are at or above 50%, while 17 are at or above 75%. The median is only 2.6%, whereas the mean is 20.7%. That gap between median and mean reflects a strongly skewed distribution: many economies have little or no gas-fired generation, while a smaller group has very high dependence.
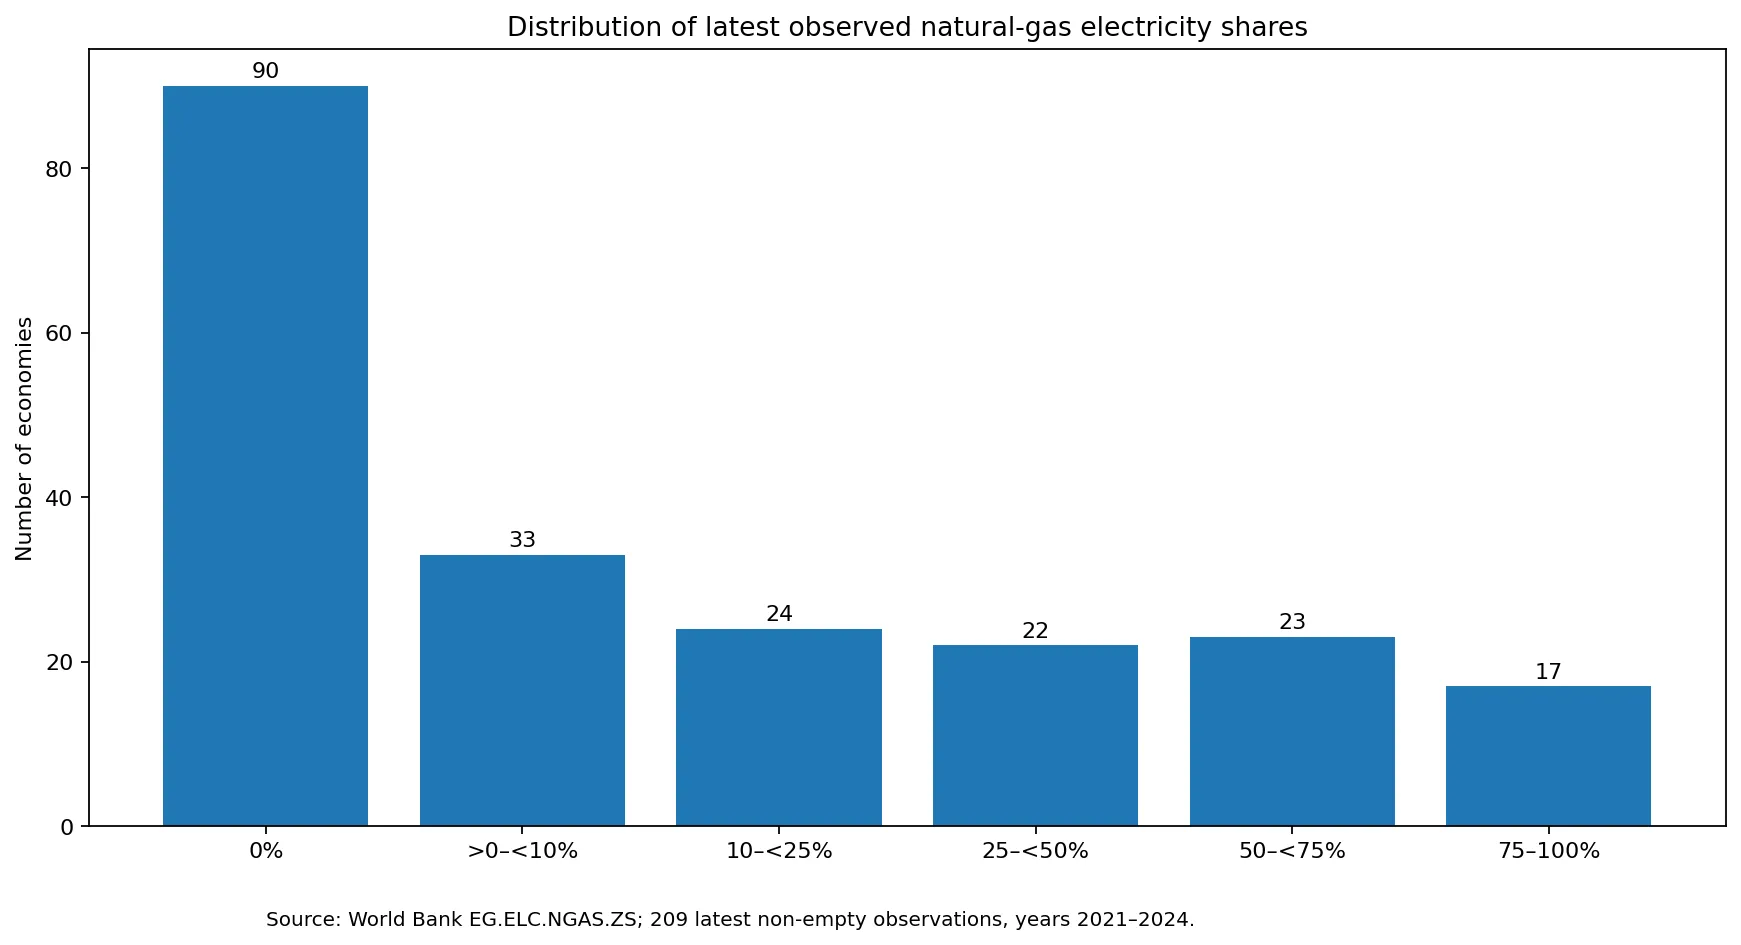
This shape is a reminder that natural gas is not a universal default fuel for electricity. Hydropower-heavy systems, coal-centered systems, nuclear-intensive systems, oil-based island systems, and power mixes with large renewable shares can all produce low gas percentages for very different reasons. Conversely, access to gas resources, pipeline or LNG infrastructure, and a large installed fleet of gas turbines can support high shares. The percentage alone does not identify which of those explanations applies to a particular economy.
Large electricity markets also show wide variation
The contrast remains large even among major power systems. The United States is at 42.0% in 2024 and Mexico at 61.9%. The United Kingdom is 30.5% and Japan 29.8%. Germany records 17.5%, Brazil 6.4%, and France 3.1% in 2024. China and India are both near 3.0% in their 2023 observations. Economic size by itself therefore tells little about the role of gas in electricity generation; historical infrastructure and the availability of competing generation sources matter more directly.
| Economy | Observation year | Share |
|---|---|---|
| United States | 2024 | 42.0% |
| Mexico | 2024 | 61.9% |
| United Kingdom | 2024 | 30.5% |
| Japan | 2024 | 29.8% |
| Germany | 2024 | 17.5% |
| Brazil | 2024 | 6.4% |
| France | 2024 | 3.1% |
| China | 2023 | 3.0% |
| India | 2023 | 3.0% |
A similar percentage can also mask different operating roles. Gas plants may supply steady baseload-like generation in one system and operate mainly as flexible capacity in another. In systems with growing wind and solar output, gas can be used to respond to daily or seasonal variability. In gas-producing economies, domestic fuel availability can be an important structural advantage. None of those operating details can be proven from the share indicator itself, so they should be investigated with generation-by-technology and market data rather than inferred from a single percentage.
Why the mixed observation years matter
The dataset uses the most recent non-empty value available for each economy, which produces a mixture of 2021, 2023, and 2024 observations. The 2021 group contains 96 economies, and 89 of those values are zero. That makes it especially important not to compare the average of the 2021 group with the average of the 2024 group as if it represented a global trend. The membership of the groups is different, and the year labels partly reflect reporting availability rather than a controlled panel.
For a structural overview, latest-available values are still useful: they identify economies with very high, moderate, low, or zero gas shares using the freshest verified observation present in the source. For a trend question—such as whether one country is increasing or reducing gas generation—the correct approach is to retrieve its full time series and compare like-for-like years. A single latest value describes position, not direction.
How to use the indicator with other energy data
Natural-gas share becomes more informative when it is combined with measures that answer different questions. Total electricity generation separates percentage dependence from market size. Shares for coal, oil, hydropower, nuclear, wind, and solar show what competes with gas. Domestic gas production, pipeline connections, LNG imports, and fuel prices help explain supply conditions. Power-sector emissions can then be examined separately rather than assumed from the fuel share alone.
- Total electricity generation to distinguish share from absolute scale
- Shares of renewable, coal, nuclear, oil, and hydro generation to place gas within the full mix
- Natural-gas production and import data to examine fuel availability and exposure
- Power-sector emissions data to evaluate environmental outcomes separately
Source, coverage, and interpretation
The analysis uses the World Bank indicator EG.ELC.NGAS.ZS, “Electricity production from natural gas sources (% of total).” The verified table contains 209 economies and the latest non-empty observation available for each. Values are percentages of total electricity production, and the observation year should always be read alongside the value because coverage is split across 2021, 2023, and 2024.
The most useful takeaway is not a single global average. It is the breadth of the distribution: some power systems are almost entirely gas-based, many use gas as one important component, and a large group records no gas-fired share in its latest observation. That diversity is why country-level power-mix comparisons are more informative than assuming one common role for natural gas worldwide.
Frequently Asked Questions
What does the natural-gas share of electricity production measure?
It is the percentage of total electricity production generated from natural gas. It describes the generation mix, not the absolute volume of gas used or electricity produced.
Are all 209 observations from 2024?
No. The verified latest-available dataset contains 38 observations from 2024, 75 from 2023, and 96 from 2021.
Does a higher percentage mean a country generates more gas-fired electricity in absolute terms?
Not necessarily. A smaller power system can have a high percentage but a lower absolute volume than a large system with a lower percentage.
Related Articles
Green Map creates custom-edited map images using open geographic data sources such as geoBoundaries, Natural Earth, OpenStreetMap, and government open data. These maps are edited visual materials, not raw data files, and are provided for education, documents, presentations, and graphic reference.