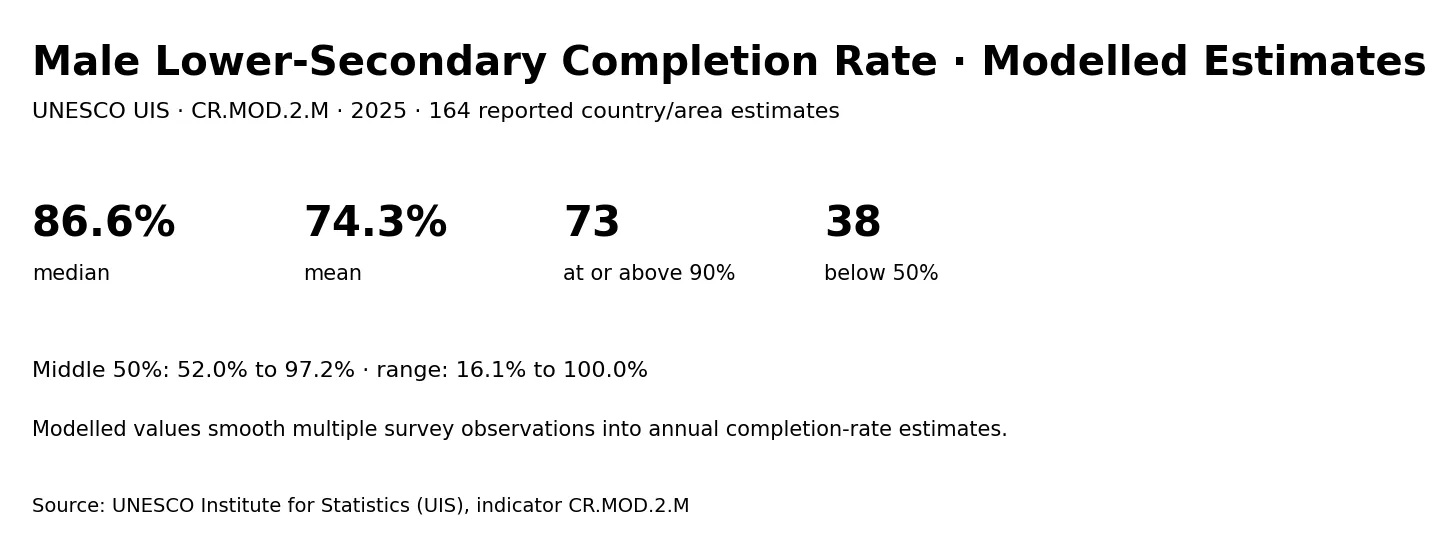
UNESCO Institute for Statistics (UIS) indicator CR.MOD.2.M reports the male lower-secondary completion rate as modelled data. The 2025 series used here contains 164 reported country and area estimates, expressed in percent. The median is 86.62%, while the arithmetic mean is much lower at 74.25%. That large gap is one of the most important features of the distribution: many estimates are very high, but a substantial lower tail extends through the 50s, 40s, 30s, and even below 20%.
UIS defines the completion rate as the percentage of a cohort of children or young people aged three to five years above the intended age for the last grade of an education level who have completed that grade. For this series the level is lower secondary and the population is male. The word “modelled” is also essential: the annual value is an estimate produced from multiple survey observations and a statistical model, rather than a simple count from one survey conducted in 2025.
Table of Contents
The median is 86.62%, but the cross-country spread is wide
The first quartile is 51.99% and the third quartile is 97.20%, so the middle half of the estimates spans about 45.21 percentage points. That is a broad central range. The variation is therefore not driven only by a few extreme countries: even within the middle 50% of the distribution, estimated male lower-secondary completion differs greatly.
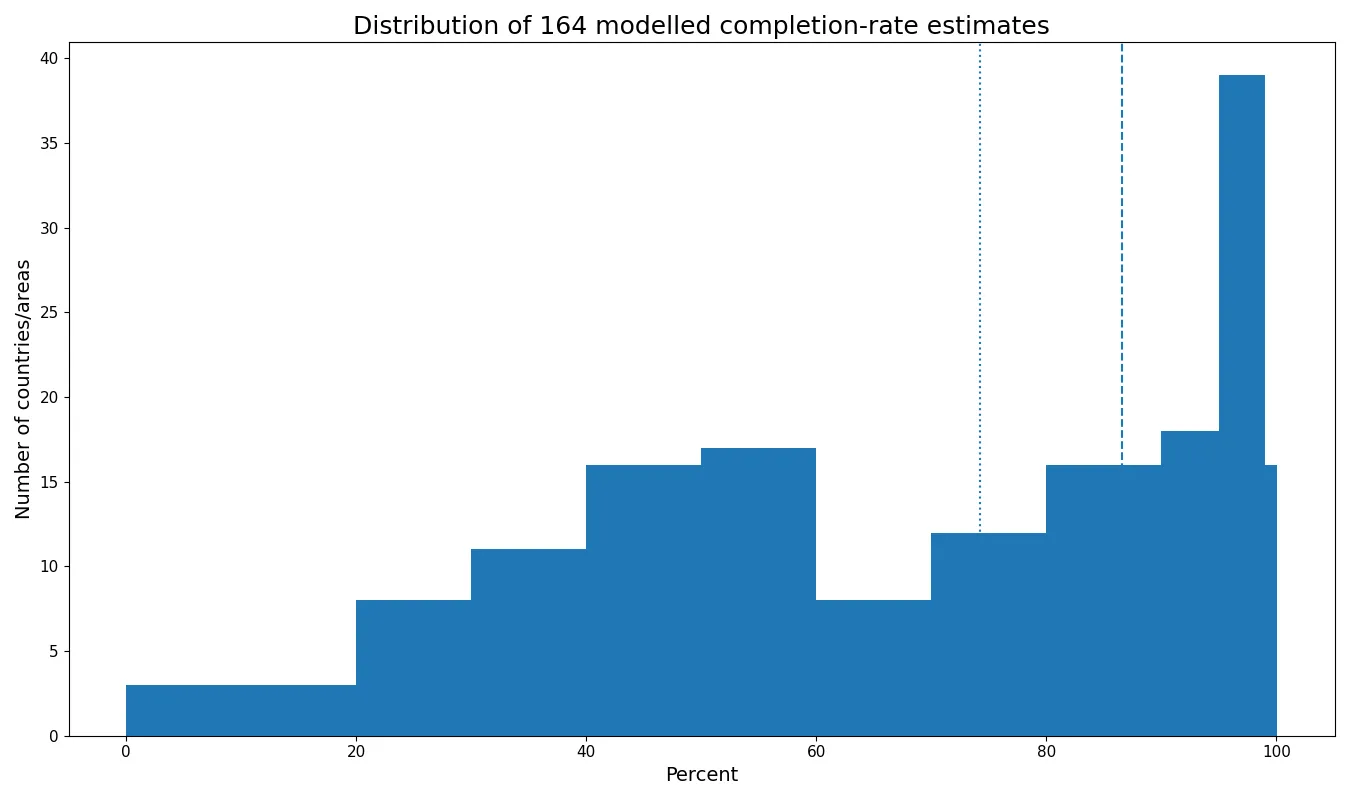
There are 73 observations at or above 90% and 55 at or above 95%. At the other end, 38 are below 50%, 22 are below 40%, and 11 are below 30%. The coexistence of a large high-completion group and a sizeable low-completion group explains why the mean is only 74.25% even though the median is above 86%.
Looking at wider bands, 11 observations are below 30%, 27 are from 30% to under 50%, 25 from 50% to under 70%, and 28 from 70% to under 90%. At the high end, 18 fall from 90% to under 95%, 39 from 95% to under 99%, and 16 reach at least 99%. These counts show why a single global-looking average hides important differences.
The upper end contains many estimates close to universal completion
The maximum reported estimate is 100%. Qatar follows at 99.96%, the United Kingdom of Great Britain and Northern Ireland at 99.84%, Norway at 99.79%, Denmark at 99.72%, and Turkmenistan at 99.71%. Several additional countries remain above 99%, so the upper tail is tightly compressed near the ceiling.
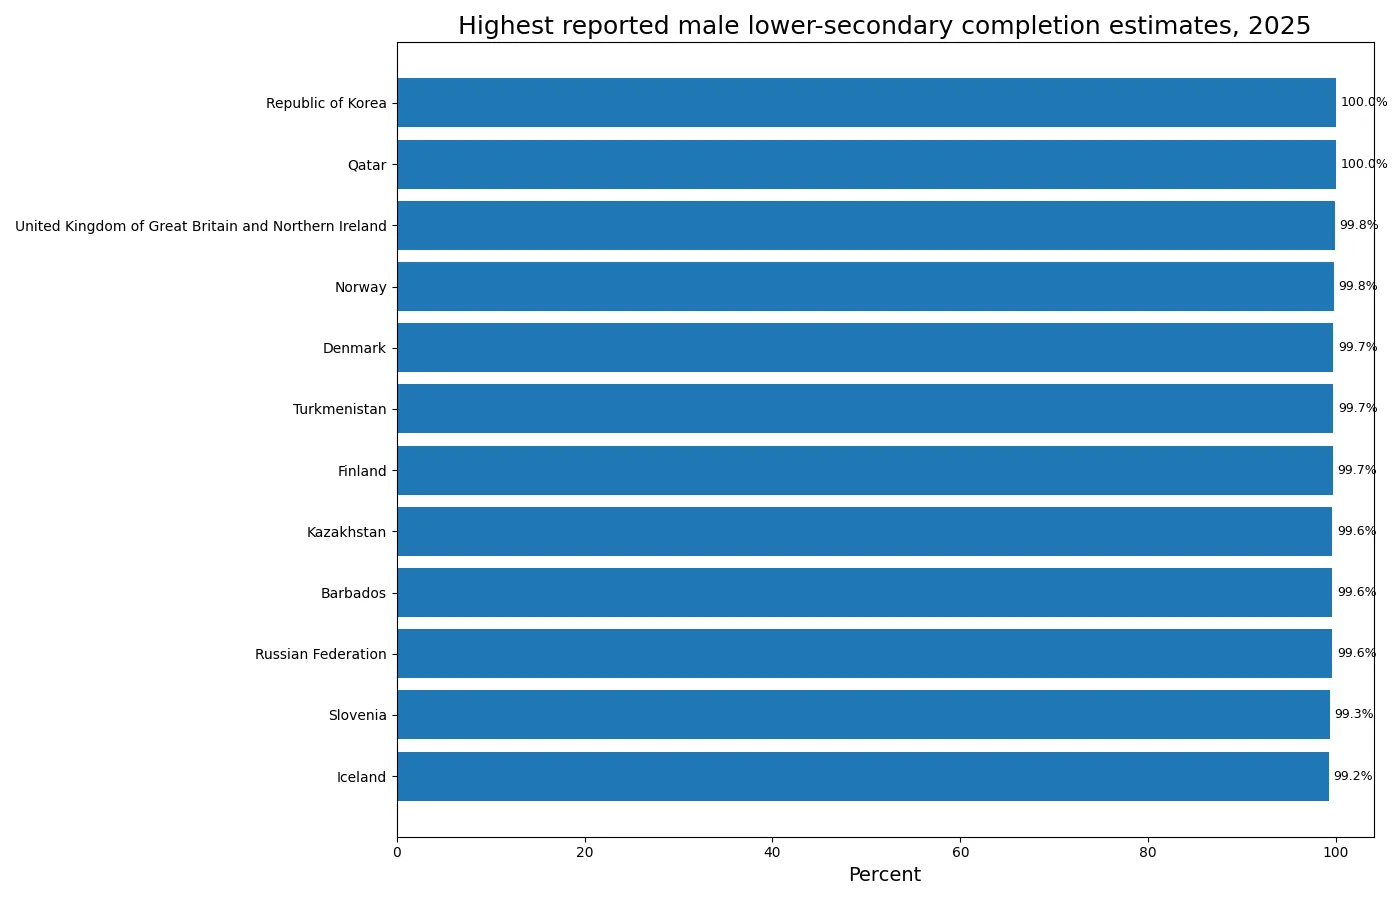
| Country or area | 2025 estimate |
|---|---|
| Republic of Korea | 100.00% |
| Qatar | 99.96% |
| United Kingdom of Great Britain and Northern Ireland | 99.84% |
| Norway | 99.79% |
| Denmark | 99.72% |
| Turkmenistan | 99.71% |
| Finland | 99.67% |
| Kazakhstan | 99.62% |
| Barbados | 99.62% |
| Russian Federation | 99.61% |
Small differences within this top group should not be interpreted as a precise ranking of education-system quality. A difference between 99.6% and 99.8% is tiny compared with the overall cross-country range and may be affected by the underlying survey evidence and modelling process. The meaningful conclusion is that these estimates are close to universal completion, not that a country ranked a few tenths higher necessarily has a better system.
Completion is also different from learning achievement. A very high completion rate indicates that a high proportion of the relevant age cohort completed lower secondary education, but it does not tell us whether students reached a particular proficiency in reading, mathematics, or other subjects. Learning outcomes require separate indicators. Completion is one important dimension of educational participation and progression, not a complete measure of educational quality.
The lower tail includes estimates below 30%
Guinea-Bissau has the lowest reported estimate at 16.05%. Central African Republic follows at 16.75%, South Sudan at 18.13%, Liberia at 21.01%, and Ethiopia at 23.91%. Mozambique, Chad, Malawi, Madagascar, and Uganda are also below 30% in the 2025 modelled series.
| Country or area | 2025 estimate |
|---|---|
| Guinea-Bissau | 16.05% |
| Central African Republic | 16.75% |
| South Sudan | 18.13% |
| Liberia | 21.01% |
| Ethiopia | 23.91% |
| Mozambique | 23.93% |
| Chad | 25.59% |
| Malawi | 26.75% |
| Madagascar | 27.71% |
| Uganda | 28.88% |
UIS notes that a low completion rate can reflect several mechanisms, including late entry, dropout, grade repetition, late completion, or combinations of these factors. The national estimates alone do not identify which mechanism dominates in each country. Explaining a particular low value requires additional evidence on enrolment pathways, school participation, household conditions, conflict, infrastructure, and education policy.
The modelled-data label is particularly important for the lower tail. Household survey observations can be irregular in time and can vary in quality. The modelling approach consolidates multiple data points into a smoother annual trend, reducing sensitivity to whichever survey happened to be most recent. The 2025 figure should therefore be described as a UIS model estimate for 2025, not as the result of one survey conducted that year.
The sorted profile explains the large mean–median gap
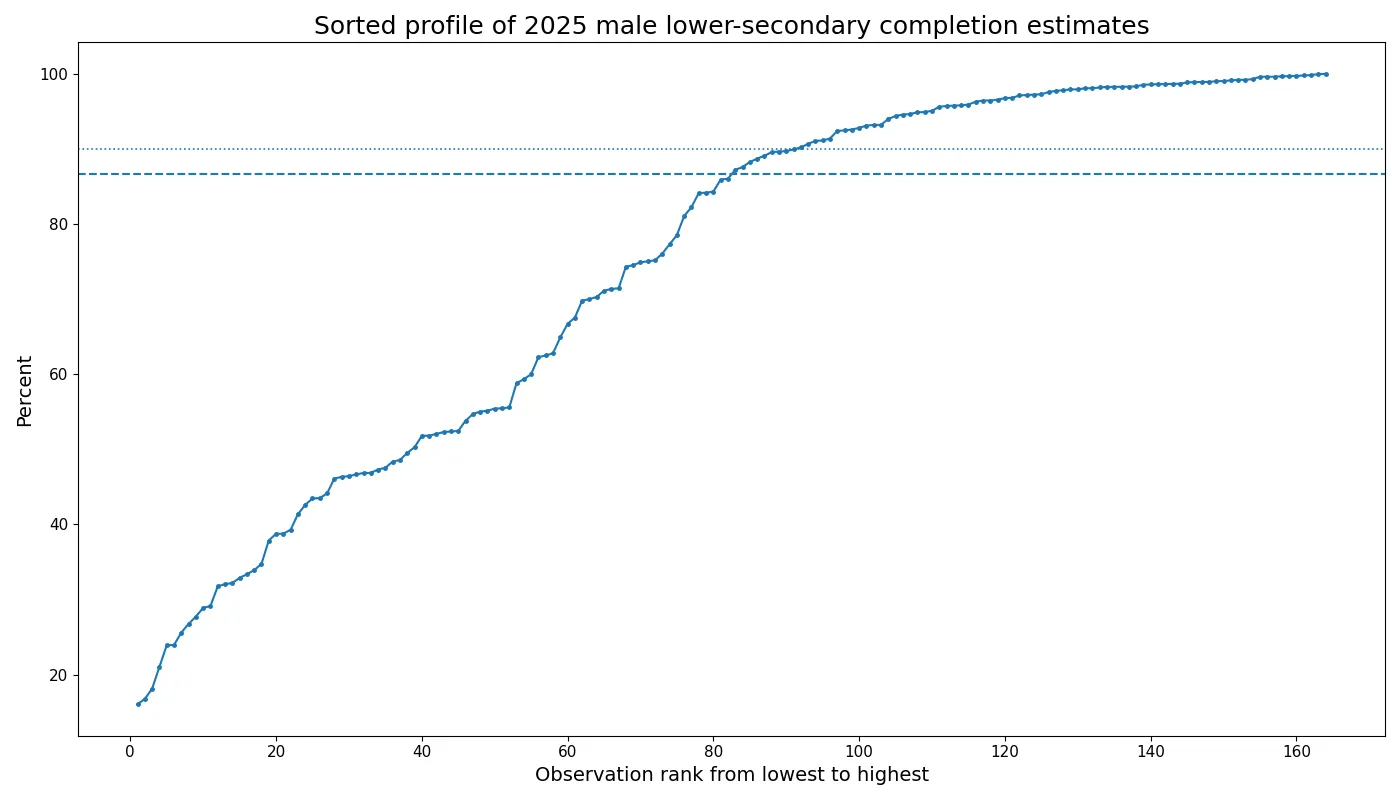
The sorted curve begins around 16%, climbs gradually through the 20s, 30s, 40s, and 50s, and then accelerates toward the 80s and 90s. A large block of estimates is concentrated near the upper end, but the long low tail contains enough observations to pull the arithmetic mean downward. This is why the median of 86.62% is a more useful description of the central rank than the mean alone.
Position within the distribution also adds context to an individual percentage. An 85% estimate is well above the mean but slightly below the median and below a large group of 90%+ observations. A 50% estimate is not simply “24 percentage points below average”; it is also within the lower part of the 164-country distribution. Combining the raw percentage with quartiles and band counts produces a more informative comparison.
Completion rate is not the same as enrolment rate
The completion rate does not measure the share of children who are currently enrolled in lower secondary school. It looks at a somewhat older cohort—three to five years above the intended age for the last grade—and asks whether they completed that level. This design allows the measure to capture students who entered late, repeated grades, or completed later than the official graduation age. It should therefore not be substituted for enrolment, attendance, last-grade intake, or out-of-school indicators.
The M suffix also matters because this is the male series. It cannot establish a gender gap on its own. A gender comparison would require the corresponding female modelled completion rate for the same education level and year. Mixing a male estimate from one series with a female estimate from a different level or reference year would not provide a valid comparison.
Modelled estimates improve annual comparability but remain estimates
UIS modelling helps create a continuous annual series from survey data that are not collected at exactly the same time every year. The approach smooths the underlying completion-rate trend and reduces sensitivity to individual surveys, survey years, and survey types. This is useful when comparing many countries in the same reference year or constructing regional and global aggregates.
At the same time, model estimates depend on the available evidence and methodology. They may be revised when new survey information becomes available or when estimation methods change. For that reason, tiny decimal differences should receive less emphasis than broad bands and persistent gaps. Treating the published values as modelled estimates preserves the distinction between statistical inference and direct administrative enumeration.
Unreported catalogue units are not zero
The 164 reported rows contain no missing values and no official zeros. However, not every country or territory in the UIS catalogue has a 2025 estimate in this extract. Those absent units must remain unreported. Assigning zero to them would manufacture extremely low completion rates and distort the mean, quartiles, and ranking.
Coverage also limits claims about global extremes. The highest and lowest values discussed here are the extremes among the 164 reported estimates, not necessarily among every country and territory in the world. The data provide a broad global comparison, but they are not a complete census of every catalogue unit.
Source and the main 2025 pattern
The indicator definition follows the UNESCO UIS glossary, while the country estimates come from the UIS Data API series CR.MOD.2.M. The values are compared directly in percent, with no zero-filling for countries without a reported estimate.
The central message of the 2025 distribution is the coexistence of very high completion and persistent low-completion groups. The median is 86.62%, yet the first quartile is only 51.99% and the minimum is 16.05%. At the same time, 73 estimates are at least 90% and 55 are at least 95%. Reading the median, quartiles, and band counts together gives a much clearer picture of male lower-secondary completion than a single average or a simple top-to-bottom ranking.
Frequently Asked Questions
What does CR.MOD.2.M measure?
It is the modelled percentage of males in the relevant age cohort who have completed lower secondary education, published by UNESCO UIS.
Is the 2025 value a single survey result collected in 2025?
No. It is a modelled annual estimate that combines information from multiple survey observations rather than a single 2025 survey count.
Should countries without a reported 2025 estimate be treated as zero?
No. Unreported catalogue units must remain missing and should not be converted to zero.
Why is the mean so much lower than the median?
The mean is 74.25% and the median is 86.62%. A substantial group of low estimates creates a long lower tail that pulls the mean downward.
Related Articles
Green Map creates custom-edited map images using open geographic data sources such as geoBoundaries, Natural Earth, OpenStreetMap, and government open data. These maps are edited visual materials, not raw data files, and are provided for education, documents, presentations, and graphic reference.