The 2024 World Bank dataset contains 108 usable country and separately reported economy observations for lower secondary completion, with 109 additional rows left missing at source. The indicator is often read too literally. Its official construction is a gross intake ratio to the last grade of lower secondary education: new entrants to that last grade, regardless of age, are divided by the population at the theoretical entrance age for the grade. It therefore describes the flow into the end of the lower secondary cycle rather than tracking one exact-age cohort from enrollment to graduation.
Across the reported observations, the median is 91.52% and the unweighted mean is 83.84%. Monaco records the highest value at 148.09%, followed by Hong Kong SAR, China at 129.49%, the Turks and Caicos Islands at 116.60%, the Marshall Islands at 114.05%, and Gibraltar at 110.30%. At the other end, Niger is at 11.89%, Malawi at 24.38%, Burkina Faso at 27.88%, Madagascar at 30.94%, and Tanzania at 34.21%. That broad range makes the distribution more informative than a single average.
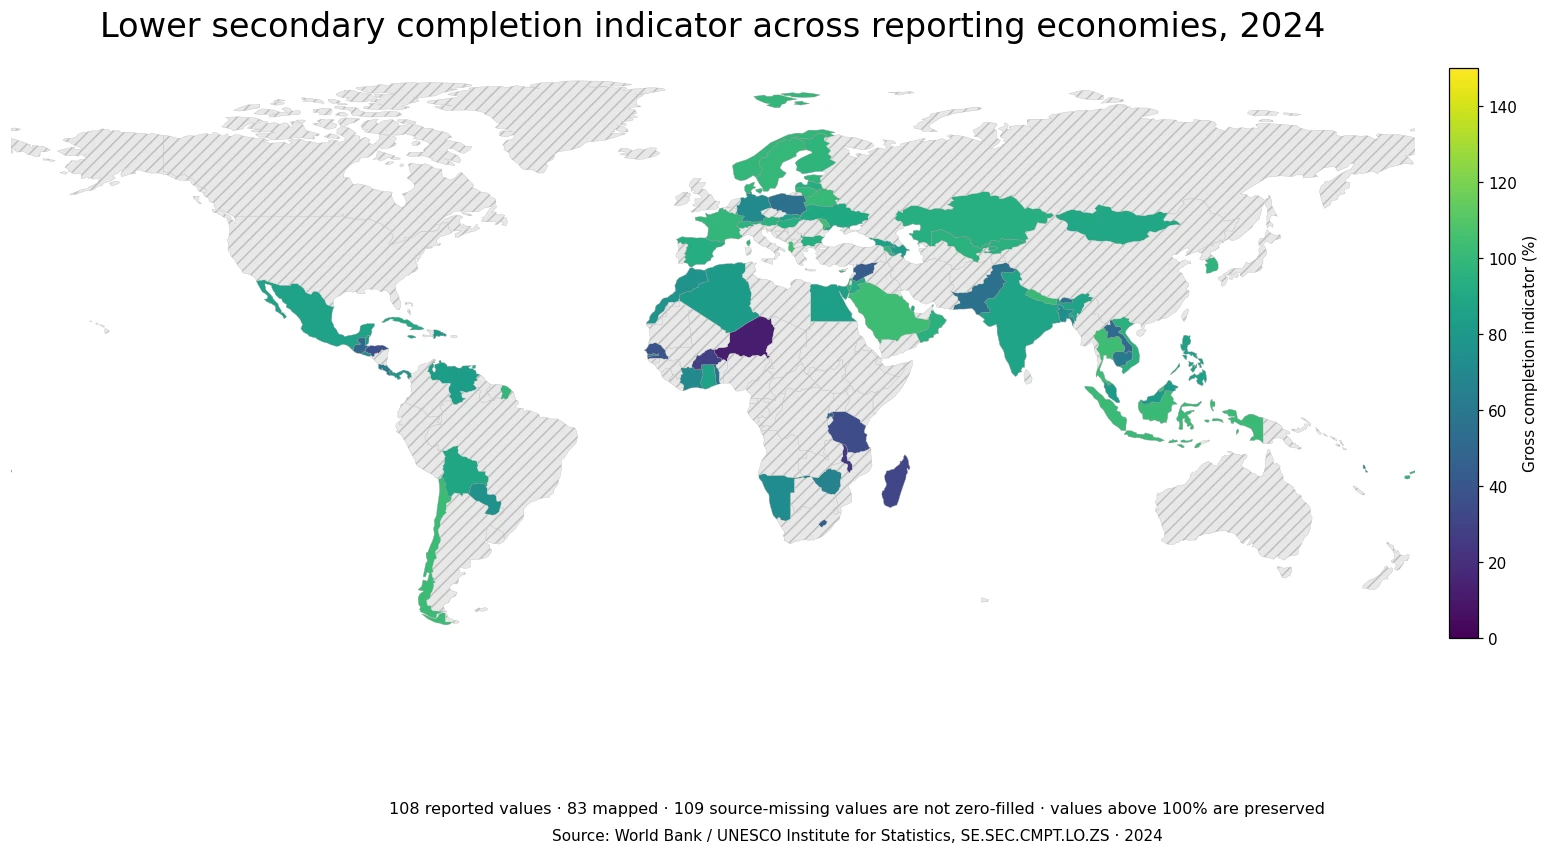
Table of Contents
Why a completion indicator can legitimately exceed 100%
There are 17 reported values above 100%. That does not mean more than 100% of a single cohort literally completed school. The numerator and denominator are not identical populations: entrants to the last grade are counted regardless of their actual age, while the denominator is the population at one theoretical entrance age. Because those two groups need not line up one-for-one, the resulting gross ratio has no strict 100% ceiling. Capping the values at 100 would alter the official series and remove information about the age and cohort structure embedded in the measure.
The very high observations are especially common among small economies and territories, but this dataset alone does not identify the exact reason for each case. Population estimates, the timing of grade entry, cross-border student movement, and other system-specific factors may matter, yet attributing any one cause would require country-level documentation. For a cross-country map, the defensible approach is simpler: preserve the official number, explain the gross-ratio construction, and avoid interpreting an above-100 result as a literal graduation share.
| Economy | Lower secondary completion indicator, 2024 |
|---|---|
| Monaco | 148.09% |
| Hong Kong SAR, China | 129.49% |
| Turks and Caicos Islands | 116.60% |
| Marshall Islands | 114.05% |
| Gibraltar | 110.30% |
| St. Vincent and the Grenadines | 109.88% |
| Brunei Darussalam | 104.98% |
| Albania | 104.21% |
| Moldova | 104.14% |
| Saudi Arabia | 103.54% |
The median is high, but the distribution has a long lower tail
The first quartile is 74.56% and the third quartile is 97.86%, placing half of the reported observations within that interval. 42 economies are at or above 95%, while 55 are at or above 90%. There are 19 observations from 80% to below 90%, 17 from 60% to below 80%, and 17 below 60%. The 100%-plus values attract attention, but the lower tail is equally important: 12 reporting economies are below 50%.
The mean is lower than the median because a set of very low observations pulls the average downward even as values above 100% push it upward. Those opposing tails are why a single mean is an incomplete summary. The figures are also unweighted by population. Niger, India, Monaco, and Indonesia each count as one observation in the cross-country distribution. The result should not be confused with a student-weighted global completion rate, which would require underlying population and enrollment weights.
Many of the lowest reported values are in Sub-Saharan Africa
Niger, Malawi, Burkina Faso, Madagascar, Tanzania, Senegal, Comoros, Lesotho, and Rwanda all appear near the lower end of the 2024 distribution. Their values range from 11.89% to 47.58%. This establishes a geographic concentration of low observations in the supplied data, but it does not by itself reveal why students fail to reach or enter the final grade. Access, progression, household conditions, school supply, conflict, demographic structure, and reporting systems are separate questions that need additional evidence.
The region is far from uniform. Ghana records 85.11%, Namibia 71.91%, Cote d’Ivoire 70.84%, The Gambia 60.04%, and Togo 56.63%. Neighboring and nearby economies can differ by tens of percentage points. A continental average would obscure those local contrasts, while the country-level map makes them visible. The pattern is best treated as a prompt for deeper country analysis rather than evidence that a single regional mechanism explains every outcome.
Central America shows large gaps among nearby economies
Honduras is at 36.56% and Guatemala at 49.29%. Costa Rica is higher at 61.39%, El Salvador at 72.68%, Panama at 78.84%, and Belize at 79.11%. The spread among geographically close countries exceeds 40 percentage points. That alone is enough to reject the idea that a broad regional label can substitute for country-level education data.
Mexico, at 86.60%, is higher than the Central American observations listed above. The indicator still should not be used to infer a specific policy cause from the cross-section. Countries differ in school structures, age profiles, reporting practices, and the sequence by which students reach the final grade. Evaluating policy would require longitudinal evidence and more detailed indicators such as out-of-school rates, transition rates, repetition, gender gaps, and subnational access.
East, Southeast, and South Asia span from about 50% to above 100%
Thailand records 102.80%, Indonesia 101.73%, and Viet Nam 95.21%, while the Philippines is at 84.75%, Malaysia at 81.47%, Cambodia at 61.57%, and Lao PDR at 51.02%. These observations span more than 50 percentage points within a broad geographic area. The map therefore does not support a simple “Asian” level for lower secondary completion; national results are too heterogeneous.
South Asia is similarly varied. Nepal is above 100% at 101.49%, India is at 87.28%, Bangladesh at 73.81%, Bhutan at 56.55%, and Pakistan at 55.82%. Because this is a total national indicator, it cannot show whether the national result reflects urban-rural gaps, gender differences, household income, or regional inequality inside each country. Those dimensions can be crucial for education policy even when the national headline value looks relatively high.
High European values coexist with notable exceptions
Several European observations are near the upper end: Sweden 99.71%, France 99.49%, Norway 99.12%, and Finland 97.85%. Albania and Moldova are above 100% at 104.21% and 104.14%. Yet Germany is at 71.39% and Poland at 55.00% in the supplied 2024 series. These official values should not be silently “corrected” toward neighboring countries simply because they look unexpected.
Unexpected cross-country results are a reason to revisit the indicator definition, not to overwrite the data. Gross ratios can behave differently from familiar graduation percentages, and a single-year observation may reflect country-specific reporting and cohort structures. Without an additional official note for a particular country, this analysis does not assign a causal explanation to an outlier. It reports the value, keeps the year consistent, and distinguishes interpretation from speculation.
This indicator is different from adult educational attainment
Adult attainment measures, such as the share of people aged 25 and older who have completed lower secondary education or above, summarize the accumulated educational history of an adult population. The 2024 completion indicator used here instead focuses on new entrants to the final grade relative to a theoretical-age population. A country can therefore have high adult attainment but a weaker current flow indicator, or a strong current flow indicator alongside a lower stock of adult attainment built up over previous decades.
The distinction matters when comparing this article with other education maps. Similar words such as “completion” and “attainment” do not make two indicators interchangeable. Their denominators, age groups, and policy meanings are different. They can be read together to understand both current progression and the longer-term educational profile, but subtracting one from the other or treating them as repeated measurements of the same population would be misleading.
The 109 missing rows are not zero-completion economies
The source file has 217 country and economy rows for 2024. Only 108 contain an observation; the other 109 remain explicitly missing. Replacing them with zero would manufacture a statement that nobody reached the final grade, depress the mean and median, and color no-data countries as the worst performers. All summary statistics and rankings here therefore use reported values only.
Coverage is a substantive limitation, not a cosmetic one. The article can compare the economies that reported a 2024 value, but it cannot claim a complete ranking of every economy in the World Bank country master. A country absent from a ranking may simply lack a 2024 observation. This is also why a single common year is useful but costly: it improves year-to-year comparability while leaving many economies without a value.
The simplified map draws 83 of the 108 reported observations
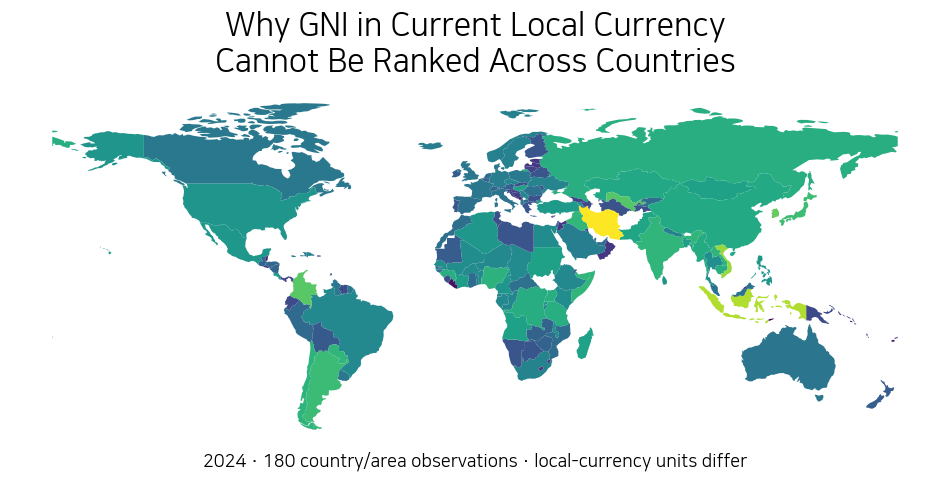
The local low-resolution world boundary joins 83 of the 108 reported values, a match rate of 76.9%. Small islands, city economies, and territories such as Monaco, Hong Kong, the Marshall Islands, Tuvalu, Bahrain, and several Caribbean economies do not appear as separate filled polygons in this boundary file. Their indicator values remain fully included in the numerical analysis and the top or bottom tables.
That cartographic limitation matters because many of the highest values belong to small economies. A reader looking only at the colored land area could miss several top observations. Conversely, large countries occupy more screen space without receiving extra statistical weight. The map is therefore a spatial overview rather than a complete substitute for the table and dataset. Geographic area should not be confused with the number of students or with the importance of an observation.
A one-year completion measure is not a complete education quality score
Reaching the last grade of lower secondary education is an important access and progression outcome, but it does not directly measure what students learned. Learning assessments, literacy and numeracy proficiency, attendance, school resources, and later labor-market outcomes answer different questions. A country can show a high completion-flow indicator while still facing challenges in learning quality, equity, or transition to upper secondary education.
Likewise, a low value does not identify the mechanism behind the result. The indicator does not separate students who left school, entered at different ages, repeated earlier grades, moved across borders, or were affected by disruptions. A causal diagnosis requires additional administrative and household data. The 2024 map is most useful as a screening tool: it shows where the reported flow into the final grade is high, moderate, or low and where further investigation may be worthwhile.
Three rules make the 2024 comparison easier to interpret correctly
First, do not impose a 100% ceiling on a gross ratio. Second, keep source-missing observations separate from real zeros. Third, do not turn a ranking of this specific indicator into a ranking of overall education-system quality. These rules prevent the most common interpretation errors and preserve the meaning of the official series.
Applied together, they produce a clear picture. The median reported value is 91.52%, but the spread is wide. Seventeen observations exceed 100%, while seventeen fall below 60%, and country-to-country differences remain substantial within the same region. Nearly half of the World Bank country and economy rows lack a 2024 observation. The map is therefore a valuable snapshot of reported completion flows, not a universal verdict on education performance.
Source and definition
The source is the World Bank World Development Indicators series SE.SEC.CMPT.LO.ZS, associated with UNESCO Institute for Statistics. The official concept is the gross intake ratio to the last grade of lower secondary education, covering general and pre-vocational programs. It is calculated from new entrants to that grade, regardless of age, divided by the population at the theoretical entrance age to the grade. This analysis uses the supplied 2024 observations and excludes aggregate regional and income-group rows.
The safest wording is therefore “lower secondary completion indicator” or the official indicator name, not a claim about the exact probability that an age-matched child graduates. The series is well suited to comparing how strongly students reach the end of lower secondary schooling across reporting economies, provided its gross construction, missing-data coverage, and one-year scope remain visible.
Frequently Asked Questions
Can the lower secondary completion indicator be above 100%?
Yes. It is a gross ratio: new entrants to the last grade are counted regardless of age, while the denominator is the population at the theoretical entrance age. The two groups are not identical, so values can exceed 100%.
Do the 109 missing 2024 observations mean 0% completion?
No. They are source-missing values, not measured zeros. Replacing them with 0% would create false observations and distort the map and summary statistics.
Does a high value prove that an education system has high quality?
No. The indicator describes progression into the last grade of lower secondary education. Learning outcomes, equity, resources, and education quality require additional measures.
Related Articles
Green Map creates custom-edited map images using open geographic data sources such as geoBoundaries, Natural Earth, OpenStreetMap, and government open data. These maps are edited visual materials, not raw data files, and are provided for education, documents, presentations, and graphic reference.