Petroleum consumption for electricity generation varied sharply across U.S. jurisdictions in 2024. Hawaii recorded 11,802.504 thousand barrels, the highest value among the 50 states and the District of Columbia. Michigan followed with 3,899.384 thousand barrels and Ohio with 2,539.142 thousand barrels. Hawaii alone represented about 40.6% of the combined amount, making concentration the most important feature of the distribution.
The measure is the U.S. Energy Information Administration annual series for “Consumption of Fuels for Electricity Generation (Physical Units)” with the fuel category set to petroleum. Its unit is thousand barrels. It therefore measures a physical quantity of petroleum consumed for electricity generation, not electricity output, sales, generating capacity, cost, or emissions. It is also broader than a series limited to distillate fuel oil, so values from the two fuel definitions should not be treated as interchangeable.
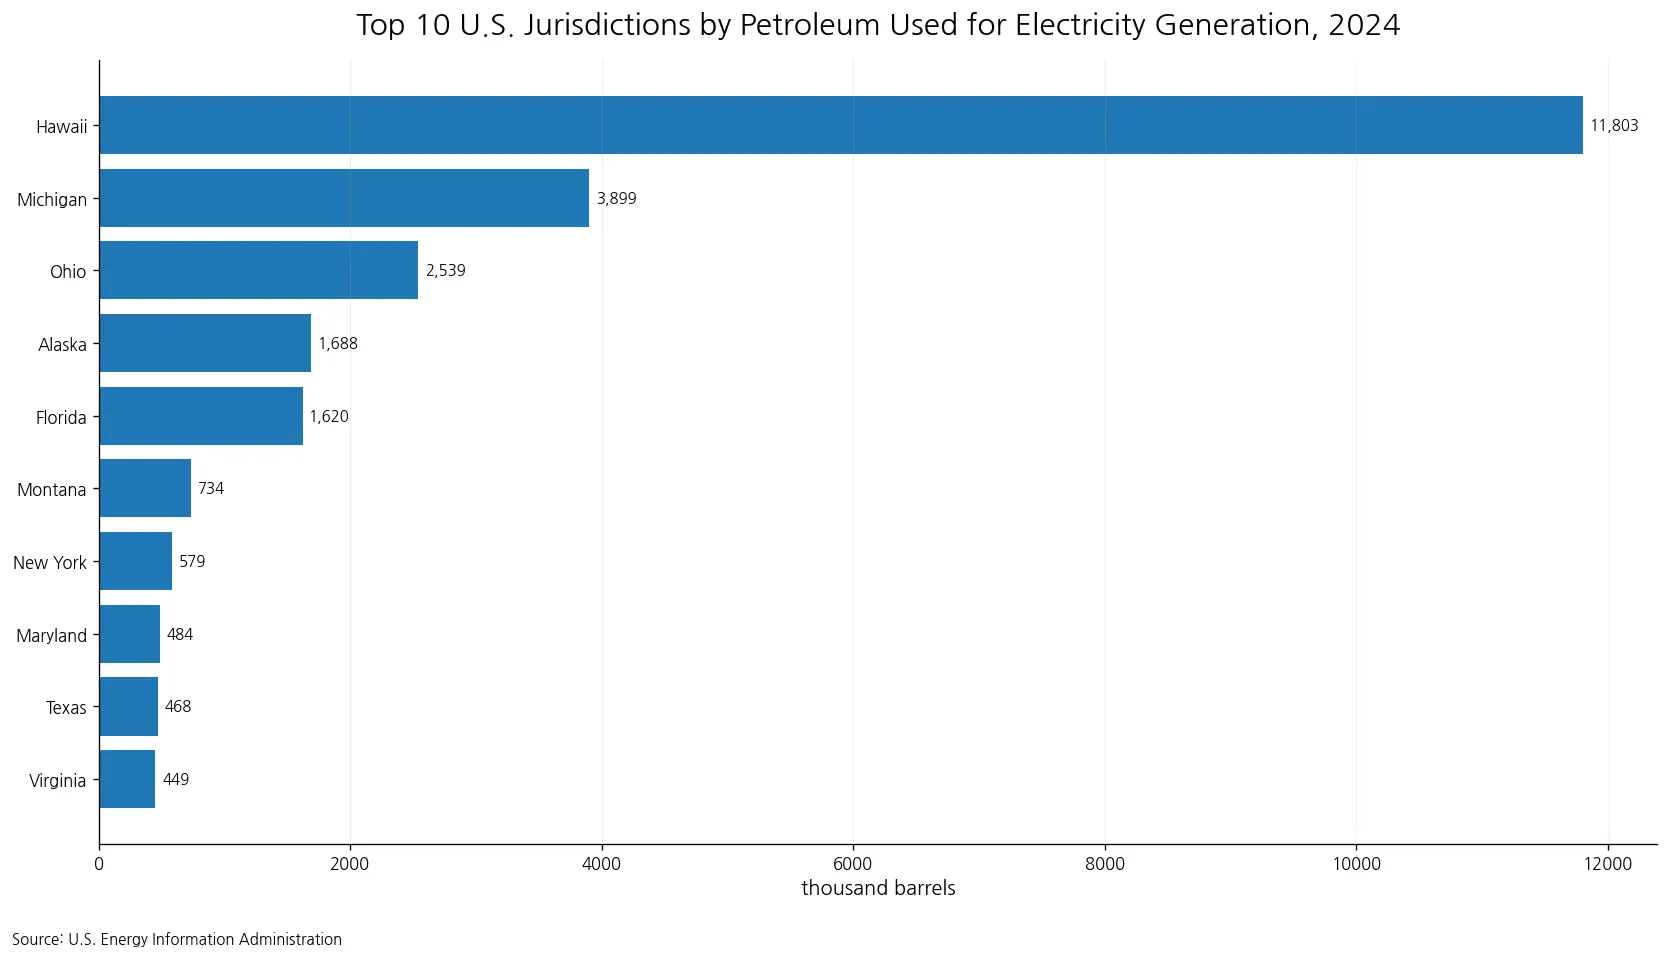
Table of Contents
Hawaii accounted for 40.6% of the 51-jurisdiction total
The 51 observations sum to 29,096.323 thousand barrels. Hawaii accounted for 40.6%, Michigan for 13.4%, and Ohio for 8.7%. Together, the top three jurisdictions represented 62.7% of the total. The top five represented 74.1%, while the top ten reached 83.4%. This is not a distribution in which petroleum use is spread evenly across states; a relatively small group accounts for most of the reported physical volume.
The gap between Hawaii and Michigan was 7,903.120 thousand barrels. That difference alone was larger than Michigan’s entire value. Hawaii’s observation was about 93.8 times the median of 125.810 thousand barrels. Those comparisons make clear that Hawaii is not simply first by a narrow margin; it sits far above the central part of the state distribution.
The top ten show several distinct tiers
The ten highest observations were Hawaii, Michigan, Ohio, Alaska, Florida, Montana, New York, Maryland, Texas, and Virginia. Five jurisdictions exceeded 1,000 thousand barrels, while seven were at or above 500 thousand barrels. The ranking therefore has a very steep upper tail, with Hawaii standing apart, a second group led by Michigan and Ohio, and another step down after Florida.
| Jurisdiction | 2024 petroleum consumption (thousand barrels) |
|---|---|
| Hawaii | 11,802.504 |
| Michigan | 3,899.384 |
| Ohio | 2,539.142 |
| Alaska | 1,687.715 |
| Florida | 1,619.566 |
| Montana | 734.100 |
| New York | 579.388 |
| Maryland | 483.537 |
| Texas | 467.878 |
| Virginia | 449.395 |
Montana, in sixth place, recorded 734.100 thousand barrels, less than half Florida’s 1,619.566. New York followed at 579.388, then Maryland at 483.537, Texas at 467.878, and Virginia at 449.395. These gaps matter because a simple rank can make adjacent positions look more similar than the underlying quantities actually are.
The mean is far above the median
The arithmetic mean across the 51 jurisdictions was 570.516 thousand barrels, compared with a median of 125.810. The mean exceeded the median by 444.706 thousand barrels. The first quartile was 53.219 and the third quartile was 303.077 thousand barrels, so the middle half of jurisdictions fell roughly within that interval.
This difference between mean and median is a classic sign of a right-skewed distribution. A few very large observations raise the average, while most jurisdictions remain well below it. For readers trying to understand a typical position in the distribution, the median is therefore useful. For readers interested in the overall physical volume, the total and mean remain relevant. Using both prevents the high-end observations from being mistaken for the norm.
The bottom ten contributed only about half of one percent
The ten smallest observations summed to only 157.443 thousand barrels, or 0.5% of the total. The District of Columbia recorded 0.064 thousand barrels, Idaho 0.083, and New Mexico 2.011. Combined, all ten lowest jurisdictions amounted to only about 1.3% of Hawaii’s value.
| Jurisdiction | 2024 petroleum consumption (thousand barrels) |
|---|---|
| New Jersey | 48.745 |
| Alabama | 34.699 |
| Oregon | 23.952 |
| Nevada | 12.557 |
| Mississippi | 12.512 |
| Vermont | 11.542 |
| Rhode Island | 11.278 |
| New Mexico | 2.011 |
| Idaho | 0.083 |
| District of Columbia | 0.064 |
A low value should not be interpreted automatically as low electricity demand or as evidence of weak generation infrastructure. The series isolates petroleum consumed for electricity generation. A jurisdiction can generate substantial electricity using other energy sources and still appear near the bottom of this petroleum measure. Electricity imports, plant technology, fuel mix, operating patterns, and reserve or peak-use practices are outside the information contained in this single annual observation.
Petroleum is broader than distillate fuel oil
The EIA publishes related fuel-consumption series with different fuel definitions. A petroleum total and a distillate-fuel-oil measure answer different questions. Distillate fuel oil is a narrower category, while the petroleum facet used here covers the broader petroleum grouping defined in this EIA series. Consequently, a state can have a value in the petroleum series that does not match its distillate-only observation for the same year.
This distinction is especially important when comparing articles or tables that look similar at first glance. The geography and year may be identical, yet the fuel facet changes the metric. A valid comparison therefore requires the same field, unit, fuel category, sector definition, frequency, and year. Mixing those dimensions can create apparent discrepancies that are really differences in what was measured.
Thousand barrels is not a generation metric
The unit also sets a clear boundary around interpretation. Barrels describe a physical quantity of fuel. Megawatthours describe electricity produced or consumed. The two can be related, but they are not the same measurement. Generation technologies have different efficiencies and operating characteristics, so a given quantity of petroleum does not translate into one fixed amount of electricity across all plants and states.
For the same reason, this ranking should not be restated as a ranking of electricity production. A state with extensive natural gas, coal, nuclear, hydro, wind, or solar generation could rank highly in electricity output while using little petroleum. The most accurate question answered by this series is: where was the physical quantity of petroleum consumed for electricity generation largest or smallest in 2024?
The concentration pattern is more informative than a simple winner list
Concentration measures add context to the ranking. Hawaii alone represented 40.6% of the total, the top three 62.7%, and the top ten 83.4%. In contrast, the bottom ten accounted for only 0.5%. The distance between the upper and lower ends is therefore not merely a matter of a few ranking positions; it is a large difference in physical volume.
This pattern also explains why the national-style average across jurisdictions is much higher than the median. A handful of large users pull the mean upward. When comparing a particular state with the rest of the distribution, using the median or quartiles can provide a more realistic reference point than the mean alone. When describing how the total volume is allocated, the top-share figures are more informative.
A single year does not establish a long-term trend
The comparison covers 2024 only. It does not show whether a state’s petroleum use increased or decreased from 2023, whether Hawaii’s share has been stable, or whether the top-ten concentration is rising or falling. Those questions require the same EIA series over multiple years. A one-year cross section can establish relative scale, but it cannot establish a trend.
Even so, the cross section provides a useful benchmark. It identifies the jurisdictions at the high and low ends, quantifies how unusual the largest observation is, and shows the degree of concentration in the total. If additional years are added later, the same statistics can be recalculated to track changes in state positions, concentration, median use, and year-to-year movement.
What this series can and cannot explain
The strongest conclusions are descriptive: Hawaii had the largest 2024 value; Michigan and Ohio followed; the upper tail was highly concentrated; and most jurisdictions were far below the mean. These points come directly from the annual observations. The data do not, by themselves, identify why the state pattern looks this way.
Possible explanatory factors could include fuel availability, generation fleet composition, island or grid characteristics, plant dispatch, emergency generation, and relative prices. But those are hypotheses unless additional evidence is brought in. A causal analysis would need complementary EIA series on generation by source, capacity, heat input, fuel stocks or receipts, and other operating characteristics.
Summary: Hawaii dominates a highly concentrated 2024 distribution
In 2024, Hawaii recorded 11,802.504 thousand barrels of petroleum consumed for electricity generation, representing about 40.6% of the 51-jurisdiction total. The top three represented 62.7%, the top ten 83.4%, and the bottom ten only 0.5%. The mean of 570.516 thousand barrels was more than four times the median of 125.810, reinforcing the same picture of a strongly skewed distribution.
The key interpretive limits are equally important. This is a petroleum-consumption measure in physical units, not electricity generation, efficiency, cost, or emissions. It also uses the broader petroleum fuel category rather than a distillate-only category. Keeping the unit and fuel definition visible makes the state comparison useful without turning it into a claim the data do not support.
Frequently Asked Questions
Which state used the most petroleum for electricity generation in 2024?
Hawaii recorded 11,802.504 thousand barrels, about 40.6% of the 51-jurisdiction total.
Does this measure electricity generation?
No. It measures the physical quantity of petroleum consumed for electricity generation, expressed in thousand barrels.
Is petroleum the same as distillate fuel oil in this EIA series?
No. Petroleum is the broader fuel category, while distillate fuel oil is narrower, so their state values can differ.
Related Articles
Green Map creates custom-edited map images using open geographic data sources such as geoBoundaries, Natural Earth, OpenStreetMap, and government open data. These maps are edited visual materials, not raw data files, and are provided for education, documents, presentations, and graphic reference.