Perry County in southeastern Mississippi is shaped by a broad Piney Woods landscape, a low Leaf River corridor, and small communities separated by miles of forest and stream valleys. New Augusta sits near the county’s central road-and-river crossing, while Richton lies to the northeast and Beaumont to the southeast. This page explains those relationships with boundary, city-connection, water, and elevation views, and the matching original high-resolution A3 JPG map files can be downloaded together as a ZIP archive.
The maps become more useful when they are read as complementary views. The county map establishes US 98, MS 15, MS 42, MS 29, and the principal communities. The city panel measures the straight-line spacing from Richton to New Augusta and Beaumont. Water features reveal a dense network of tributaries around Leaf River, while the elevation map shows why those streams occupy long green valleys between higher ridges. Together they explain a county whose settlements are small but whose physical landscape is highly detailed.
Table of Contents
US 98 and MS 15 tie together three separated community centers
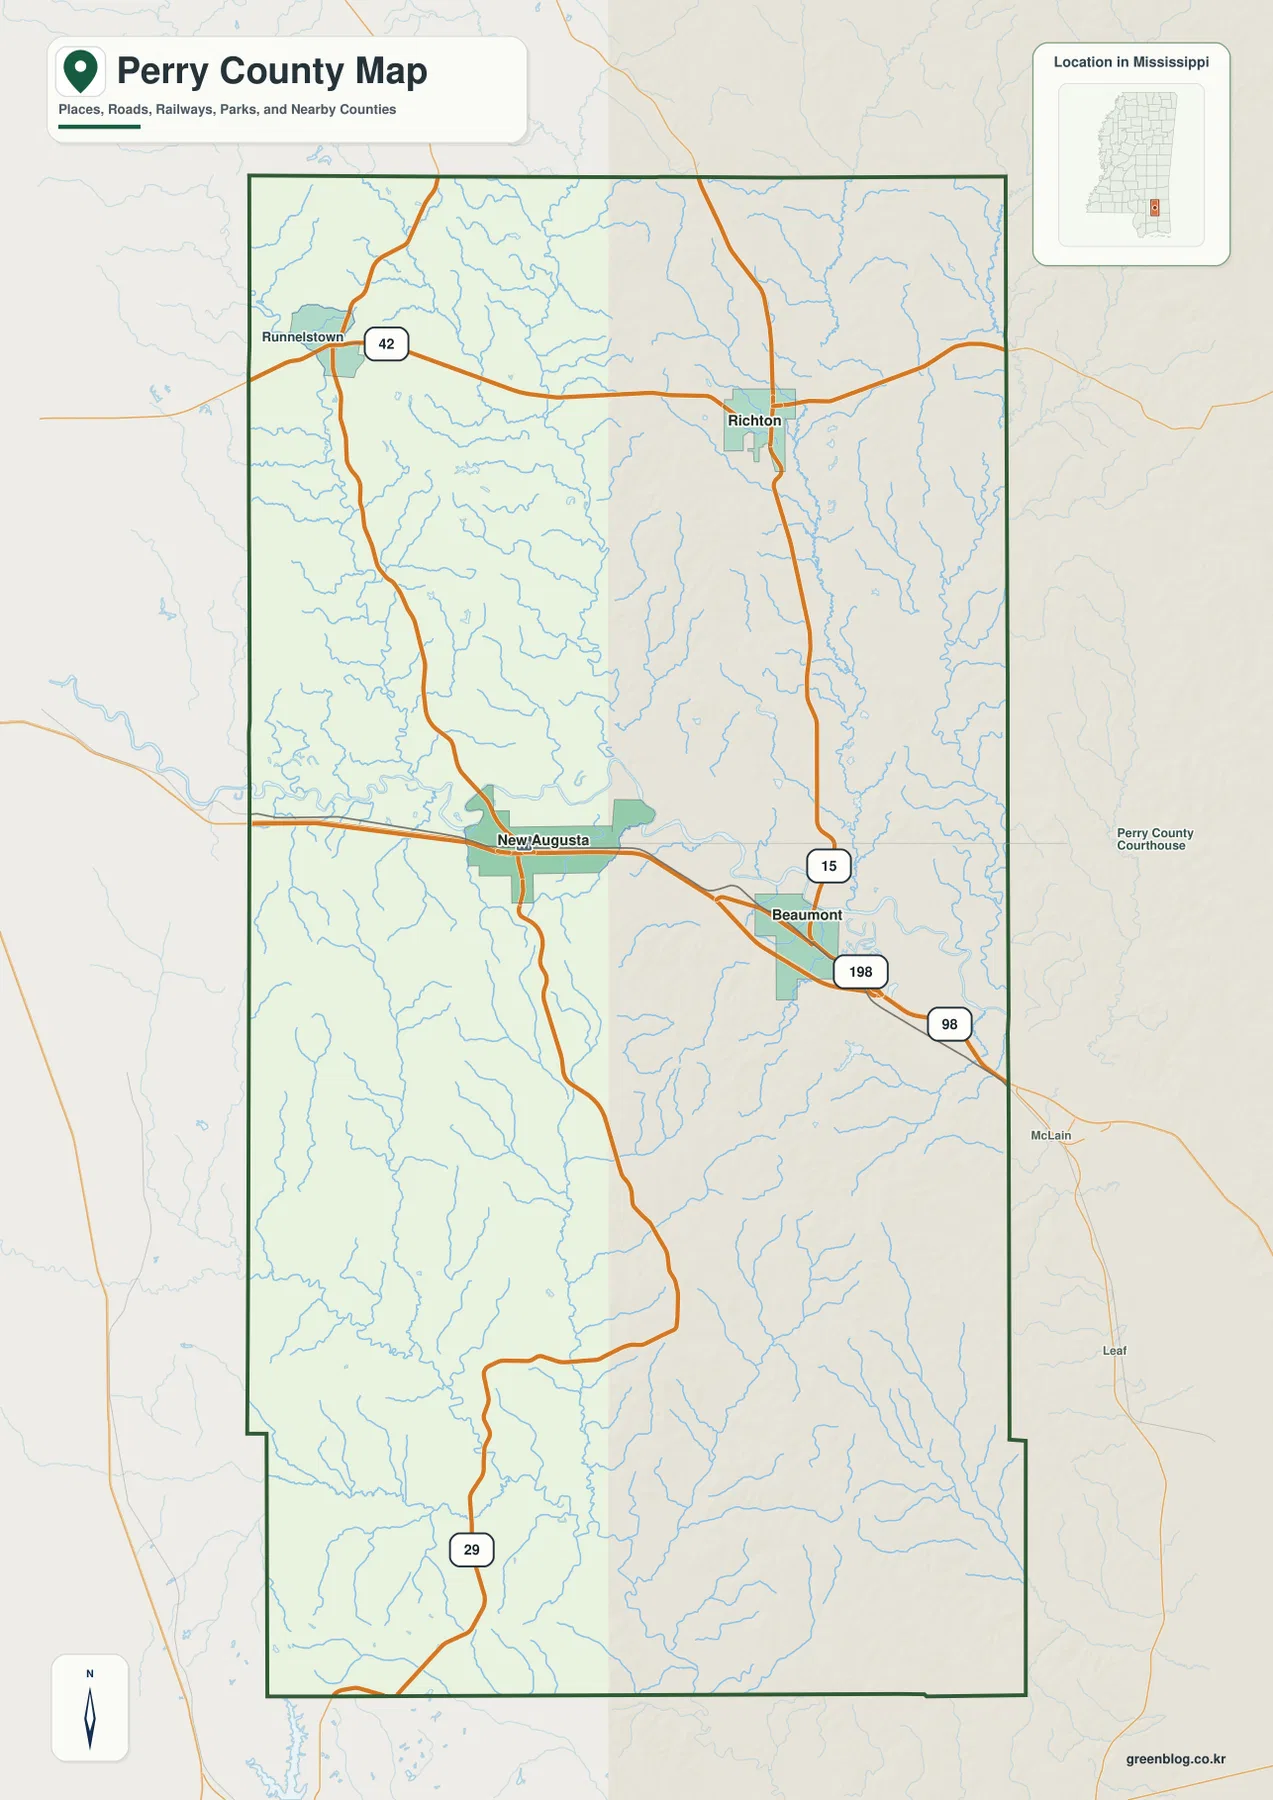
New Augusta is the most useful first reference on the county map because it sits near US 98 and close to the Leaf River corridor. US 98 runs east toward Beaumont and the Greene County side, while Richton is farther northeast where MS 15 meets the northern road network. Beaumont lies below Richton near the US 98 approach. The three communities therefore form a loose triangle rather than a single continuous town corridor.
The northern part of the county has a second east-west line in MS 42, which passes the Runnelstown side and continues toward Richton. Farther south, MS 29 extends through the western half of Perry County. That combination matters because there is no single highway that explains every trip through the county: US 98 is the strongest middle corridor, MS 15 carries north-south traffic on the east side, and MS 29 serves a different southward path through the interior.
Neighbor labels help set the regional frame. Jones County is to the north, Greene and Stone counties are on the eastern side, and Forrest, George, and Wayne counties appear around the west and southwest. The map is designed for county-scale orientation rather than parcel or street-level navigation, so local residential roads and many forest tracks are simplified. Its strength is showing how Perry County fits between those neighbors and where the main communities sit within a long, lightly settled interior.
An 18–117 meter elevation range exposes the river valleys and ridges
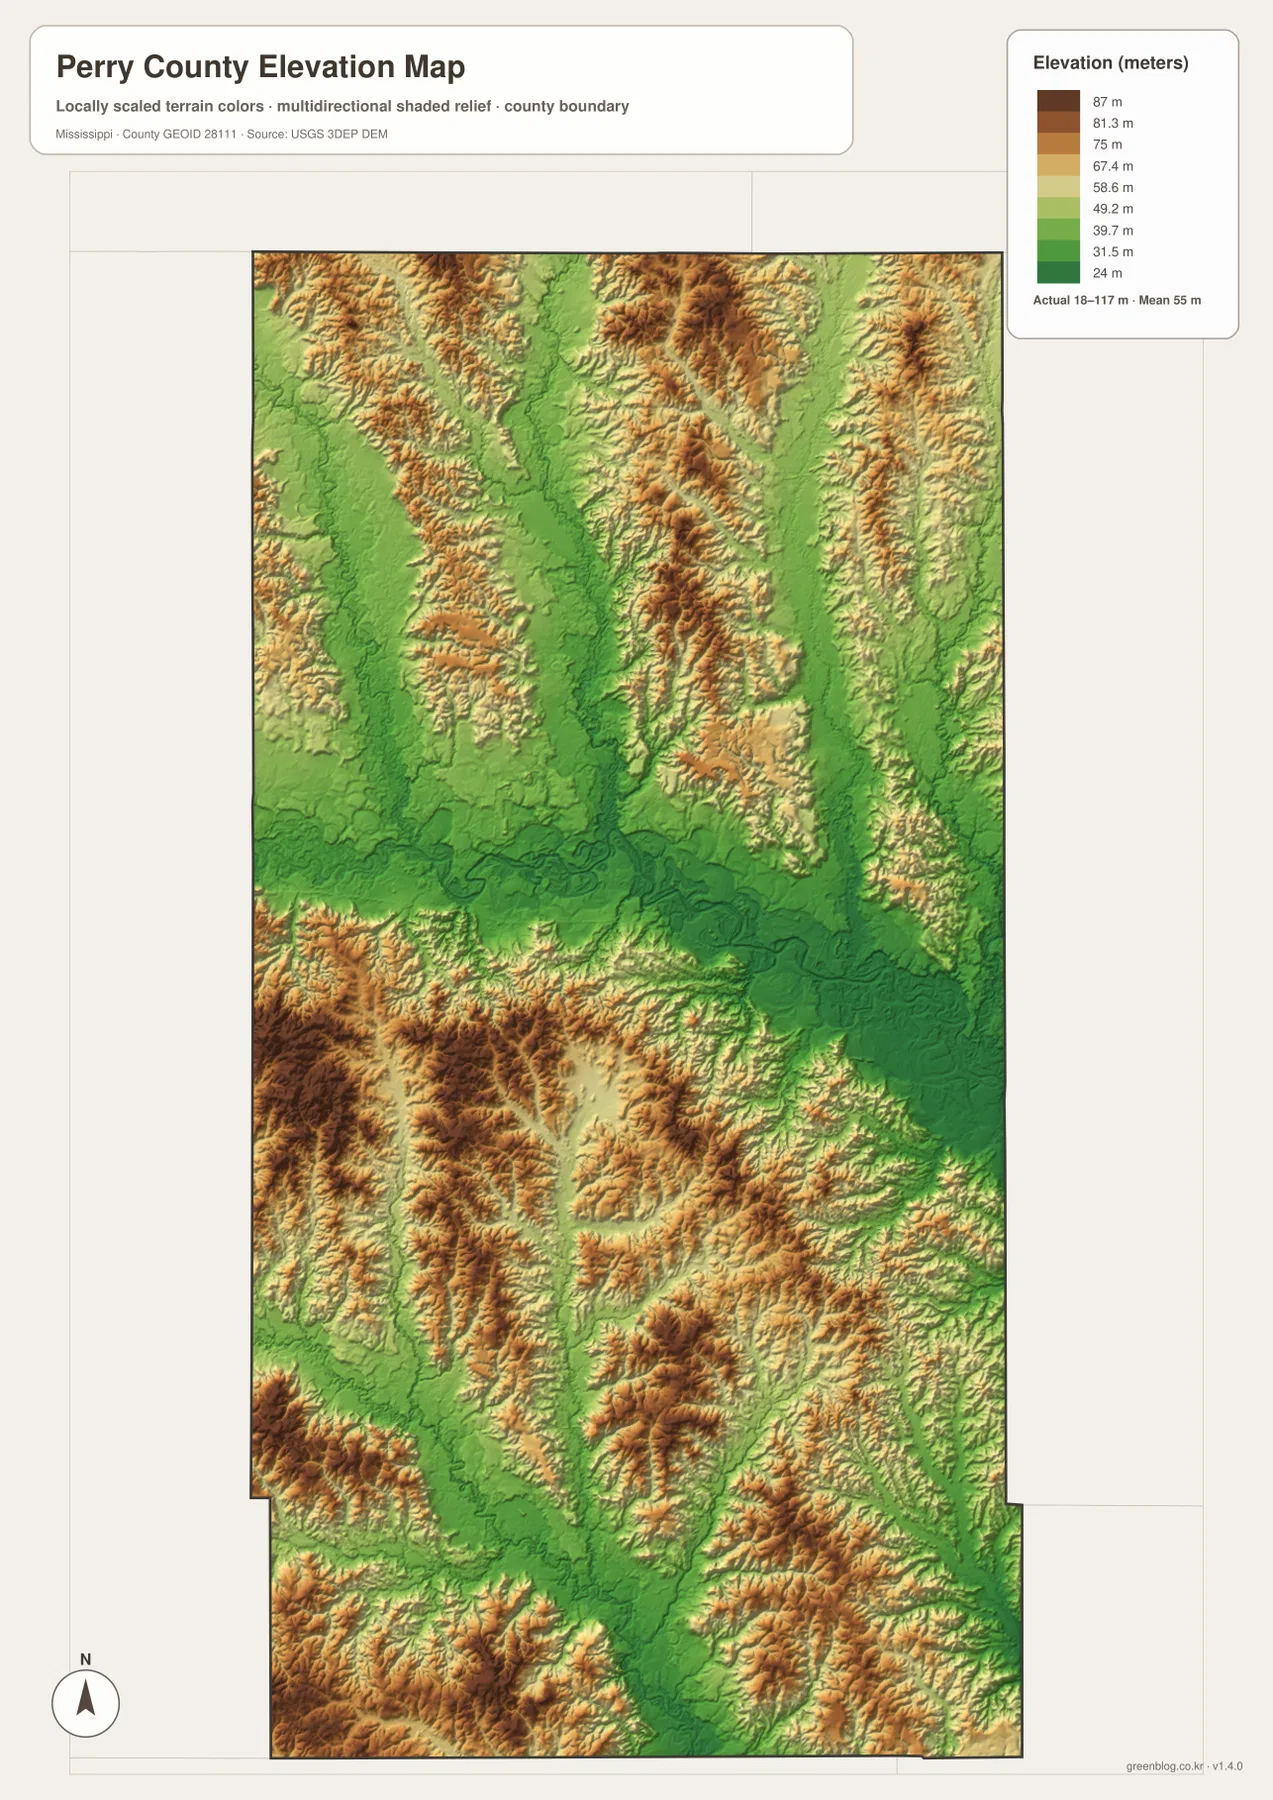
The elevation map reports an actual county range of about 18 to 117 meters and a mean of 55 meters. A broad green lowland cuts across the middle of the county where the Leaf River system passes, and other green fingers extend along tributary valleys. Between them, tan and brown ridges rise through the north, southwest, and south-central parts of the county. The result is a strongly dissected surface rather than a flat forest plain.
This pattern adds physical meaning to the road map. New Augusta is close to the central low corridor, while the routes toward Richton and Beaumont cross a more broken mix of valleys and uplands. The highest-looking ridges are not concentrated in one mountain block; they repeat as narrow, irregular bands between stream systems. That is characteristic of the local Piney Woods terrain visible in the supplied map and helps explain why minor roads often follow indirect paths rather than perfect straight lines.
The elevation surface is generalized for county-scale comparison. It is useful for distinguishing low river corridors from higher uplands, but it is not survey-grade data for a building lot, drainage plan, or engineering design. Precise site work requires more detailed elevation information or a professional survey.
Richton is the city-map hub, with New Augusta and Beaumont about a dozen miles away
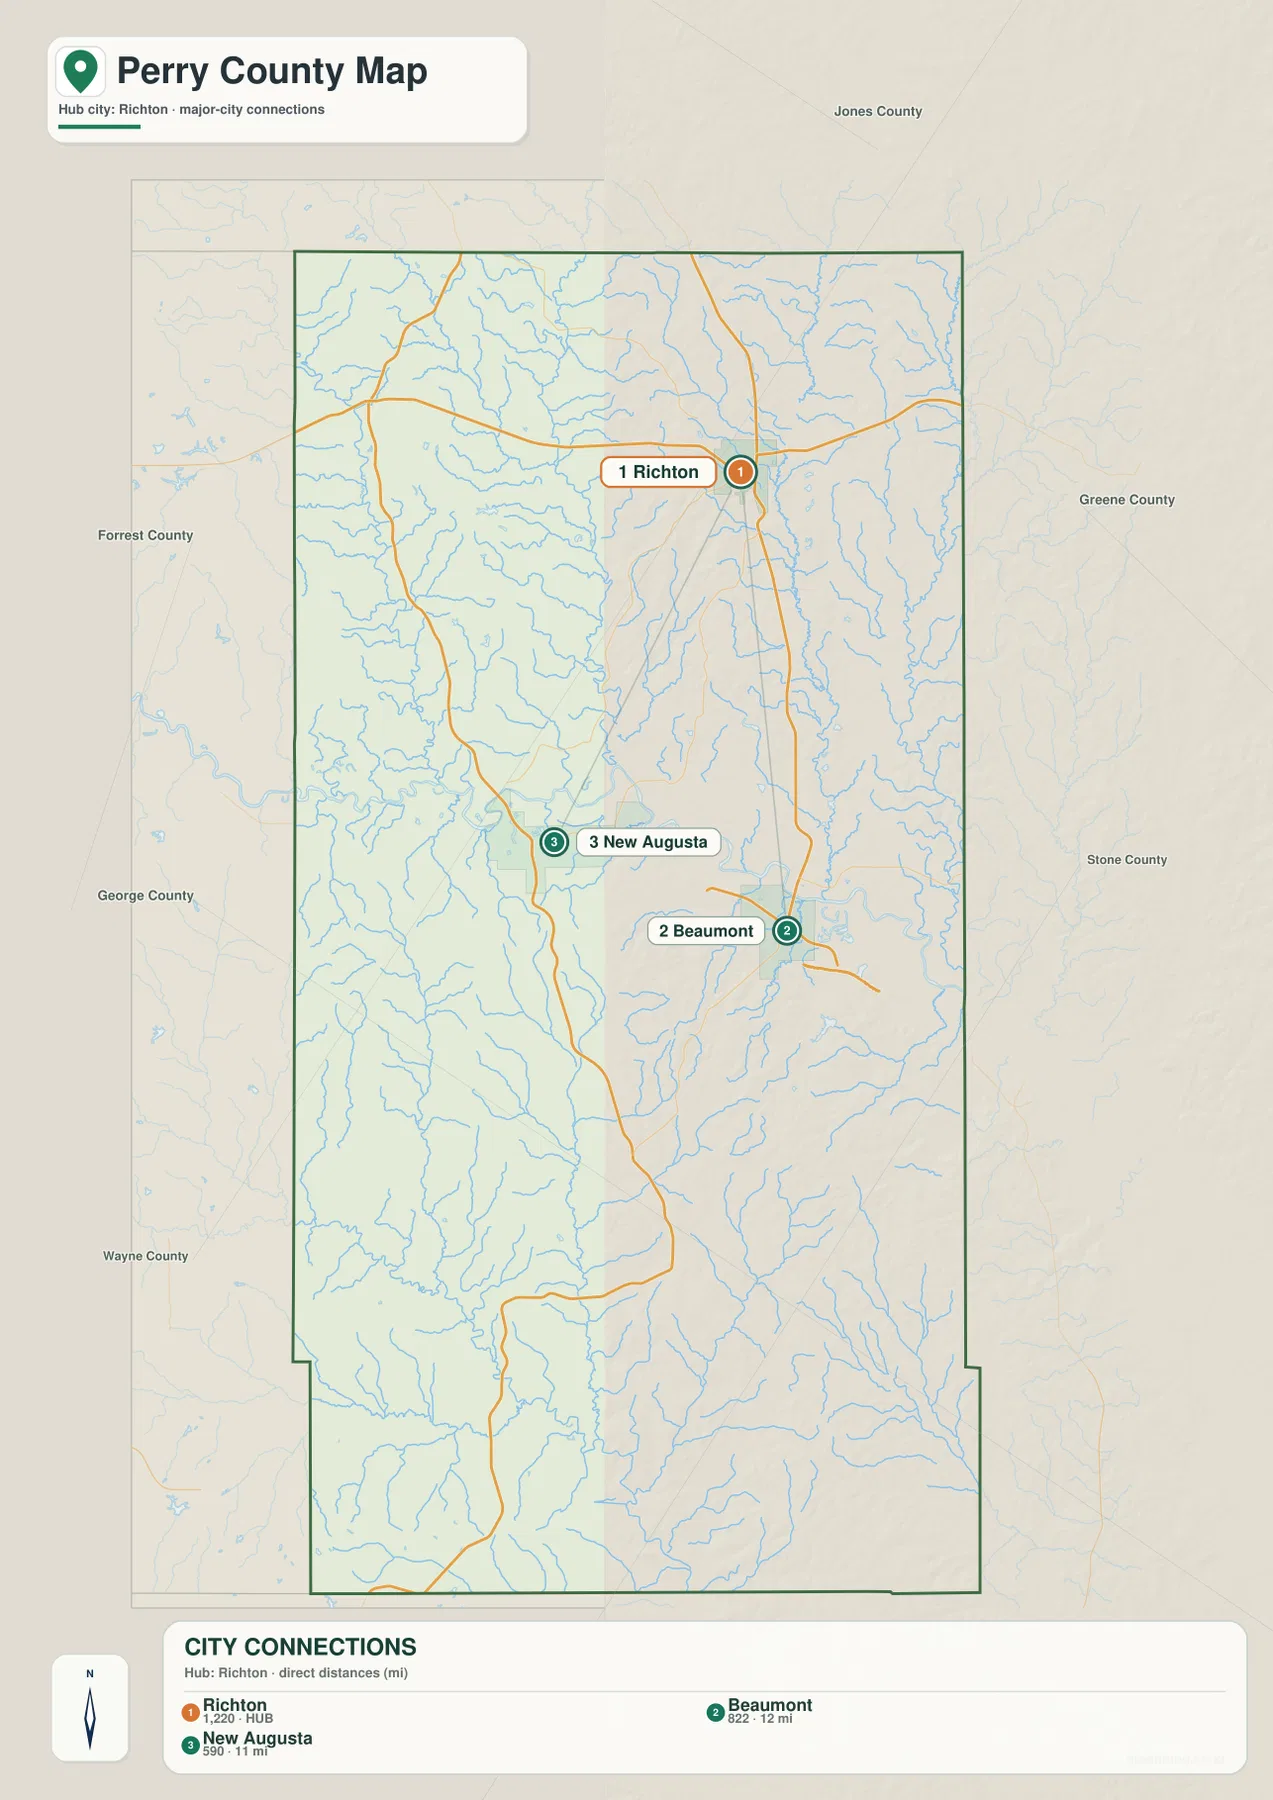
The city map simplifies the county to three labeled centers. Its index shows Richton at 1,220, Beaumont at 822, and New Augusta at 590. Richton is the designated hub in this view; New Augusta is shown about 11 miles away and Beaumont about 12 miles away. Those figures are direct straight-line distances, not driving distances along the road network.
That distinction is important in Perry County because the road pattern and stream valleys can make an actual trip longer than the direct measurement. Richton occupies the northeastern side of the settled pattern, New Augusta anchors the county-seat area closer to the center, and Beaumont sits to the southeast. The city map is therefore best for understanding spacing and direction, while the county map is better for deciding which highways connect the same places.
The small numbers in the city index also fit the larger county geography. Perry County has extensive forest and rural land between its communities, so even the main labeled places remain modest in scale. This makes the location of each center more important than a long list of town names: a reader can orient from Richton toward New Augusta or Beaumont and then use roads, water, and terrain to fill in the space between them.
Leaf River is the main water reference, but small creeks fill the county
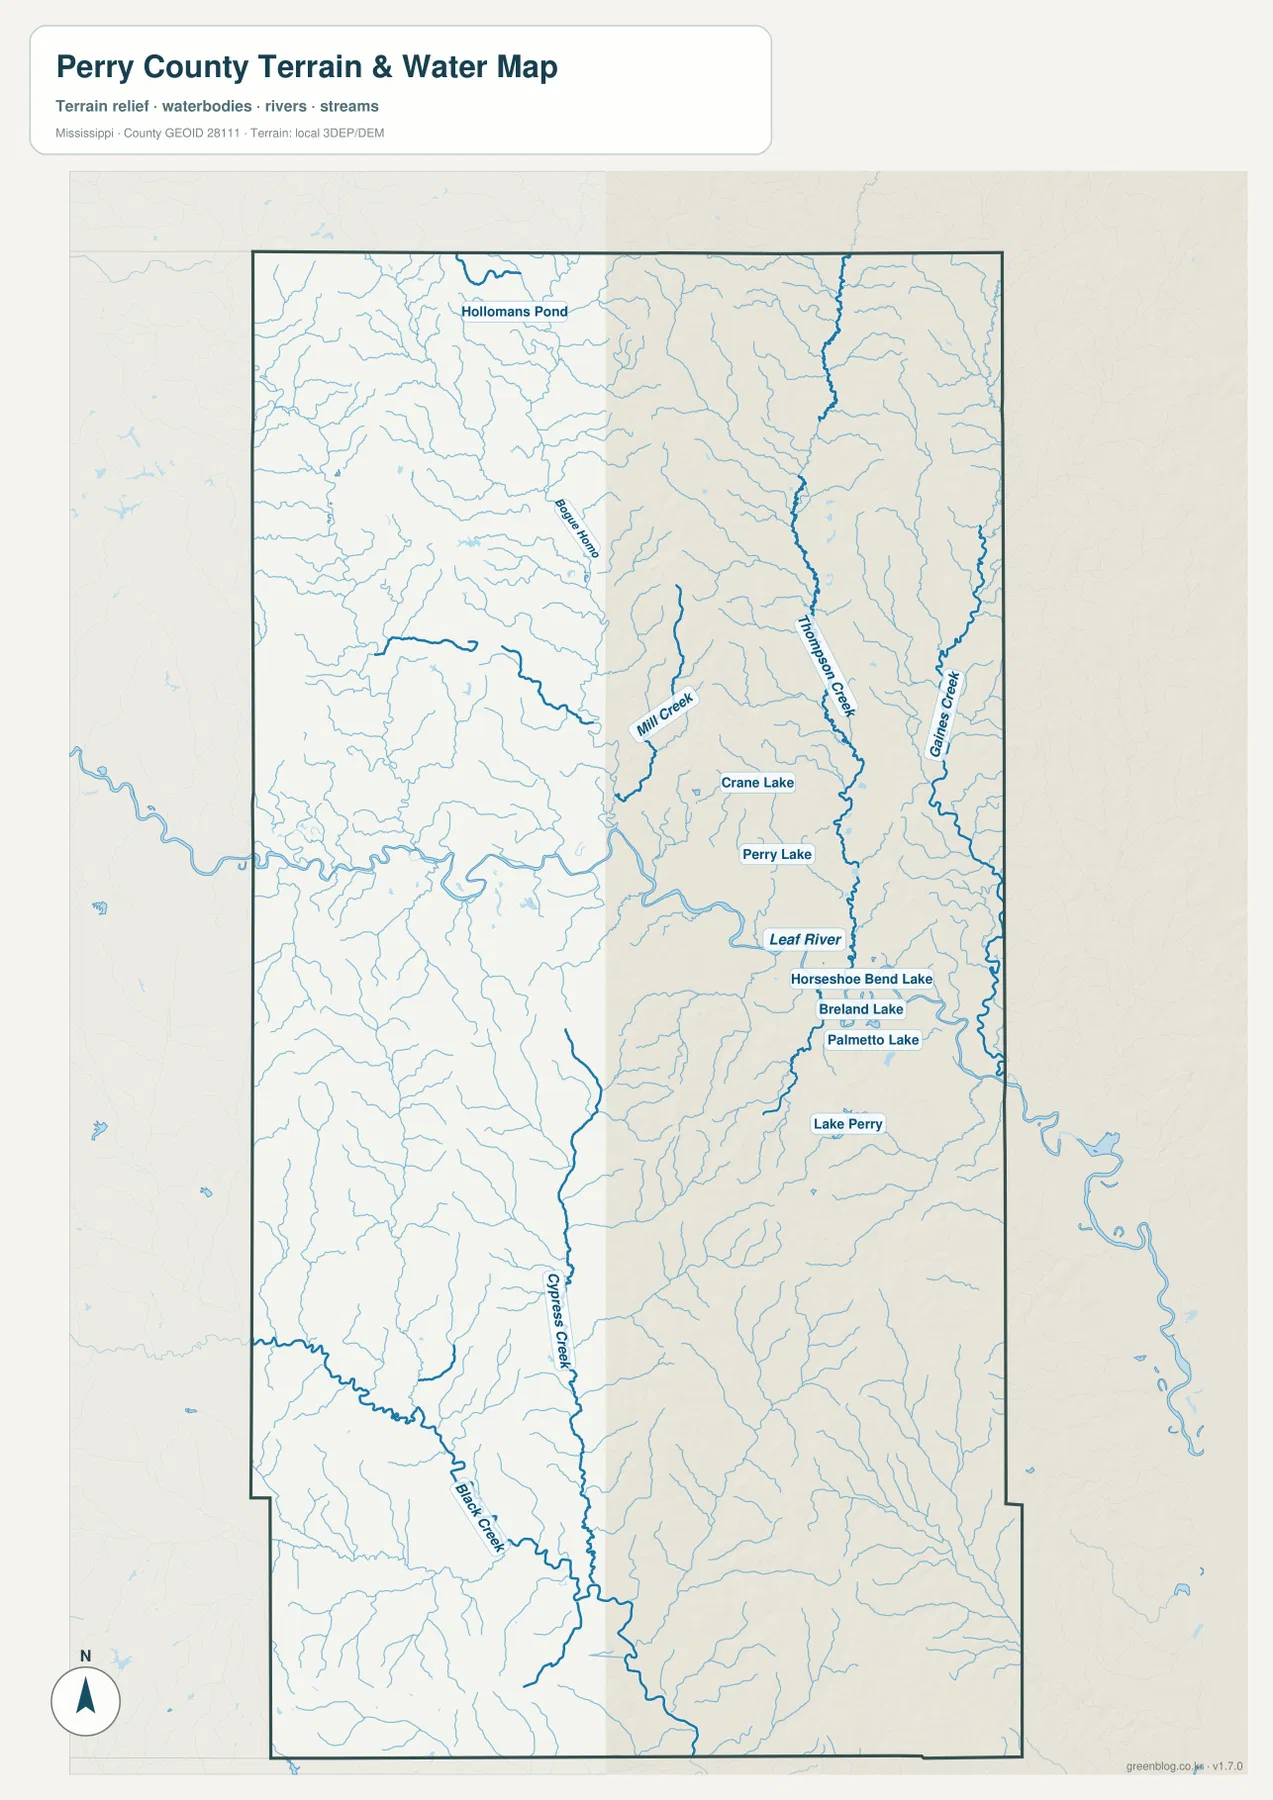
Leaf River provides the clearest large water reference, crossing the middle of Perry County and connecting a wide lowland visible on the elevation map. The supplied water view also labels Thompson Creek and Gaines Creek on the eastern side, Mill Creek near the center, and Cypress Creek farther southwest. Numerous unnamed tributaries branch between them, so the map looks much denser than the highway view even though the county has relatively little open-water area overall.
Several small water bodies give additional landmarks. Hollomans Pond appears in the north, Crane Lake and Perry Lake lie near the central river country, and Horseshoe Bend Lake, Breland Lake, Palmetto Lake, and Lake Perry are labeled farther east and south. Their distribution reinforces the same pattern seen in the relief map: water collects along lower corridors, while the surrounding ridges divide one drainage line from the next.
This map should be read as a county-scale water and terrain reference. A stream symbol does not by itself show flood probability, navigability, property ownership, or a surveyed legal boundary. Anyone making a flood, parcel, or engineering decision should use the appropriate official product. Here, the practical value is seeing where the main river, tributaries, and small lakes sit relative to roads and communities.
A large land area explains the county’s low average population density
| Measure | Value |
|---|---|
| County seat | New Augusta |
| FIPS code | 28111 |
| 2020 census population | 11,511 |
| July 2025 population estimate | 11,577 |
| 2025 Gazetteer land area | 647.274 sq mi |
| 2025 Gazetteer water area | 2.927 sq mi |
| 2020 population divided by 2025 land area | about 17.8 residents per sq mi |
The county’s 647.274 square miles of land provide useful context for the wide spacing on the maps. The 2020 census counted 11,511 residents, and the July 2025 estimate is 11,577. Because those figures represent different reference dates and methods, the later value is best treated as an estimate rather than a second census count. The main takeaway is that the overall population scale remains modest relative to the county’s large land area.
Dividing the 2020 population by the 2025 Gazetteer land area gives about 17.8 residents per square mile. That average should not be interpreted as an even distribution. New Augusta, Richton, Beaumont, and road corridors concentrate settlement, while large stretches of Piney Woods, stream valleys, and land associated with the De Soto National Forest landscape occupy the spaces between them. The maps explain that uneven geography far better than one density number alone.
Start with the map that matches the question
For basic orientation and travel direction, start with the county reference map. It places New Augusta, Richton, Beaumont, Runnelstown, US 98, MS 15, MS 42, and MS 29 in one frame. If the question is specifically about the spacing among the three principal communities, the city map is cleaner because it removes much of the background detail and makes the straight-line distances from Richton easy to compare.
The water map is the stronger choice for explaining Leaf River, the tributary network, and the small lakes that occupy lower ground. The elevation view answers a different question: why the county contains long green valleys between higher ridges. Pairing those two views is especially effective for explaining how drainage and relief fit together, while pairing the road and elevation maps helps show where community centers sit within that terrain.
The images on this page use WebP previews for efficient viewing. For printing, offline reference, or editing, the ZIP below contains the matching original high-resolution JPG maps in an A3 layout. The archive includes the county reference map, city-connection map, water and terrain map, and elevation map.
Frequently Asked Questions
Why does the city map use Richton as a hub if New Augusta is the county seat?
The city-connection view is designed around relative spacing, not administrative status. New Augusta is the county seat, while Richton is used as the hub for comparing the directions and straight-line distances to New Augusta and Beaumont. Reading both maps prevents the hub symbol from being mistaken for a county-seat label.
Are the 11- and 12-mile city distances driving distances?
No. The city map shows approximately 11 miles from Richton to New Augusta and 12 miles from Richton to Beaumont as direct straight-line distances. Road travel can be longer because highways follow crossings, curves, and the local terrain. Use a current road map or navigation service for driving mileage.
Can the water or elevation map be used for flood or site engineering decisions?
No. These maps are county-scale reference products. The water map shows mapped rivers, creeks, ponds, and lakes, while the elevation view summarizes broad relief from about 18 to 117 meters. Flood risk, parcel boundaries, drainage design, and precise site elevation require dedicated official datasets or professional survey work.
Map File Information
The Perry County map set is packaged as original high-resolution A3 JPG files for printing and reuse.
- Included Files: 4 JPG maps
- File Type: JPG
Related Maps
Sources and References
- U.S. Census Bureau QuickFacts – reference for the 2020 population and July 2025 estimate.
- U.S. Census Bureau 2025 Gazetteer Files – reference for county land and water area.
- Mississippi Department of Transportation official highway map – reference for major federal and state routes.
- USGS National Hydrography – official reference for rivers, creeks, and mapped water features.
- USGS 3D Elevation Program – official reference for elevation data.
- De Soto National Forest – regional Forest Service reference for the surrounding Piney Woods landscape.
Green Map creates custom-edited map images using open geographic data sources such as geoBoundaries, Natural Earth, OpenStreetMap, and government open data. These maps are edited visual materials, not raw data files, and are provided for education, documents, presentations, and graphic reference.