Lauderdale County sits in the far western part of Tennessee, where the landscape changes noticeably between the Mississippi River lowlands and the higher ground to the east. Ripley, the county seat, is the most useful starting point on the map. From there, Halls lies to the north, Henning to the south, and Gates toward the northeast. This page brings the county boundary, roads, town connections, water features, and elevation into one place, and the A3 high-resolution JPG map files are available to download for printing, schoolwork, presentations, or reference.
The county is especially interesting because its western and eastern halves do not look alike. Near the Mississippi River, the terrain is broad, low, and crossed by old channels, lakes, and wetlands. East of Ripley, the ground rises into a much more textured belt of ridges and valleys. Comparing the general map with the water and elevation maps makes that contrast easy to see and also helps explain why towns and major roads are concentrated away from much of the river-edge lowland.
Table of Contents
Ripley, the county boundary, and the main road pattern
On the county map, Ripley appears a little east of the county’s midpoint and serves as the clearest road hub. Halls is farther north, Henning is south of Ripley, and Gates is near the northeastern side. The map is not crowded with every local street, so the larger routes remain easy to follow. That is useful when the goal is to understand the county as a whole rather than navigate a single neighborhood.
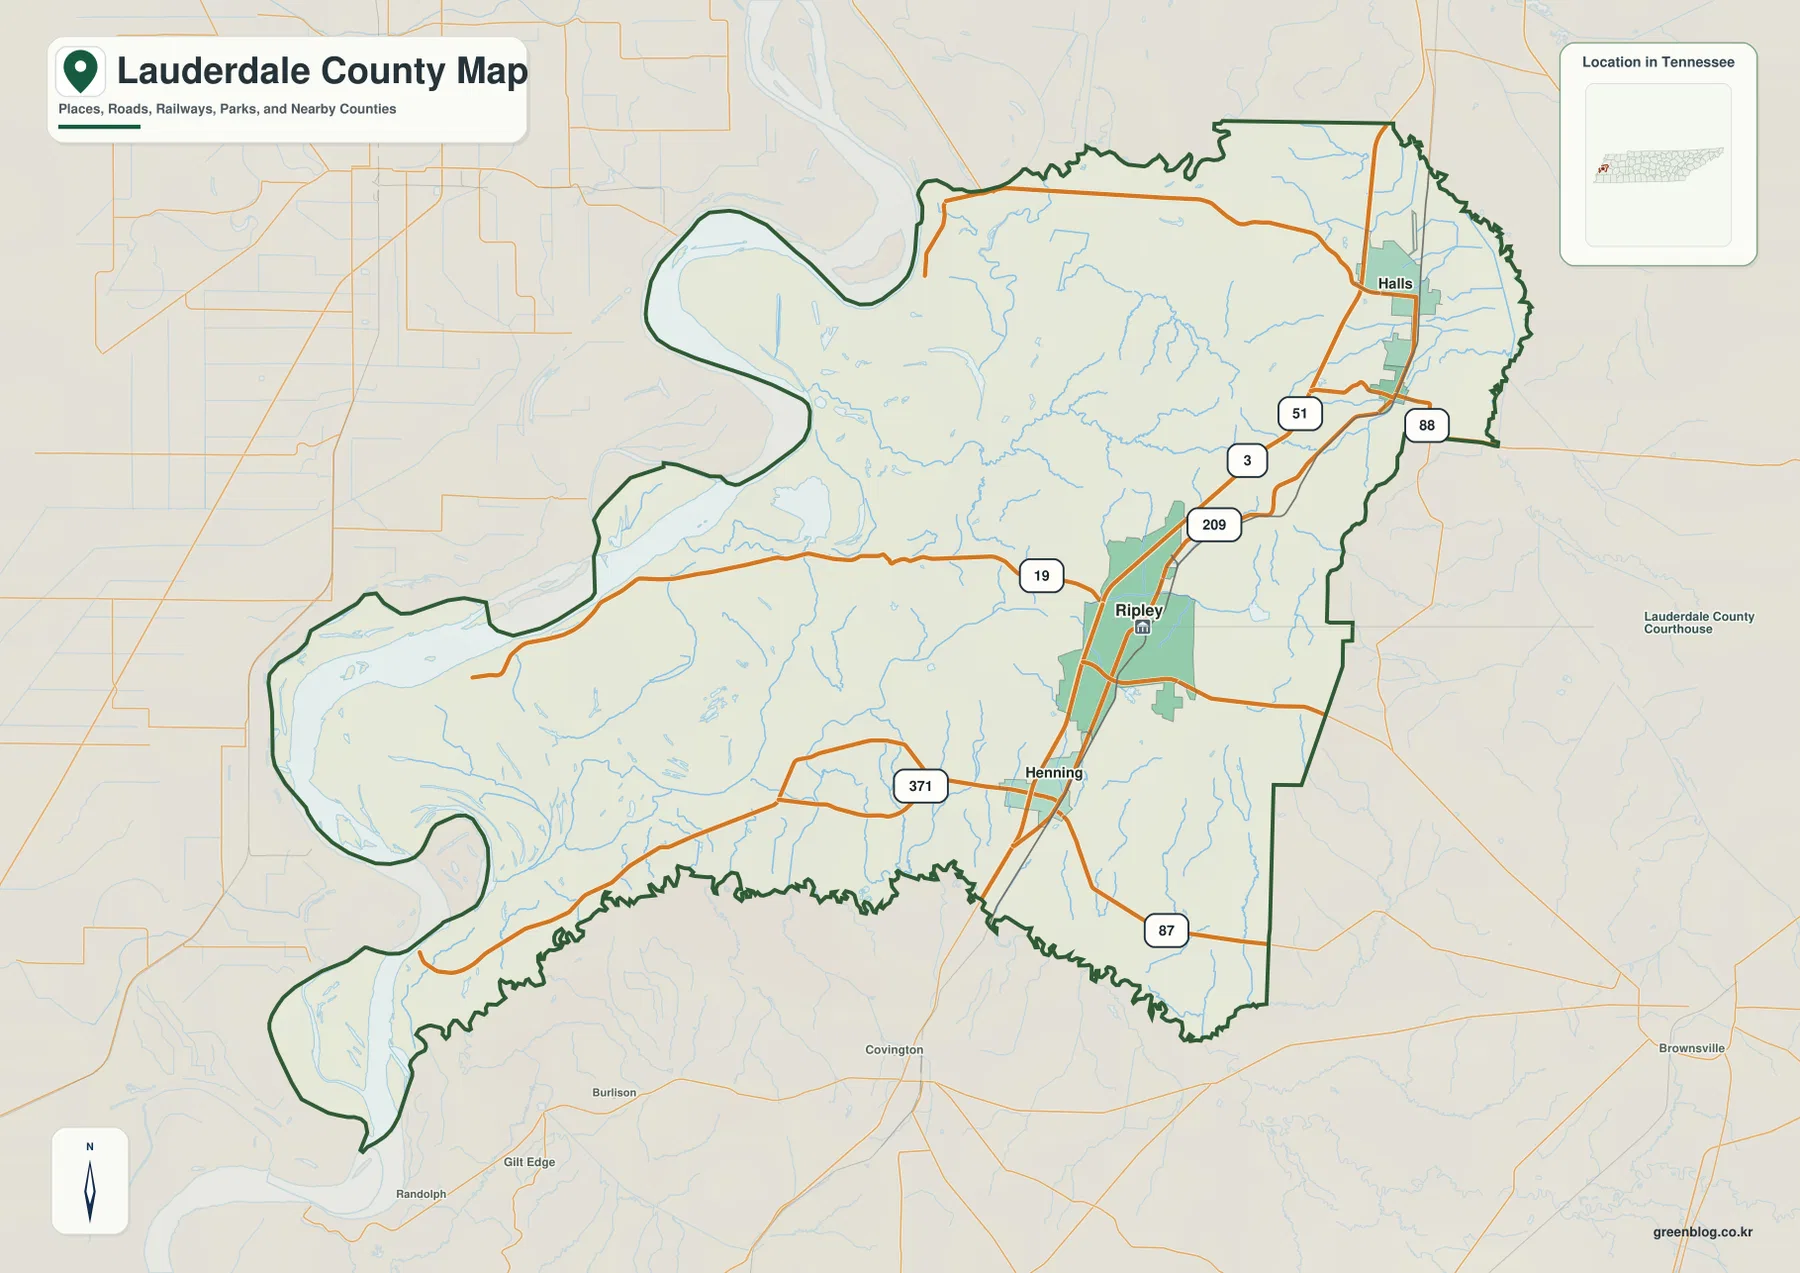
US 51 is the most obvious north-south route through the Ripley-Halls side of the county. Tennessee 19 heads west from Ripley toward the Mississippi lowland, while Tennessee 87 crosses the southern part near Henning and continues toward the eastern boundary. Tennessee 88 is visible around Halls, and other numbered roads connect Ripley with smaller communities and the outer edges of the county. These routes are easiest to understand as links between towns and landscape zones rather than as an isolated list of highway numbers.
The western boundary has deep curves and projections instead of a simple straight line. That shape reflects a county edge closely tied to the Mississippi River and its floodplain environment. The eastern side is more regular, but the terrain just inside it is more uneven. Looking across the full map, Lauderdale County is therefore better described as a meeting place of river lowland and inland upland than as a uniformly flat county.
How Ripley, Halls, Henning, and Gates are arranged
The city-connection map strips away some background detail so the relationship among the four labeled towns is immediately visible. Ripley is marked as the hub. Halls is north of it, Henning is to the south, and Gates is northeast of Ripley and southeast of Halls. The distances printed on this map are direct distances from Ripley, not turn-by-turn driving mileage, so they are best used to compare relative spacing.
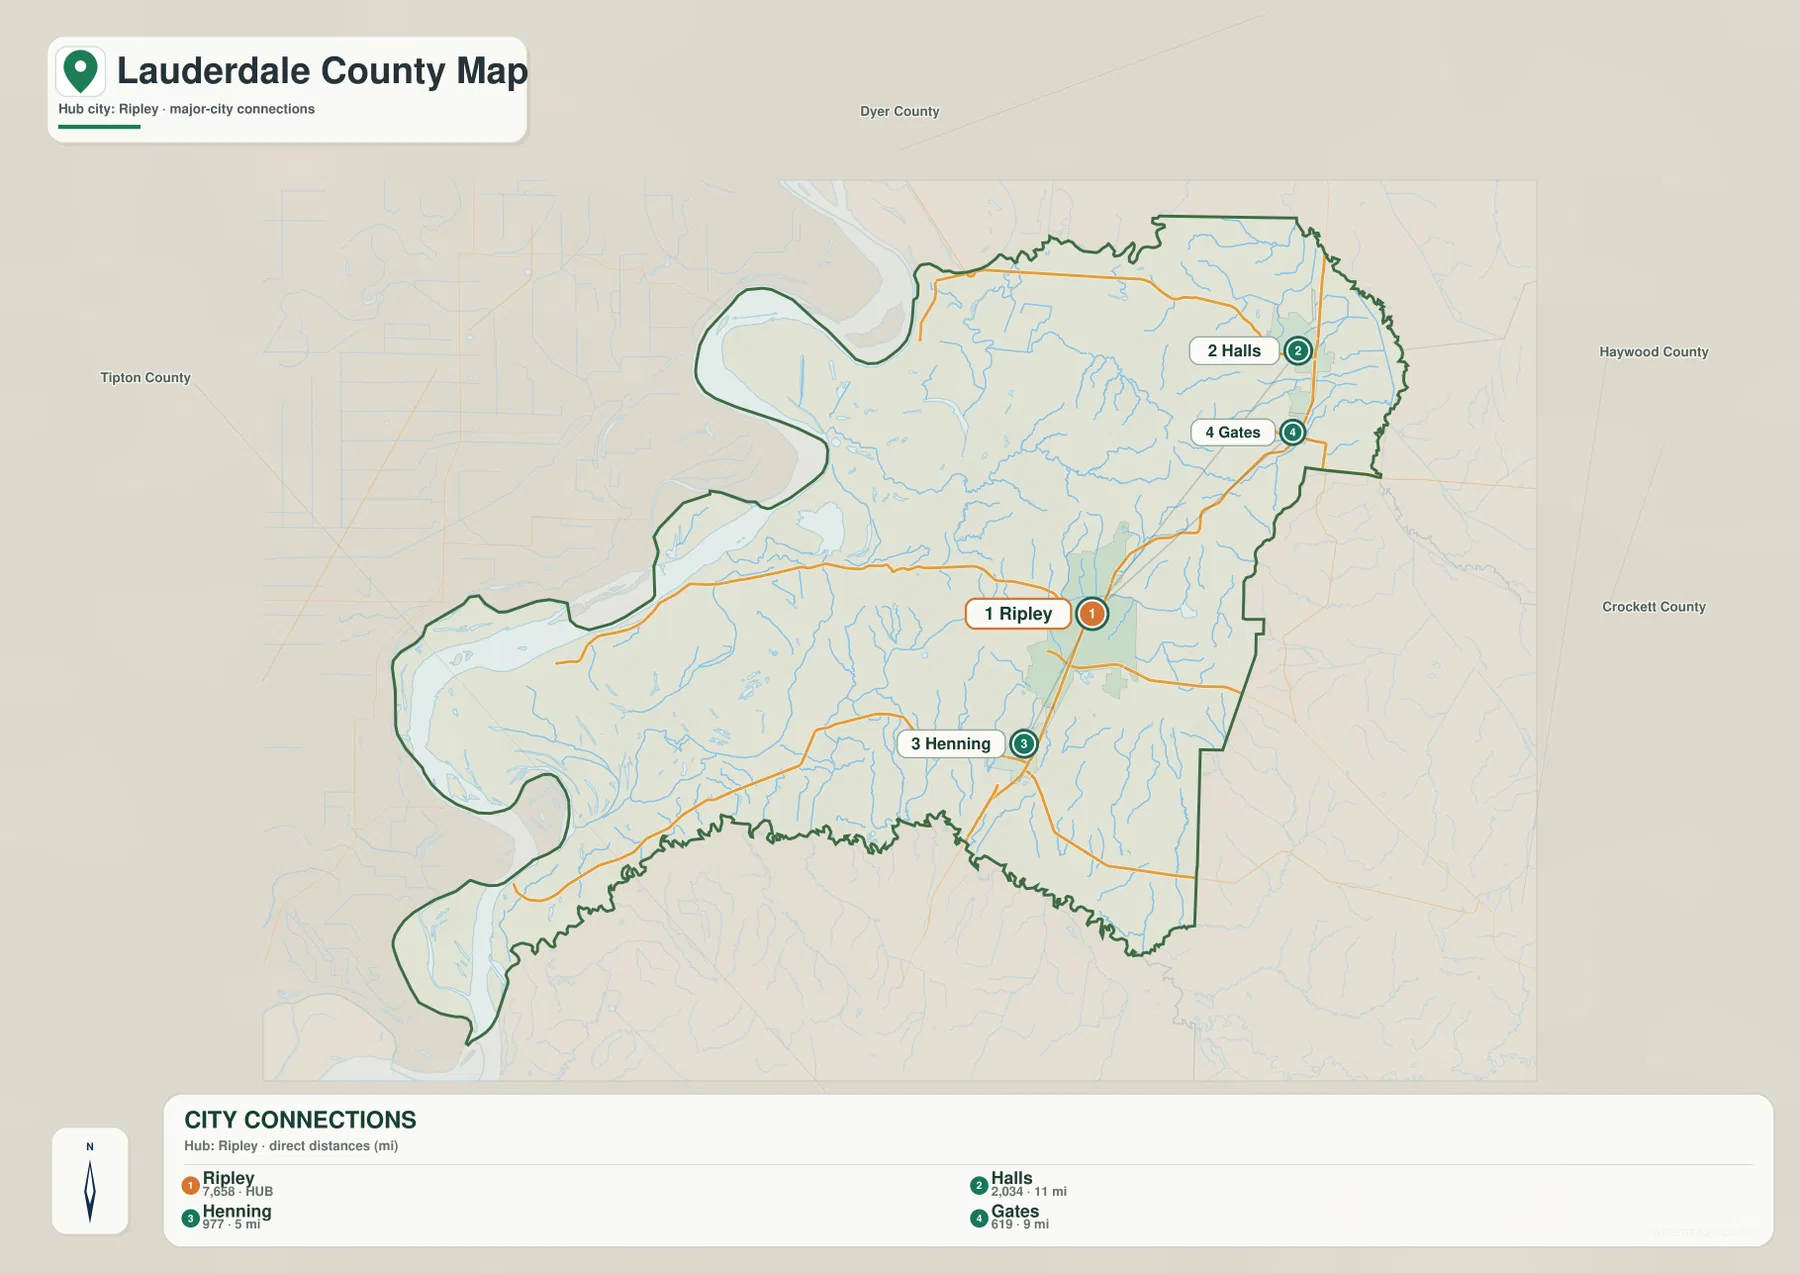
This simplified view also reveals where the named settlement pattern is concentrated. Ripley, Halls, Henning, and Gates all sit well east of much of the Mississippi River floodplain. The broad western section occupies a large part of the county outline, but it carries fewer town labels on this map. That does not make it empty; instead, the water map shows why this part of the county has a very different physical character.
For a classroom map or a regional comparison, the town map is a good first layer. Once the four towns are located, the road map can be added to show how they connect. The water and elevation maps then explain why some routes follow the higher interior rather than cutting directly across the lowest river terrain.
The Mississippi River lowland and the Forked Deer system
The terrain-and-water map gives the western side of Lauderdale County much more detail. The Mississippi River dominates the edge of the county, but it is only one part of a complicated water landscape. Lost Lake, Open Lake, Sunk Lake, Fletcher Lake, Crutcher Lake, Blue Pond, and Whale Pond are among the labeled waters in the low western portion. Their distribution shows a floodplain shaped by active and former river channels rather than a single clean shoreline.
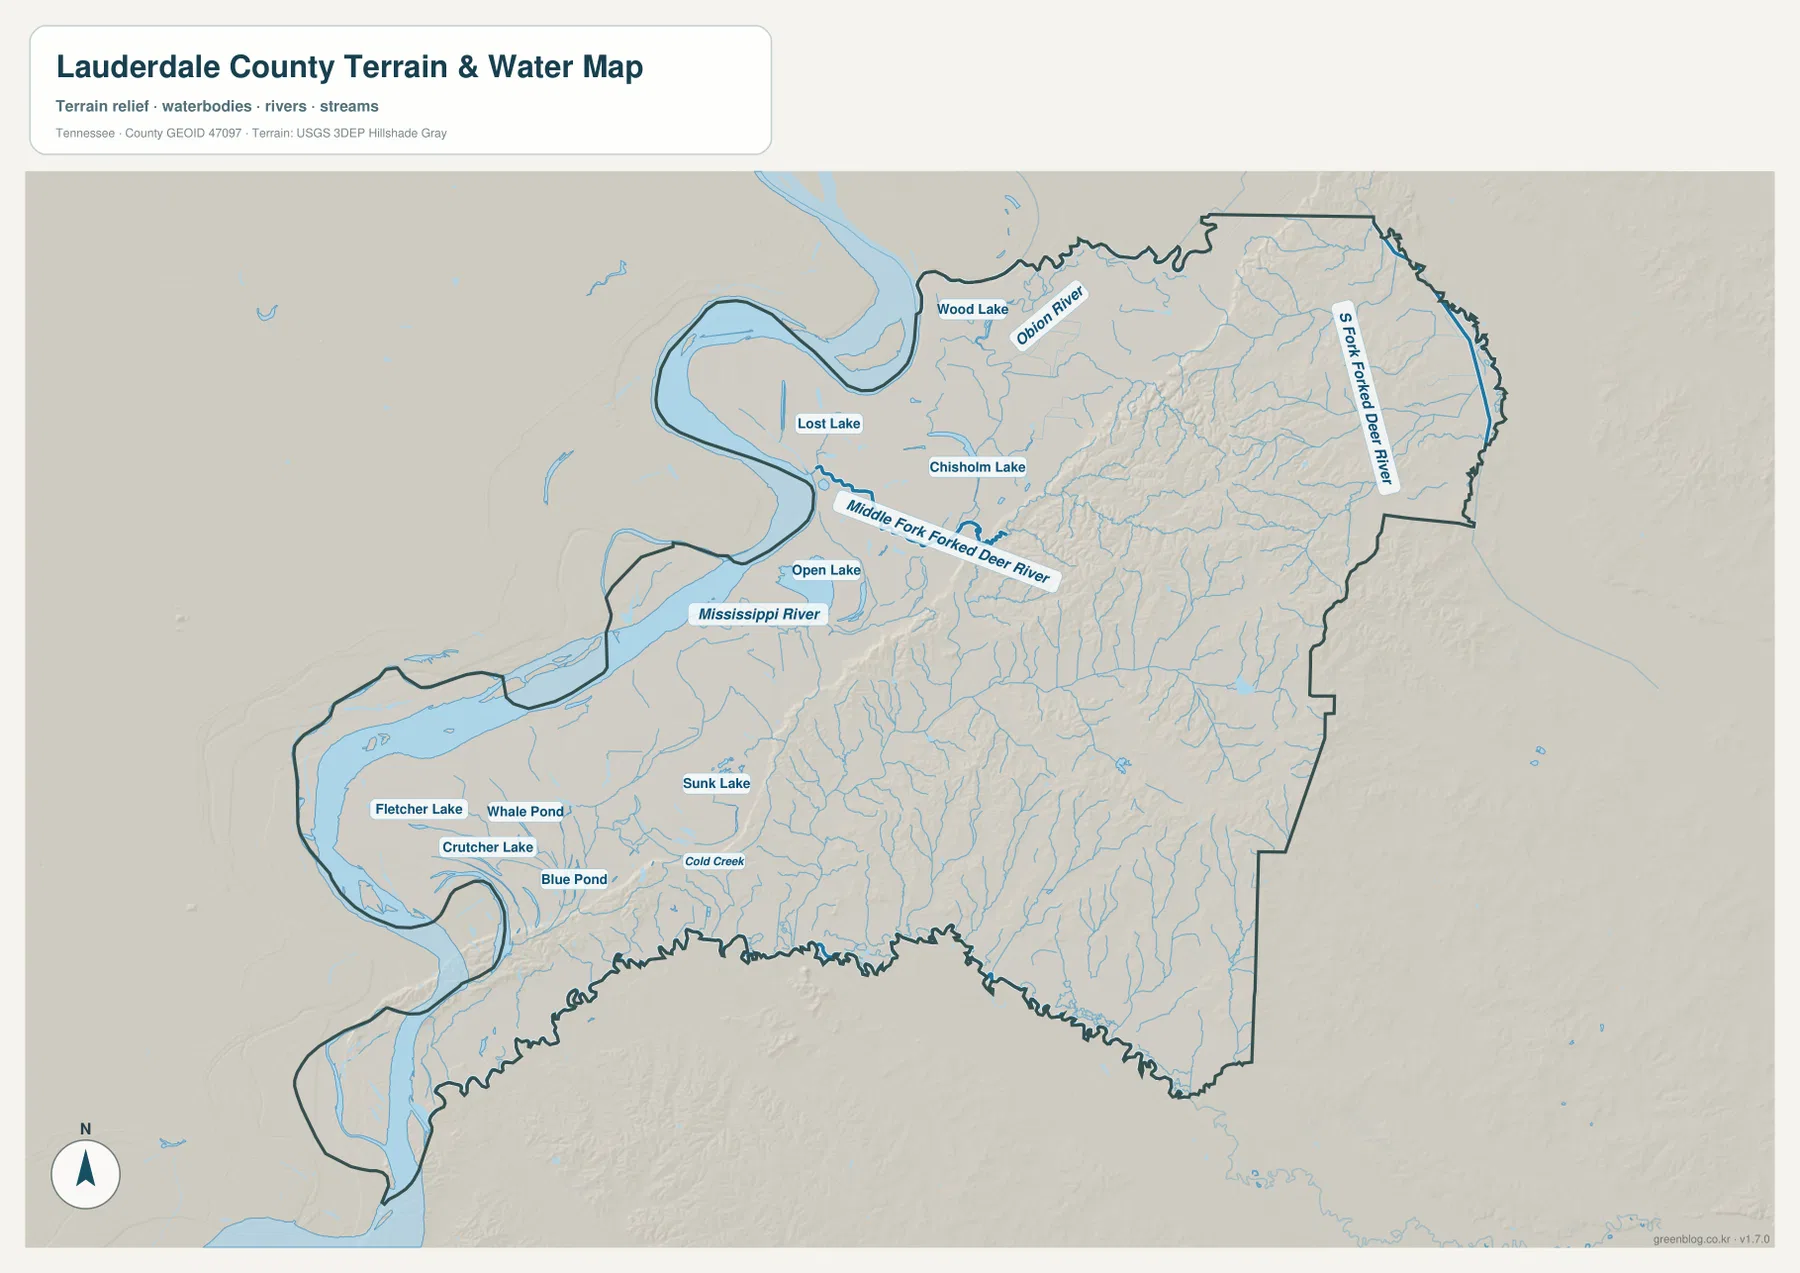
Farther inland, the map labels the Middle Fork Forked Deer River and the South Fork Forked Deer River, along with the Obion River in the north. A dense network of smaller streams descends from the eastern half of the county and joins the larger channels toward the west. The pattern is particularly clear when the water map is compared with the elevation map: short tributaries begin in the broken higher terrain, while wider and more sinuous waters occupy the flatter lowland.
This matters for more than physical-geography study. Rivers, former channels, lakes, and floodplain areas influence where roads can cross and where continuous dry ground is available. A static county map does not show current flood stages, bridge closures, levee conditions, or property-level flood risk, so those questions require current official information. For county-scale orientation, however, the water map clearly explains why the west looks and functions differently from the Ripley-Halls corridor.
A sharp rise from the western plain to eastern ridges
The elevation map makes the east-west contrast unmistakable. Its legend shows an actual elevation range of roughly 63 to 160 meters, with a mean near 92 meters. The broad Mississippi-side section is mostly in the lower green range. Moving eastward, the surface begins to rise, and a belt of brown and tan ridges becomes prominent through the central-eastern and northeastern parts of the county.
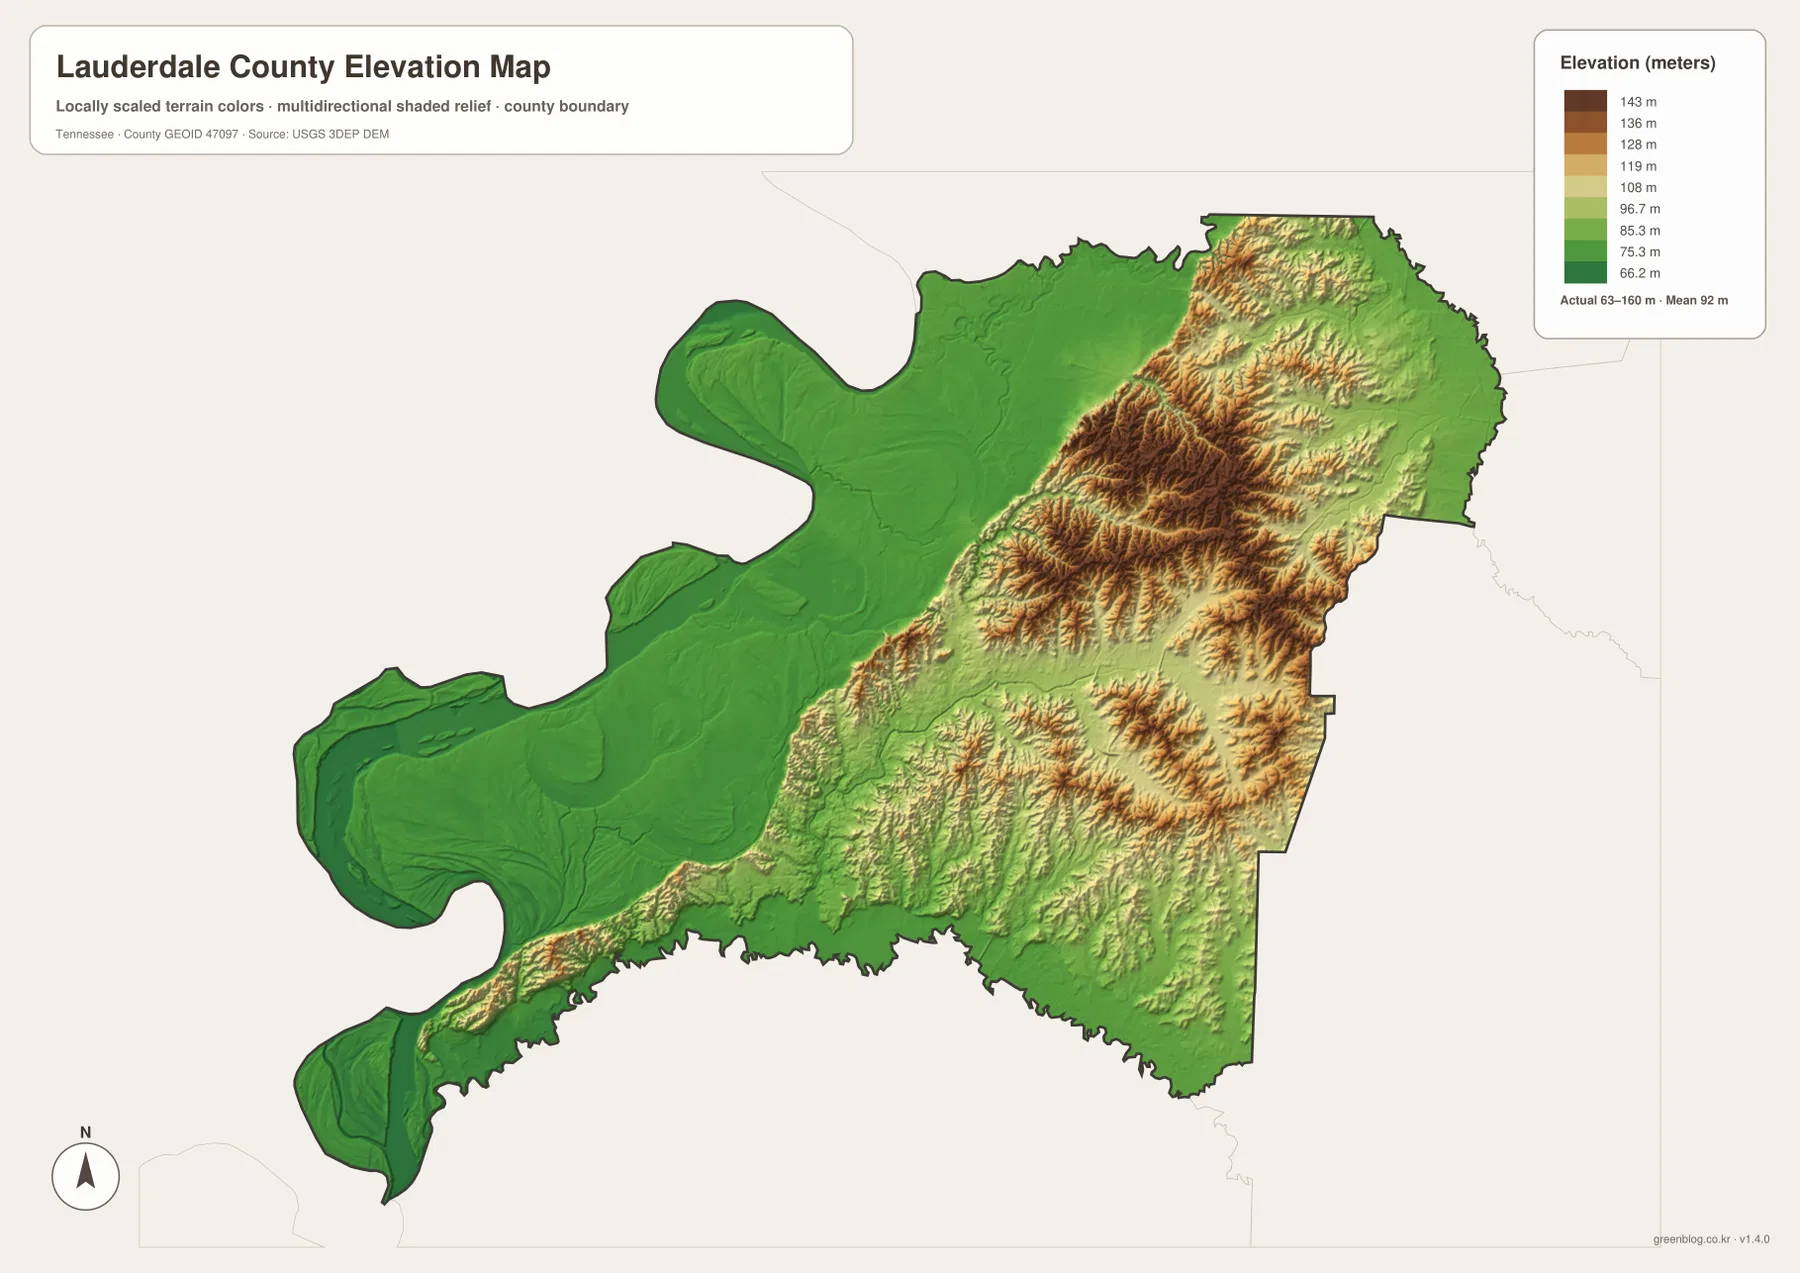
Ripley sits close to the transition between the lower western plain and the more rolling interior. North and northeast toward Halls and Gates, the shaded relief becomes increasingly irregular. The southeastern side also contains repeated ridges and small valleys, while the large western projections remain comparatively smooth and low. This variation is substantial enough to change the appearance of drainage lines and to influence the paths followed by roads.
Viewed together, the elevation and water maps tell a coherent story. Small streams are numerous in the higher eastern terrain, then descend toward broader channels and floodplain waters in the west. The general county map adds the settlement pattern on top of that physical base. This is why Ripley and the other labeled towns make more sense when the maps are compared rather than viewed separately.
Choosing the right Lauderdale County map
Use the general county map when you need the boundary, major roads, town labels, and surrounding context in one image. The city-connection map is better for quickly comparing Ripley with Halls, Henning, and Gates without extra detail. If the Mississippi River, lakes, tributaries, or drainage are the focus, the terrain-and-water map contains the most useful labels. The elevation map is the clearest choice for studying the low western plain and the higher eastern ridges.
For a school project, one practical approach is to start with the county map and mark the four towns, then place the water and elevation maps beside it. That makes it possible to explain not only where the towns are, but also how the underlying landscape changes across the county. A presentation about transportation can use the same method by comparing US 51 and the state routes with the river lowland and the more dissected upland terrain.
These maps are intended for county-scale reference, not legal surveying or real-time navigation. Road work, flood conditions, access restrictions, and property boundaries can change or require more detailed sources. Before using a map for field travel, emergency planning, boating, or land research, confirm the relevant details with current state, county, USGS, or land-management information.
Frequently Asked Questions
Where is Ripley within Lauderdale County?
Ripley is slightly east of the county’s center and serves as the county seat. On the general and city-connection maps, it is the main reference point between Halls to the north and Henning to the south, with several important roads meeting nearby.
Why does western Lauderdale County look so different from the east?
The western side is part of the low Mississippi River floodplain, where the map shows broad flat terrain, old channels, lakes, and winding waterways. The eastern half rises into ridges and valleys, creating much greater relief and a denser pattern of short streams.
What files are included in the download?
The ZIP contains four high-resolution JPG files: the general county map, city-connection map, terrain-and-water map, and elevation map. Each covers the same county but emphasizes a different type of information.
Map File Information
The download includes the county map, city-connection map, terrain-and-water map, and elevation map as high-resolution A3 JPG files. All four are packaged together in one ZIP for printing, classroom use, presentations, and personal reference.
- File Type: ZIP containing four high-resolution JPG files
Related Maps
Sources and references
- Tennessee State Library and Archives: Lauderdale County fact sheet – county history and administrative background
- Tennessee Department of Transportation: Lauderdale County road reference – county road network and route context
- USGS National Hydrography – river, stream, and water-feature reference data
- USGS 3D Elevation Program – elevation and terrain reference data
- U.S. Census Bureau TIGER/Line – county boundary and geographic reference data
Green Map creates custom-edited map images using open geographic data sources such as geoBoundaries, Natural Earth, OpenStreetMap, and government open data. These maps are edited visual materials, not raw data files, and are provided for education, documents, presentations, and graphic reference.