New Mexico has a large land area, a relatively small statewide population, and a settlement pattern dominated by a few distinct urban concentrations. The supplied 2024 ACS 5-year estimates put the state population at 2,120,246. The county-density map reports about 121,313 square miles of land and an average density near 17 people per square mile. That low average is real, but it does not describe how residents are actually distributed. Albuquerque and its surrounding communities form the state’s largest concentration, while Santa Fe, Las Cruces, Rio Rancho, Farmington, Roswell, Hobbs, and other places appear as separate pockets of settlement across a much sparser landscape.
Each map answers a different population question. Census-tract density reveals the fine-grained pattern inside county boundaries. The major-cities map and county-population map use proportional circles to compare total residents, not density. The county-density map divides population by land area. The change map compares the 2010 and 2020 decennial censuses, so its percentages should not be described as 2024 growth rates. Keeping those measures separate is especially important in a state where counties can be geographically large and urban settlement occupies only a small portion of their area.
Table of Contents
Census tracts make the Albuquerque area stand out from the surrounding low-density landscape
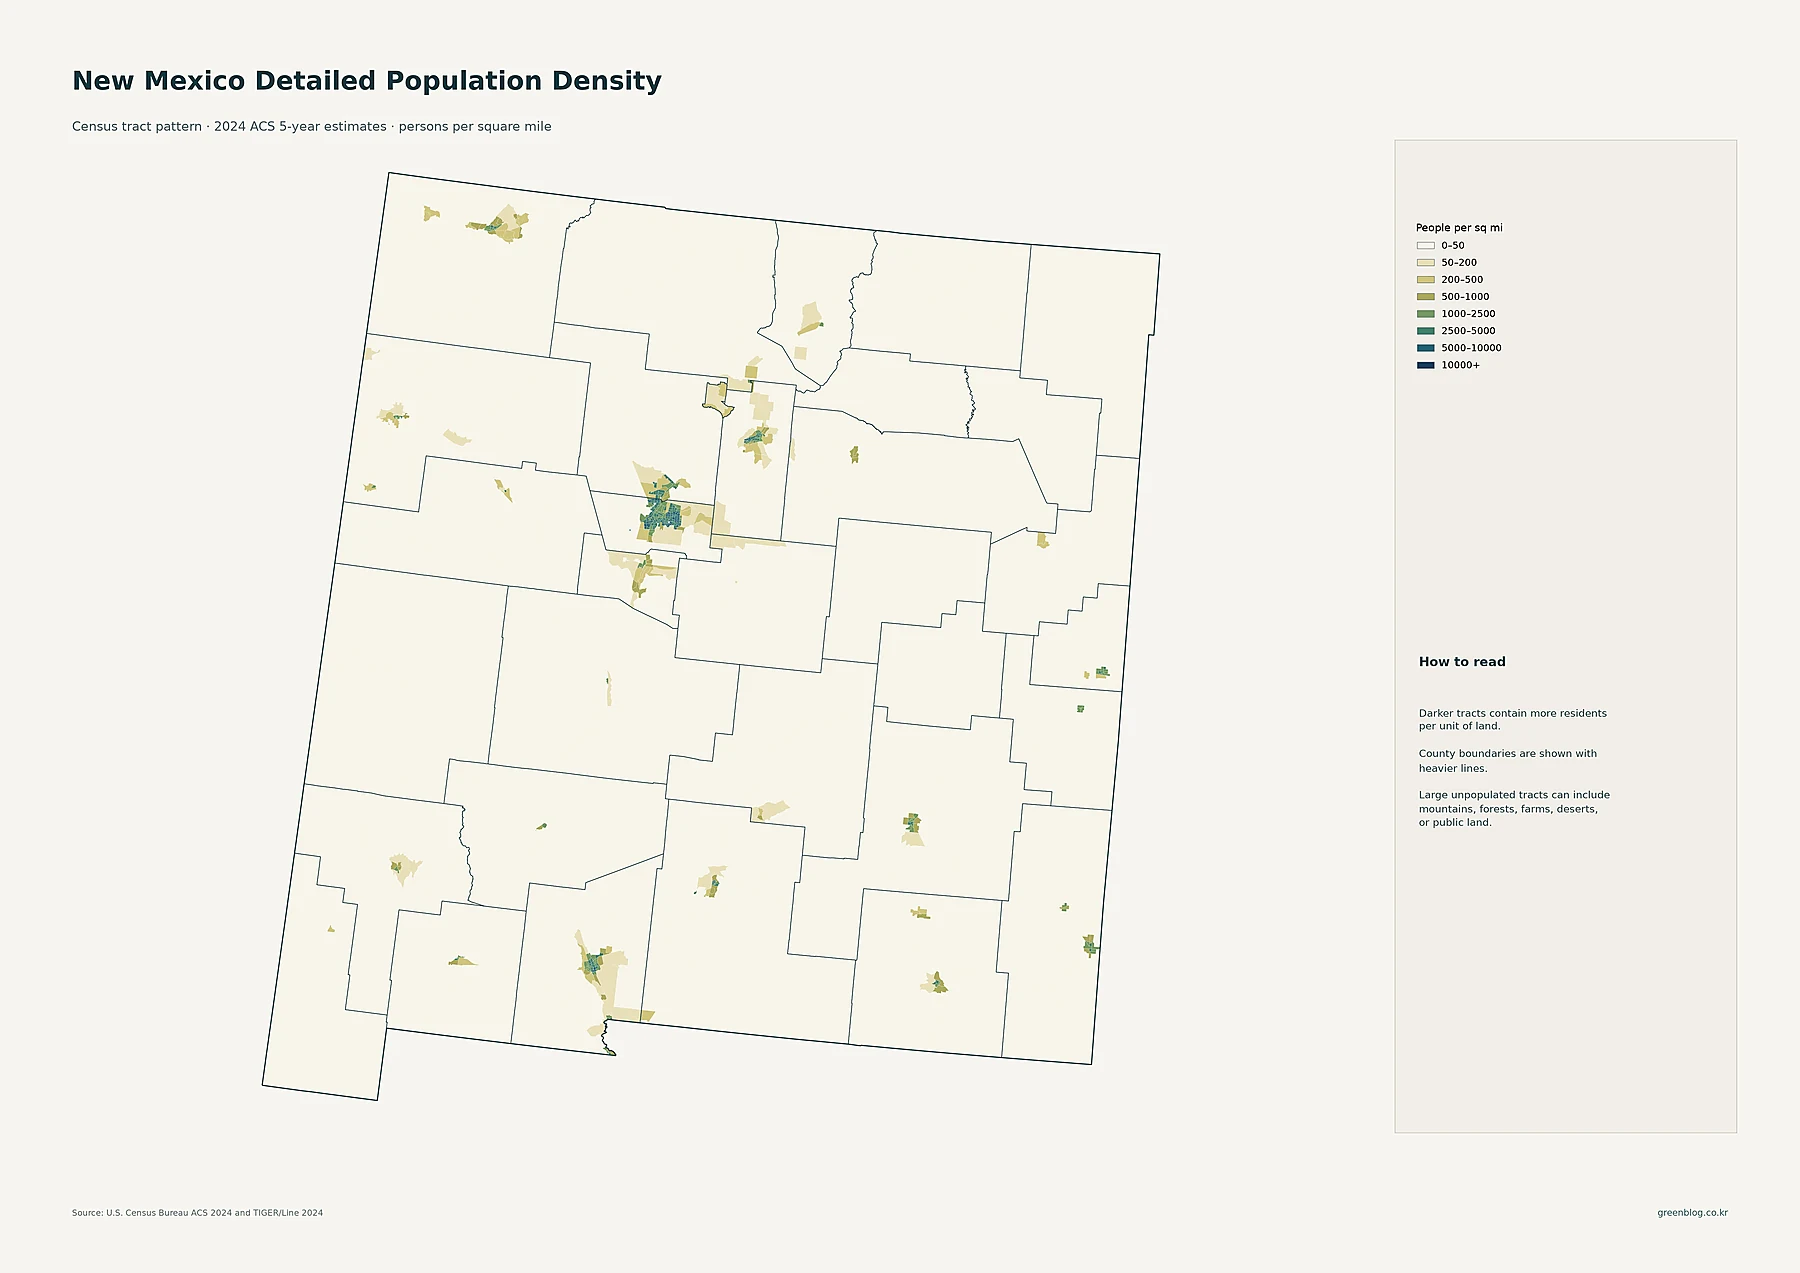
The largest continuous cluster of darker tracts surrounds Albuquerque in Bernalillo County and extends toward Rio Rancho in southern Sandoval County. Several tracts fall into the 1,000–2,500, 2,500–5,000, or still higher density classes. Santa Fe forms another recognizable concentration to the northeast, but its high-density footprint is much smaller. Farmington in the northwest, Clovis near the eastern border, Roswell and Hobbs in the southeast, and Las Cruces in the south appear as isolated clusters surrounded by broad areas in the lightest density classes.
This is a good example of why county averages can be misleading when read alone. A large New Mexico county may contain a compact urban center together with extensive mountain, desert, public-land, or rural areas. The tract map separates those pieces. Even where the county-average density is low, a city tract can be many times denser. The map therefore shows both sides of New Mexico’s geography: sharply concentrated settlement at selected locations and very large expanses with few residents per square mile.
Albuquerque dominates place population, while regional centers are widely separated
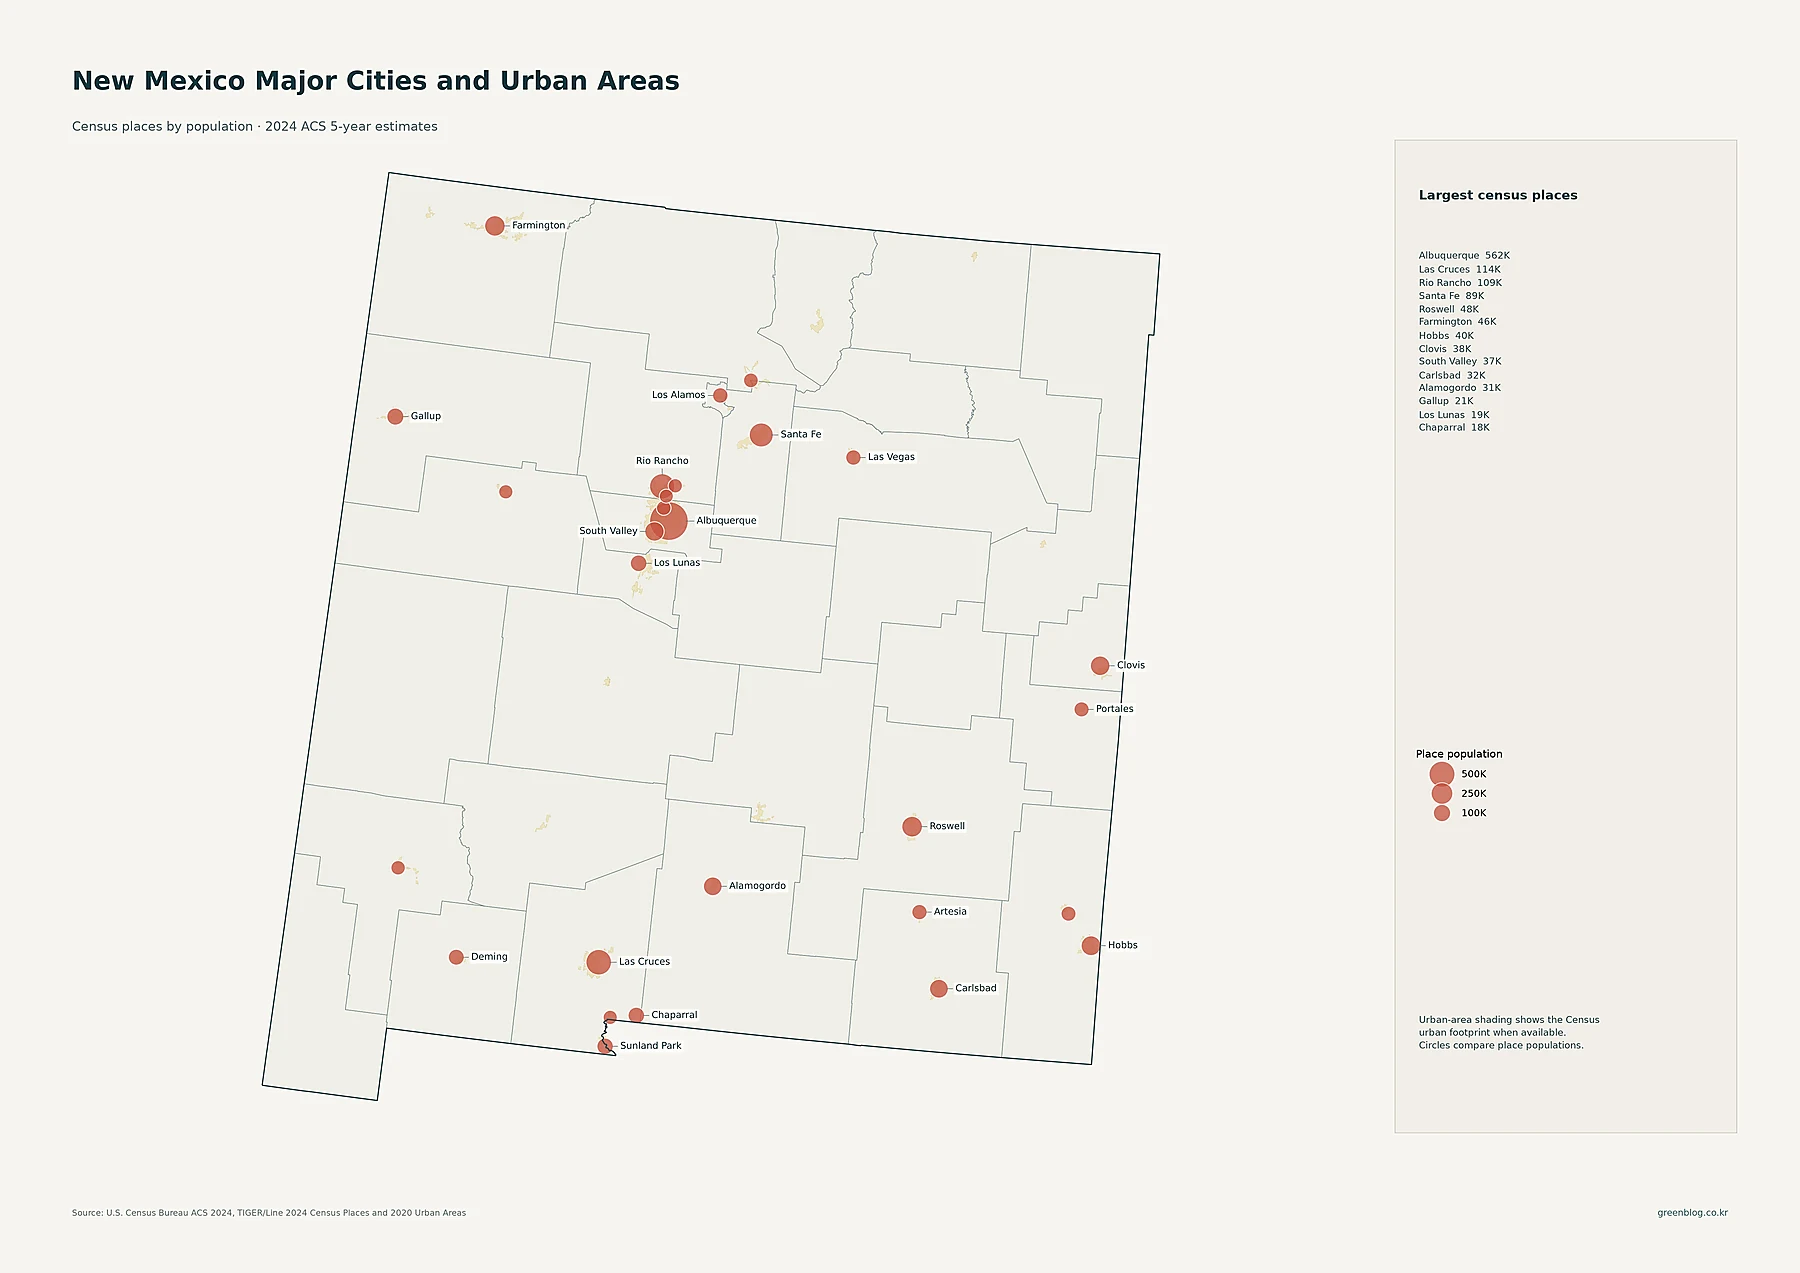
Albuquerque is by far the largest census place in the supplied data, with 562,218 residents. Las Cruces has 114,197 and Rio Rancho 108,515, followed by Santa Fe at 89,019. Roswell has 47,638 residents, Farmington 46,314, Hobbs 40,252, Clovis 37,942, and South Valley 37,120. Carlsbad has 31,746 and Alamogordo 31,307. Gallup, with 21,023 residents, is another visible regional center in western New Mexico.
The spatial arrangement matters as much as the ranking. New Mexico does not show one continuous high-population corridor across the whole state. Instead, the circles are separated by long stretches of sparsely populated land. Albuquerque is the clear central anchor, while other cities serve different parts of the state. The circle size shows how many people live within each census place; it should not be interpreted as a direct measure of people per square mile.
Bernalillo County holds nearly three times the population of second-place Doña Ana
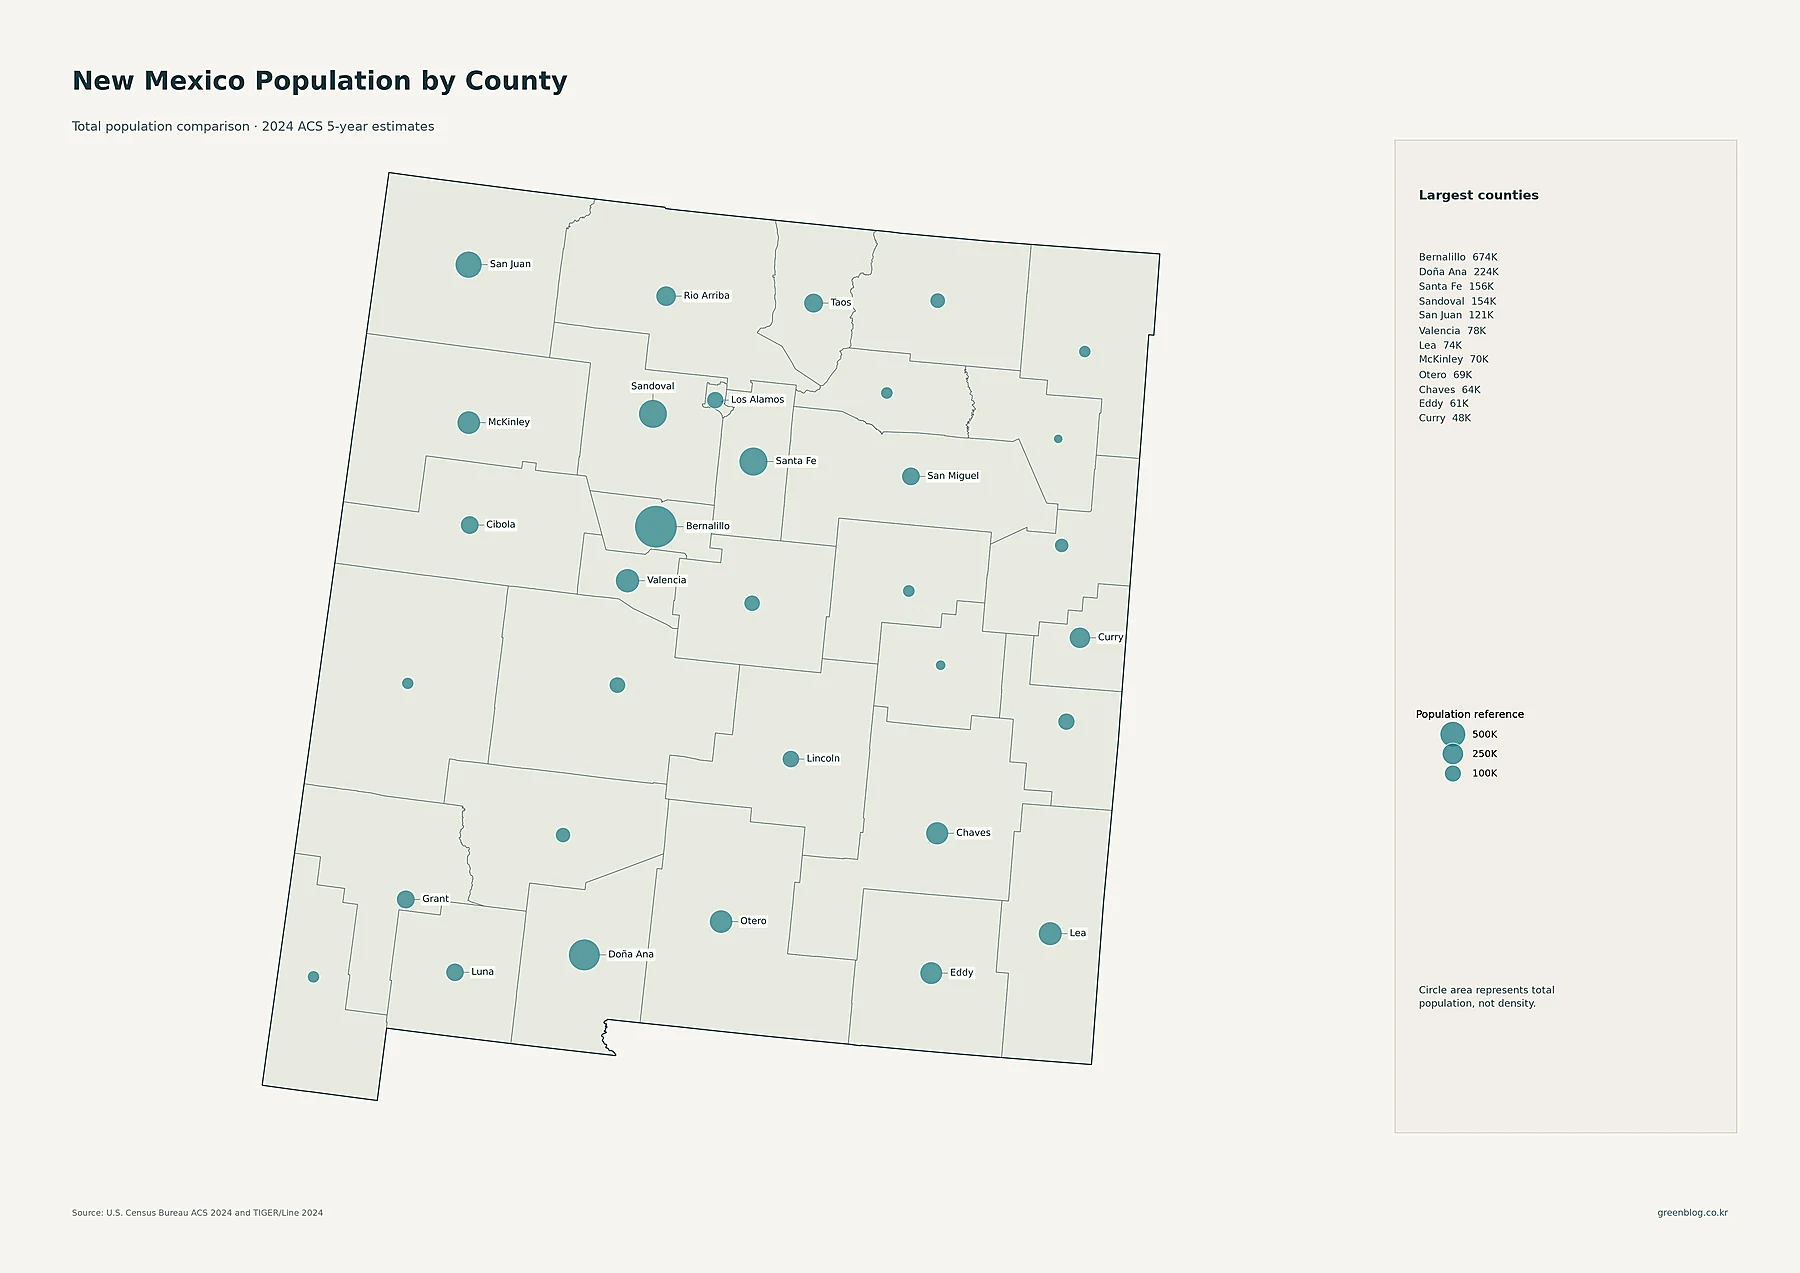
Bernalillo County has 673,930 residents, making it the largest county population by a wide margin. Doña Ana County is second at 224,266. Santa Fe County has 156,105, Sandoval County 153,604, and San Juan County 120,942. The next group includes Valencia at 78,458, Lea at 73,733, McKinley at 70,431, Otero at 68,816, Chaves at 64,217, and Eddy at 61,105.
The oversized Bernalillo circle reflects Albuquerque’s role in the state, but the county-total map also shows several secondary population centers in different directions. Doña Ana anchors the south, Santa Fe and Sandoval are important in the north-central region, and San Juan stands out in the northwest. Because New Mexico counties cover large areas, a large population total does not imply that the entire county is densely settled. The density map changes the comparison by incorporating land area.
Bernalillo also leads county density, with Los Alamos a distant but clear second
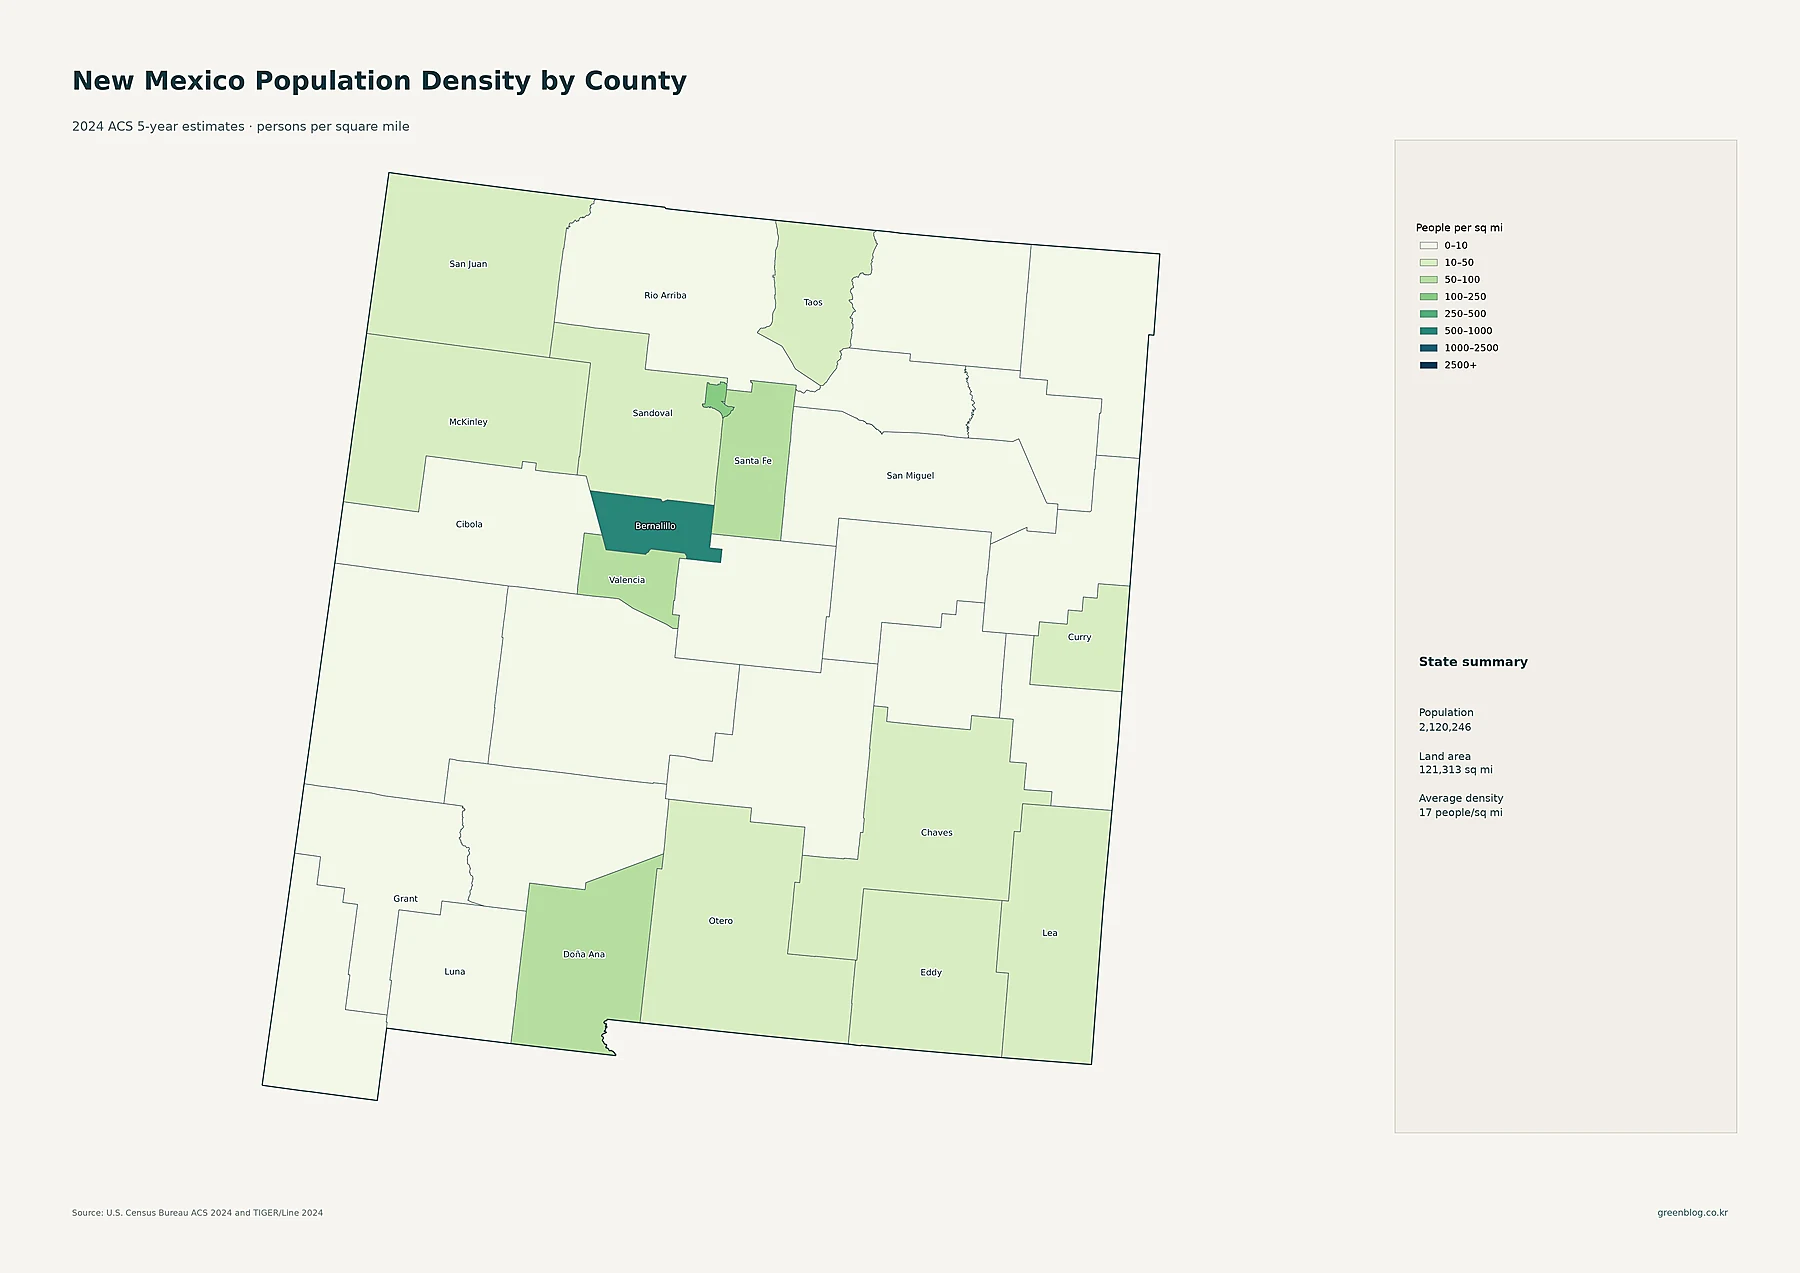
Bernalillo County has the highest average density at about 580.4 people per square mile. Los Alamos County ranks second at about 178.1, followed by Santa Fe at 81.7, Valencia at 73.6, Doña Ana at 58.9, and Sandoval at 41.4. Curry County averages about 33.9 and San Juan about 21.9, both above the statewide average shown on the map.
At the sparse end, Harding County averages only about 0.35 people per square mile. Catron is about 0.54 and De Baca 0.68. Union is near 1.05 and Hidalgo about 1.18. The difference between Bernalillo and these rural counties is enormous. New Mexico’s statewide average of roughly 17 people per square mile is therefore the result of combining a few much denser counties with a large number of very lightly populated ones.
| Measure | Leading area | Value in supplied data |
|---|---|---|
| State population | New Mexico | 2,120,246 |
| Largest county population | Bernalillo County | 673,930 |
| Highest county density | Bernalillo County | about 580.4/sq mi |
| Fastest 2010–2020 growth | Eddy County | +15.8% |
| Largest 2010–2020 decline | De Baca County | -16.0% |
Eddy and Lea led 2010–2020 growth, while several small northern and central counties declined
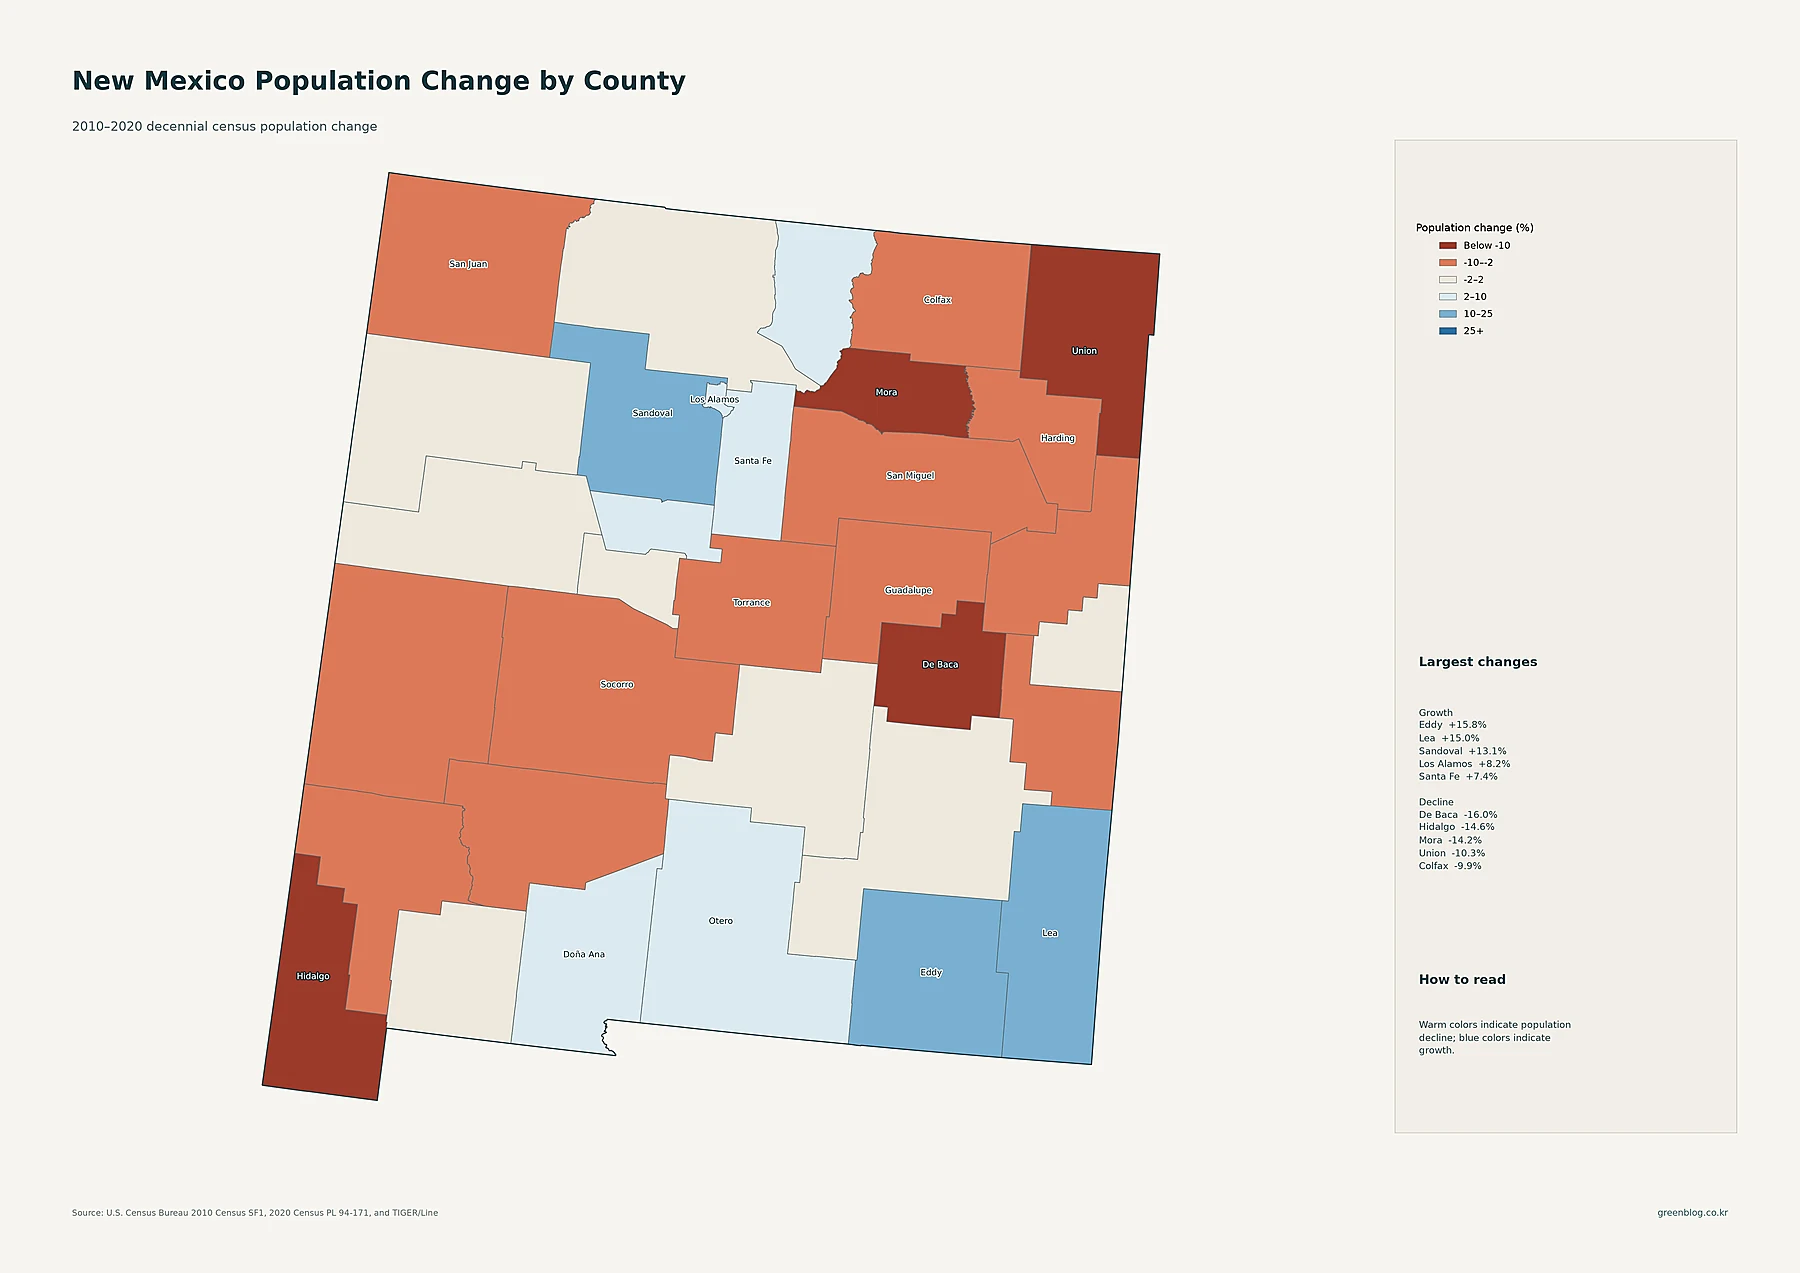
Eddy County recorded the fastest percentage growth in the supplied decade data, increasing from 53,829 residents in 2010 to 62,314 in 2020, or about 15.8%. Lea County rose from 64,727 to 74,455, a gain of about 15.0%. Sandoval County increased from 131,561 to 148,834, or 13.1%. Los Alamos grew 8.2%, Santa Fe 7.4%, Otero 6.3%, and Doña Ana 4.9%. The stronger blue shades in the southeast and around Sandoval make these growth areas easy to distinguish.
De Baca County had the largest percentage decline, falling from 2,022 residents in 2010 to 1,698 in 2020, or about -16.0%. Hidalgo declined 14.6%, Mora 14.2%, Union 10.3%, and Colfax 9.9%. San Juan declined 6.4%. The warm colors are spread across several northern, central, and southwestern counties rather than forming one single block. These figures describe the 2010–2020 census decade and should not be presented as changes in the 2024 ACS estimate.
The clearest New Mexico pattern is concentrated cities within an exceptionally sparse state
All five maps point to the same broad contrast while measuring different things. Bernalillo County leads both total county population and county-average density, and Albuquerque is by far the largest census place. Yet the state also has multiple regional centers, including Santa Fe, Las Cruces, Rio Rancho, Farmington, Roswell, Hobbs, and Carlsbad. On the tract map, these places form compact islands of higher density surrounded by very large low-density areas.
The change map adds a different dimension. The fastest 2010–2020 county growth was not in Bernalillo but in Eddy and Lea in southeastern New Mexico, with Sandoval also growing rapidly. At the same time, De Baca, Hidalgo, Mora, and several other counties lost population. A useful reading of New Mexico therefore keeps current population totals, density, fine-grained tract patterns, and historical change separate rather than treating them as interchangeable measures.
Download the New Mexico population map collection
The ZIP includes detailed census-tract density, major cities and urban areas, county population totals, 2010–2020 county population change, and county population density.
FAQ
Which New Mexico county has the largest population?
Bernalillo County is the largest in the supplied 2024 ACS 5-year estimates, with 673,930 residents. Doña Ana County has 224,266 and Santa Fe County 156,105.
Which New Mexico county has the highest population density?
Bernalillo County has the highest county-average density at about 580.4 people per square mile. Los Alamos is about 178.1 and Santa Fe about 81.7 people per square mile.
Which New Mexico county grew fastest from 2010 to 2020?
Eddy County grew about 15.8%, followed by Lea County at 15.0% and Sandoval County at 13.1%. These percentages compare the 2010 and 2020 decennial censuses.
Related Maps
Sources
- U.S. Census Bureau — American Community Survey (ACS): 2024 5-year population and density estimates
- U.S. Census Bureau — TIGER/Line Shapefiles: 2024 state, county, census tract, place geography and mapped boundaries
- U.S. Census Bureau — Decennial Census: 2010 and 2020 county population comparison
Green Map creates custom-edited map images using open geographic data sources such as geoBoundaries, Natural Earth, OpenStreetMap, and government open data. These maps are edited visual materials, not raw data files, and are provided for education, documents, presentations, and graphic reference.