Jefferson County in southeastern Iowa is centered on Fairfield and a rural landscape cut by the Skunk River, Walnut Creek, Brush Creek, Cedar Creek, and many smaller tributaries. U.S. 34 crosses the county through Fairfield from the Batavia side toward Lockridge, while Iowa 1 provides the main north-south road reference. Iowa 78 appears along the northern edge near the Packwood and Pleasant Plain side. Fairfield is the dominant city, with Packwood, Batavia, Lockridge, Libertyville, and Maharishi Vedic City providing additional geographic anchors. This page explains the supplied county, city, terrain-and-water, and elevation maps, and high-resolution JPG versions can be downloaded in a ZIP near the end of the article. High-resolution map files are available for download in the section below.
The easiest way to orient the county is to begin with Fairfield near the center. Batavia lies to the west, Packwood to the northwest, Lockridge to the east, and Libertyville to the southwest. Maharishi Vedic City is close to Fairfield on the northwest side. The elevation map shows higher ground across much of the west and northwest, while lower green corridors follow the major streams toward the east and southeast.
Table of Contents
Fairfield and U.S. 34 provide the main road reference
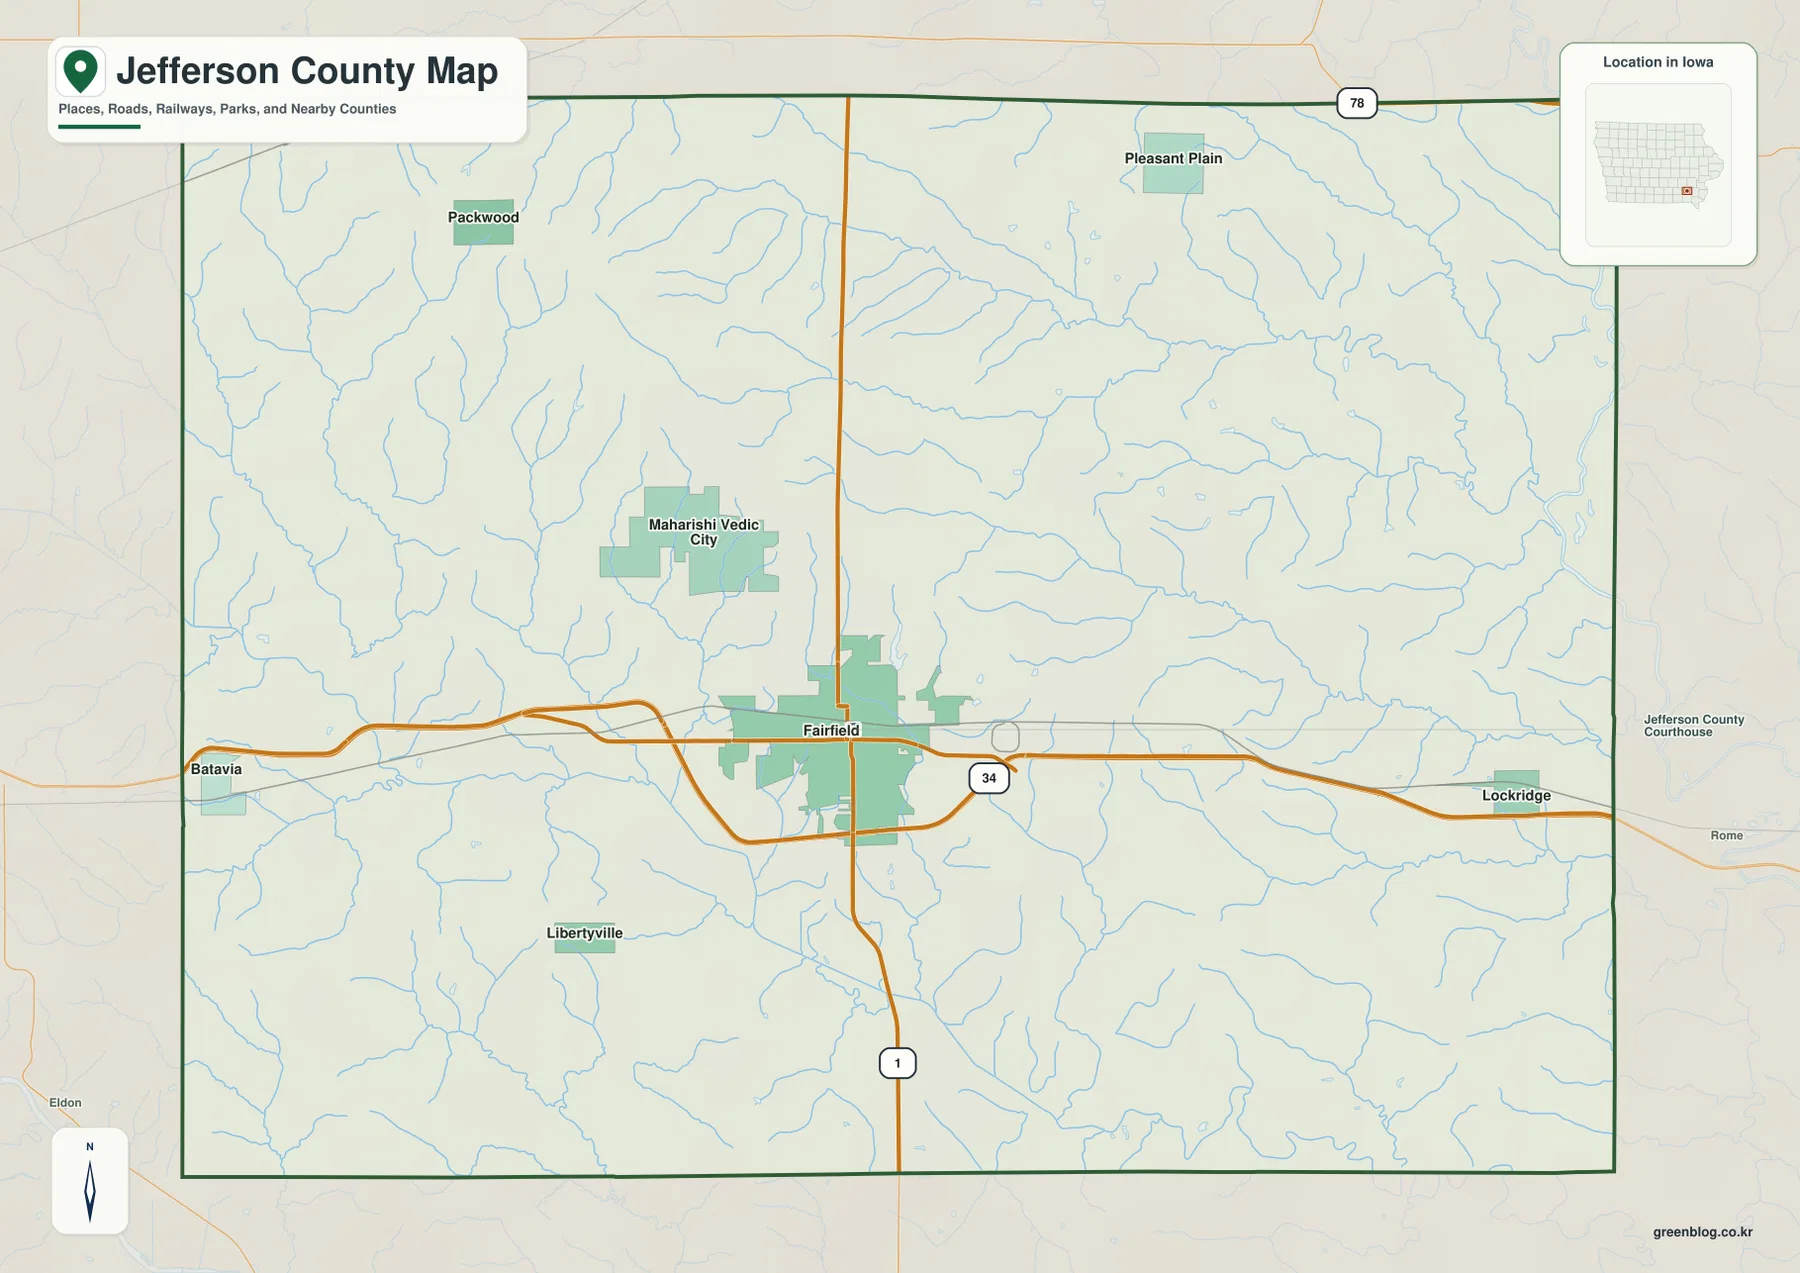
Fairfield is the strongest first landmark on the general county map. U.S. 34 runs east-west through the city, connecting the Batavia side with Lockridge. Iowa 1 crosses Fairfield from north to south, creating a second simple reference line. Iowa 78 is shown along the northern edge and helps locate the Packwood and Pleasant Plain side of the county.
Batavia is close to the western boundary, while Lockridge sits near the eastern side on the U.S. 34 corridor. Libertyville lies southwest of Fairfield, and Maharishi Vedic City is close to the central city on the northwest side. Packwood and Pleasant Plain help define the northern half. The general map is intended for broad geographic orientation rather than live navigation, so current construction, closures, and exact access points should be checked with current transportation information.
The rural roads are mostly straight, but the water network follows a very different pattern. Walnut Creek, Brush Creek, and Cedar Creek bend through the uplands and create long low corridors. Once the main roads are familiar, the terrain-and-water map makes the county’s natural structure much easier to read.
Fairfield dominates the six-city distribution
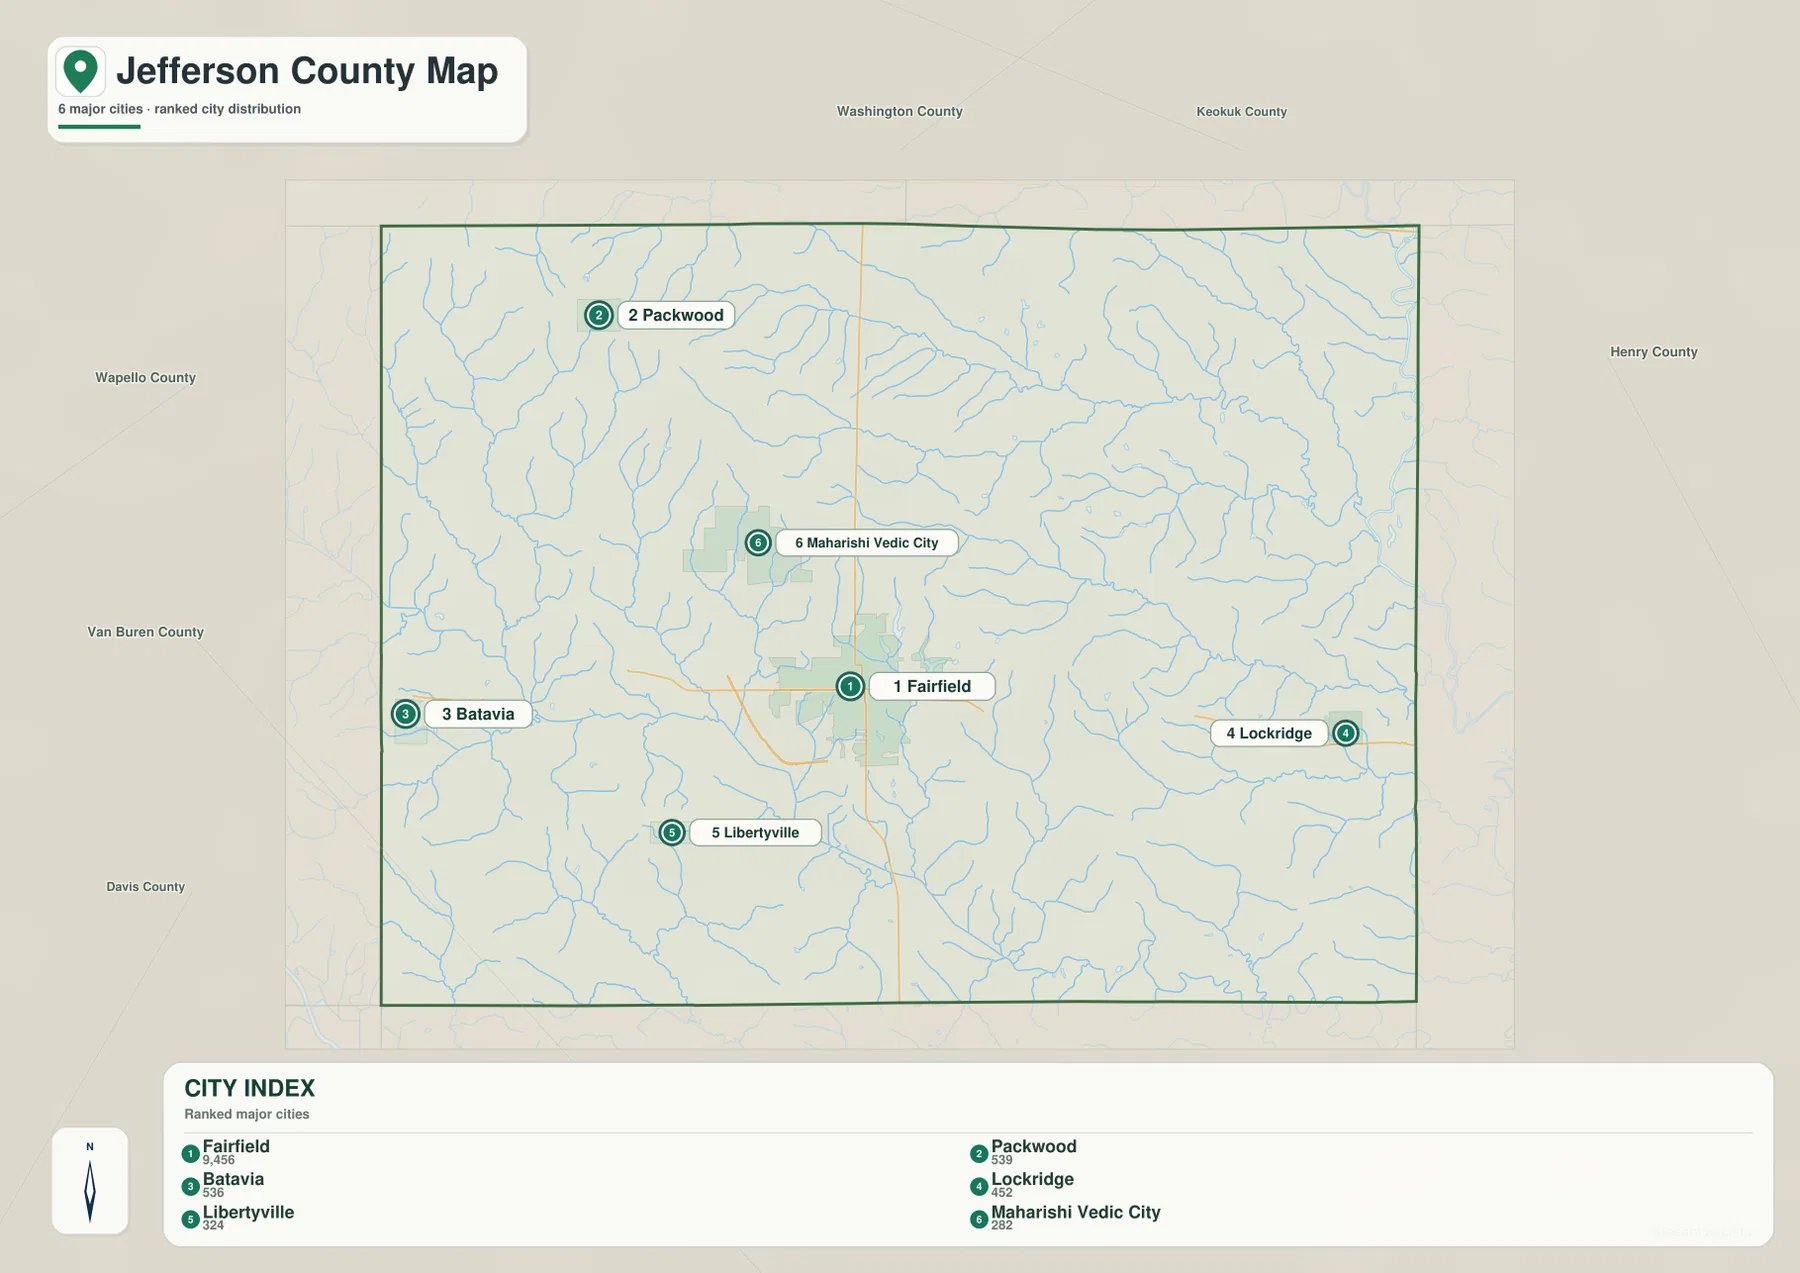
The city map ranks Fairfield first with a mapped population of 9,456. Packwood is second at 539 and Batavia third at 538. Lockridge is fourth at 457, Libertyville fifth at 324, and Maharishi Vedic City sixth at 282. Fairfield is therefore much larger than the other highlighted communities and acts as the clear urban center of the county.
Packwood provides a northwestern reference, Batavia a western one, Lockridge an eastern one, and Libertyville a southwestern one. Maharishi Vedic City is close to Fairfield and helps show the settlement pattern immediately around the central city. Washington, Keokuk, Henry, Wapello, Van Buren, and Davis counties are labeled around the map for regional context.
The settlement pattern also helps explain the elevation map. Packwood and Batavia are closer to higher western and northwestern ground, while Lockridge lies nearer the lower eastern drainage network. South of Fairfield, Libertyville is closer to the Cedar Creek valley system, which produces a different relief pattern from the western uplands.
Walnut Creek and Skunk River organize the northeastern drainage
Walnut Creek is one of the strongest named waterways on the terrain-and-water map. It runs eastward across the northeastern half and approaches the lower Skunk River corridor near the eastern boundary. South Walnut Creek forms another long valley farther west and south, while Middle Walnut Creek appears in the north. Together, these streams divide the northern uplands into several ridge-and-valley sections.
Skunk River is labeled near the eastern edge, where the terrain becomes noticeably lower. Black Oak Creek approaches the same general lowland from the northeast. On the elevation map, these channels correspond with broad green corridors that contrast with the higher western terrain. Lockridge and Pleasant Plain provide useful place references for this part of the county.
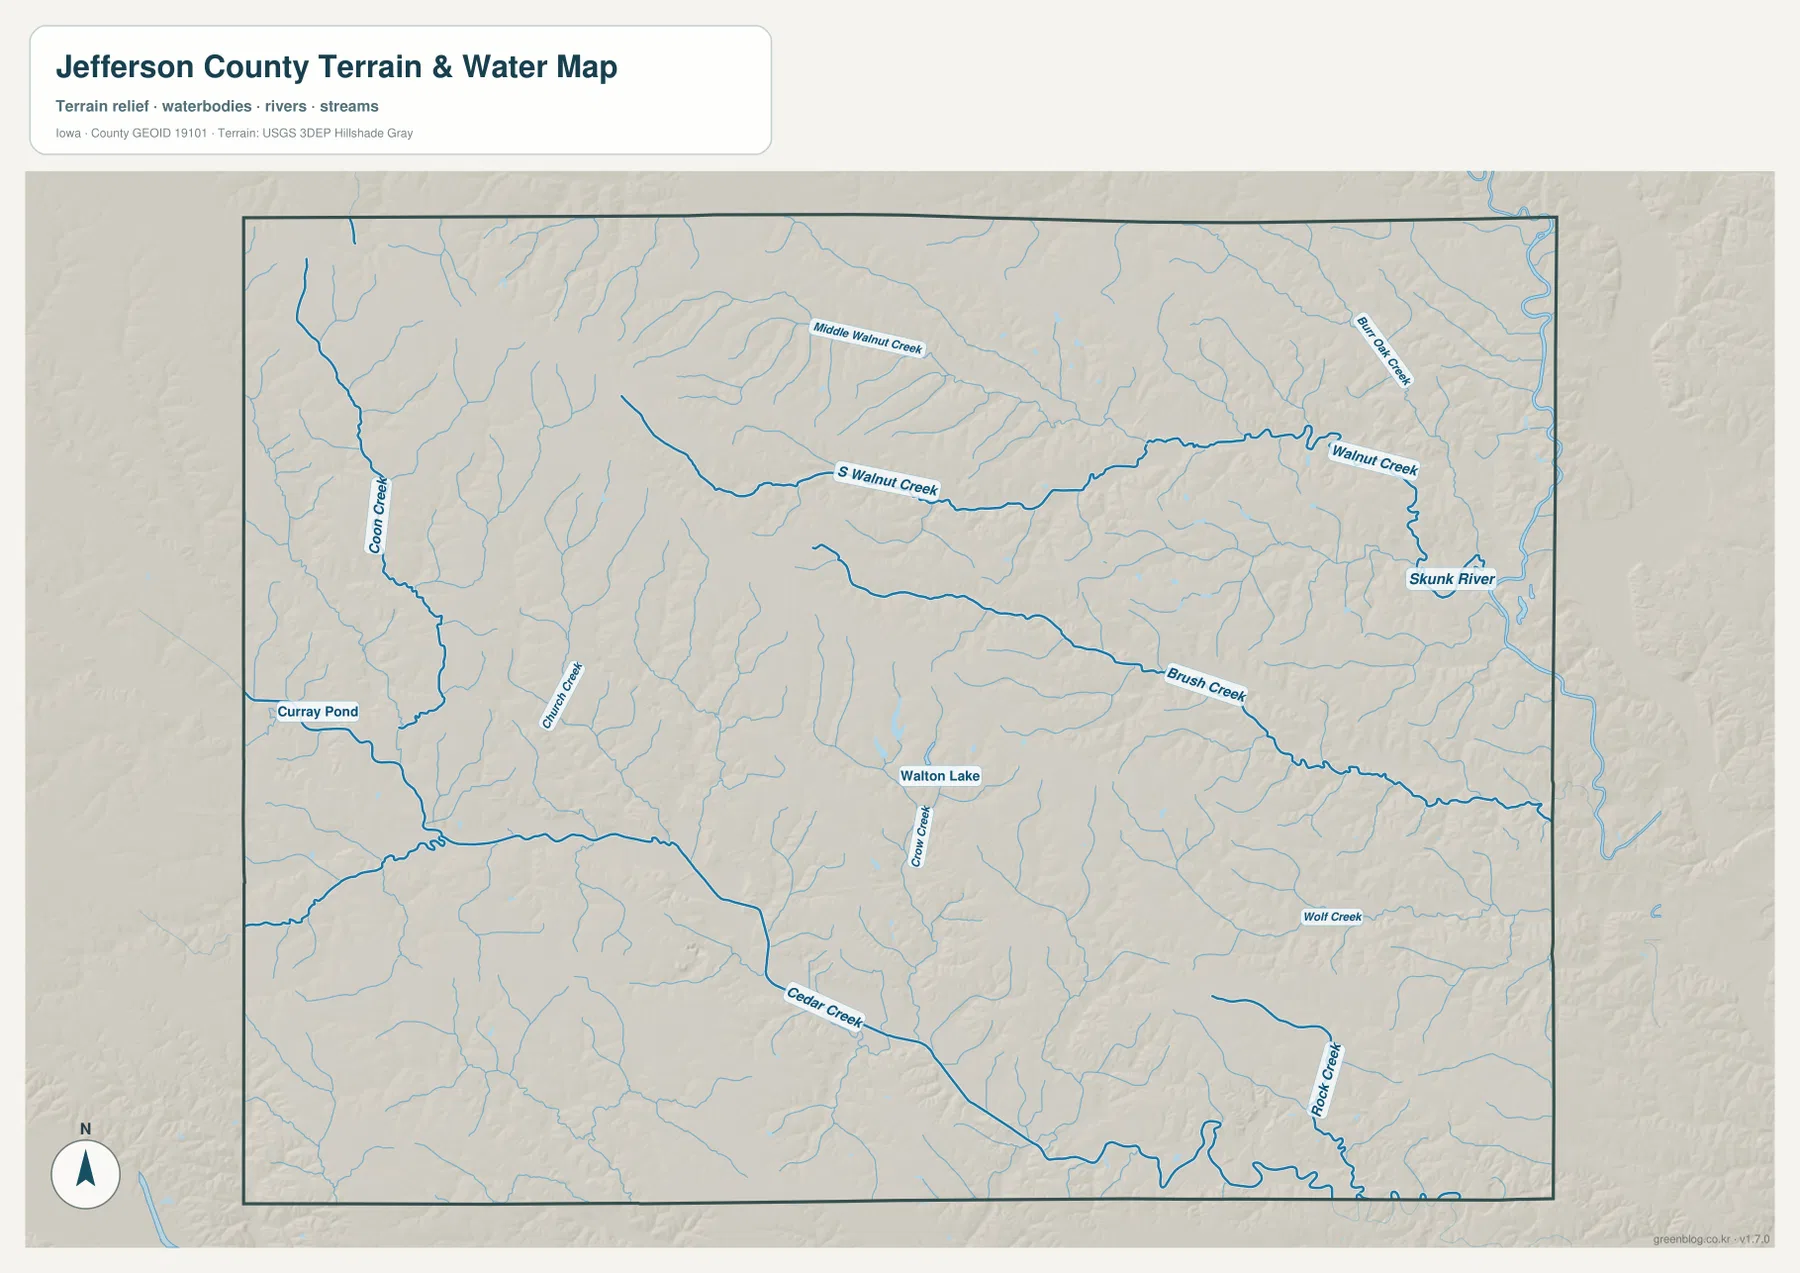
This sheet is intended for geographic reference rather than flood forecasting, current water levels, navigation, parcel boundaries, or legal water limits. Its main value is showing how the creeks, river corridor, and small water bodies fit around the towns and road grid.
Brush Creek and Cedar Creek divide the central and southern uplands
Brush Creek crosses the east-central interior and creates a long lower corridor through the rolling terrain. Cedar Creek is the stronger southern feature, entering from the southwest and continuing through the lower central part of the county. Both streams are easy to match with green valleys on the elevation sheet.
Coon Creek forms another long valley on the western side. Curray Pond and Walton Lake provide fixed water references near the central interior, while Wolf Creek and Rock Creek appear farther southeast. The drainage pattern shows that Jefferson County is not controlled by one single river; several creek systems divide the uplands in different directions.
Fairfield is the best place reference for the center, Batavia for the Coon Creek side, and Lockridge for the eastern creek valleys. Libertyville helps locate the Cedar Creek side of the county. Using nearby towns as anchors makes the drainage map easier to understand than studying a long list of stream names by itself.
Elevation ranges from 168 to 250 meters
The supplied elevation map shows an actual county range of about 168 to 250 meters, with a mean elevation of 223 meters. Higher brown terrain covers much of the west and northwest, while lower green corridors become more common toward the east and southeast. The difference between the mapped high and low ends exceeds 80 meters, and the dense tributary network makes local relief especially visible.
The western high ground is not a single smooth surface. Coon Creek and Walnut Creek tributaries carve narrow valleys into it, leaving a series of ridges. Around Fairfield the terrain is more moderate, while the Skunk River side and the Brush Creek and Cedar Creek valleys show larger areas of lower ground. The southeastern corner also contains repeated narrow green valleys between higher ridges.
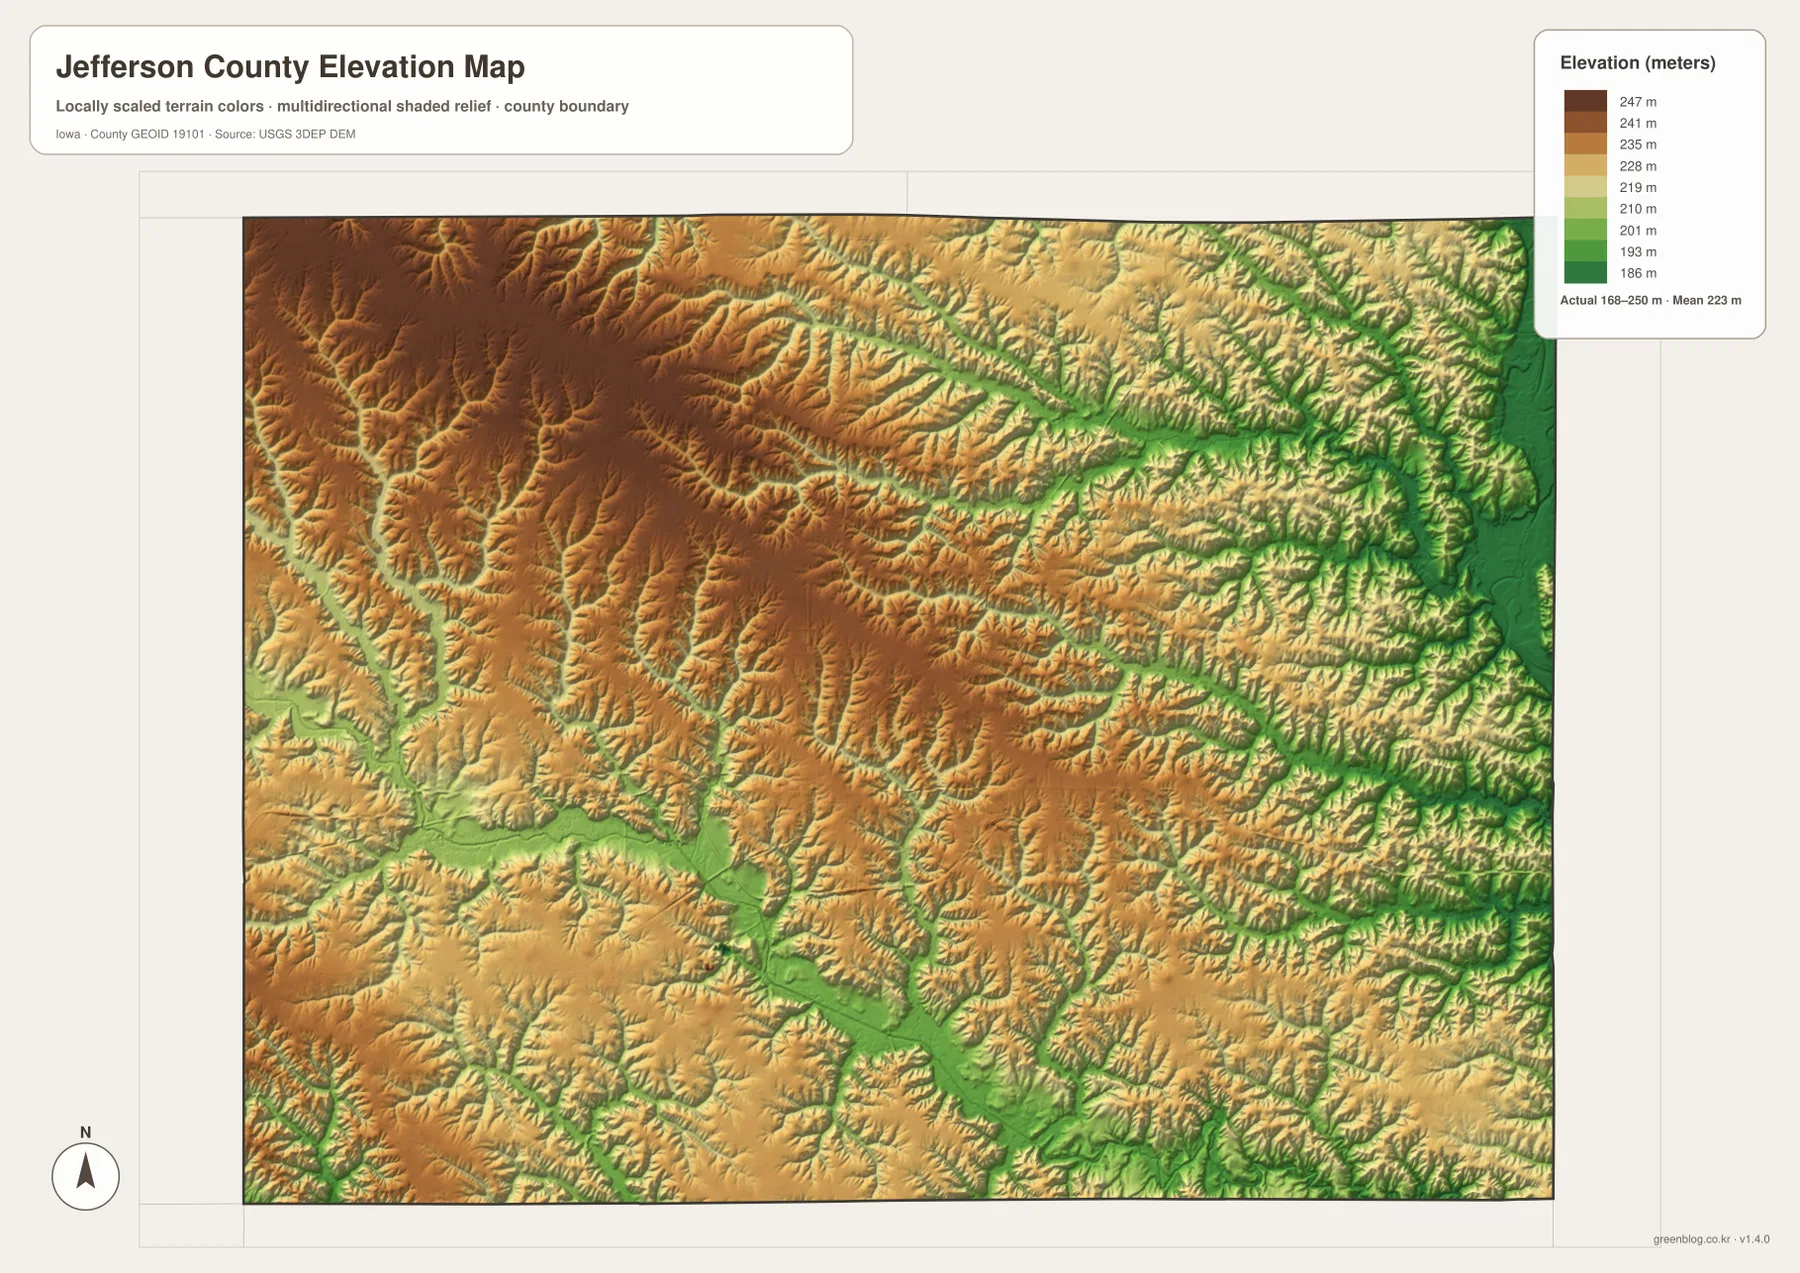
The elevation colors are designed for broad terrain comparison rather than survey-grade measurement. Exact parcel elevation, road grade, engineering design, or construction work requires original elevation data or professional surveying. For general map reading, the key pattern is the gradual drop from the western uplands toward the eastern and southeastern creek valleys.
Roads and creek valleys reveal different county patterns
The general map is easy to orient with U.S. 34 and Iowa 1, while the terrain map follows the curved routes of Walnut Creek, Brush Creek, Cedar Creek, and Coon Creek. Fairfield is the strongest central road reference, and Batavia and Packwood help locate the higher western side. Lockridge provides a useful reference for the lower eastern drainage.
Libertyville works well for the southern Cedar Creek area, while Maharishi Vedic City helps locate the small settlement cluster immediately northwest of Fairfield. Using these local anchors makes it easier to compare the same part of the county across the general, city, water, and elevation maps.
Choose the Jefferson County map that fits the task
Use the general county map when you need towns and numbered roads in one view. It is the quickest way to compare Fairfield, Packwood, Batavia, Lockridge, Libertyville, and Maharishi Vedic City with U.S. 34, Iowa 1, and Iowa 78. The city map is better when the goal is to compare the six highlighted communities and the population ranking shown on the supplied graphic.
The terrain-and-water map is best for Skunk River, Walnut Creek, South Walnut Creek, Brush Creek, Cedar Creek, Coon Creek, Walton Lake, and Curray Pond. The elevation map adds the 168–250 m range and makes the higher western side and lower eastern-southeastern valleys immediately visible.
The WebP images in the article are optimized for quick browser viewing. For printing, classroom use, presentations, or closer comparison, the ZIP below contains the county, major-city, terrain-and-water, and elevation maps as high-resolution JPG files. They are general-reference graphics and do not replace legal boundary records, current transportation data, flood information, or precise survey measurements.
Frequently Asked Questions
Which map is best for locating Fairfield and Packwood?
The general county map is the best starting point. Fairfield is near the center at U.S. 34 and Iowa 1, while Packwood is farther northwest. Batavia, Lockridge, Libertyville, and Iowa 78 are also labeled on the same sheet.
What are the main waterways shown in Jefferson County?
Skunk River is shown near the eastern edge, while Walnut Creek, South Walnut Creek, Brush Creek, Cedar Creek, and Coon Creek divide the interior. Walton Lake and Curray Pond are also labeled on the terrain-and-water map.
What does the 168–250 m elevation range show?
The elevation map shows higher terrain across much of the west and northwest and lower valleys toward the east and southeast. The mapped mean elevation is 223 meters. Precise site elevations require original elevation data or professional survey information.
Map File Information
The ZIP contains four high-resolution JPG maps for Jefferson County, Iowa: county, major cities, terrain and water, and elevation.
- Included Files: Use only the versions confirmed in the article and supplied images
- File Type: Use the confirmed download contents
- Intended Use: Printing, education, presentations, and map-based projects
Related Maps
Sources and reference data
The links below provide authoritative U.S. government source data for county boundaries, hydrography, and elevation represented in the supplied map set.
These maps are intended for general geographic reference, learning, printing, and visual comparison. Legal boundaries, ownership, current road conditions, flood risk, water levels, and precise elevations should be checked against the responsible agency’s current records.
Green Map creates custom-edited map images using open geographic data sources such as geoBoundaries, Natural Earth, OpenStreetMap, and government open data.
These maps are edited visual materials, not raw data files, and are provided for education, documents, presentations, and graphic reference.