Tuolumne County is a Sierra Nevada county where the land-cover story is dominated by natural vegetation rather than a large urban footprint. The 2025 maps show forest and shrubland across most of the county, while developed land and stronger impervious surfaces are concentrated in a much smaller western area. This page brings together four views: general land cover, forest and farmland, impervious surface, and mapped change from 1985 to 2025.
All four original JPG maps are available in one ZIP below. The WebP images in the article are convenient for comparing patterns on screen, while the 2480×1754 JPG files are better suited to offline reference, classroom material, presentations, and print layouts where the legend needs to remain readable.
Table of Contents
A small built footprint stands out against a very large natural landscape
The impervious-surface view gives the quickest sense of how lightly built much of Tuolumne County is. Most of the county appears near the lowest end of the scale, with stronger orange and red values limited mainly to clusters in the west and a few narrow linear features. The map summary reports a mean impervious value of 0.58%, only 0.15% in the 50%-or-higher impervious range, and 2.89% developed cover.
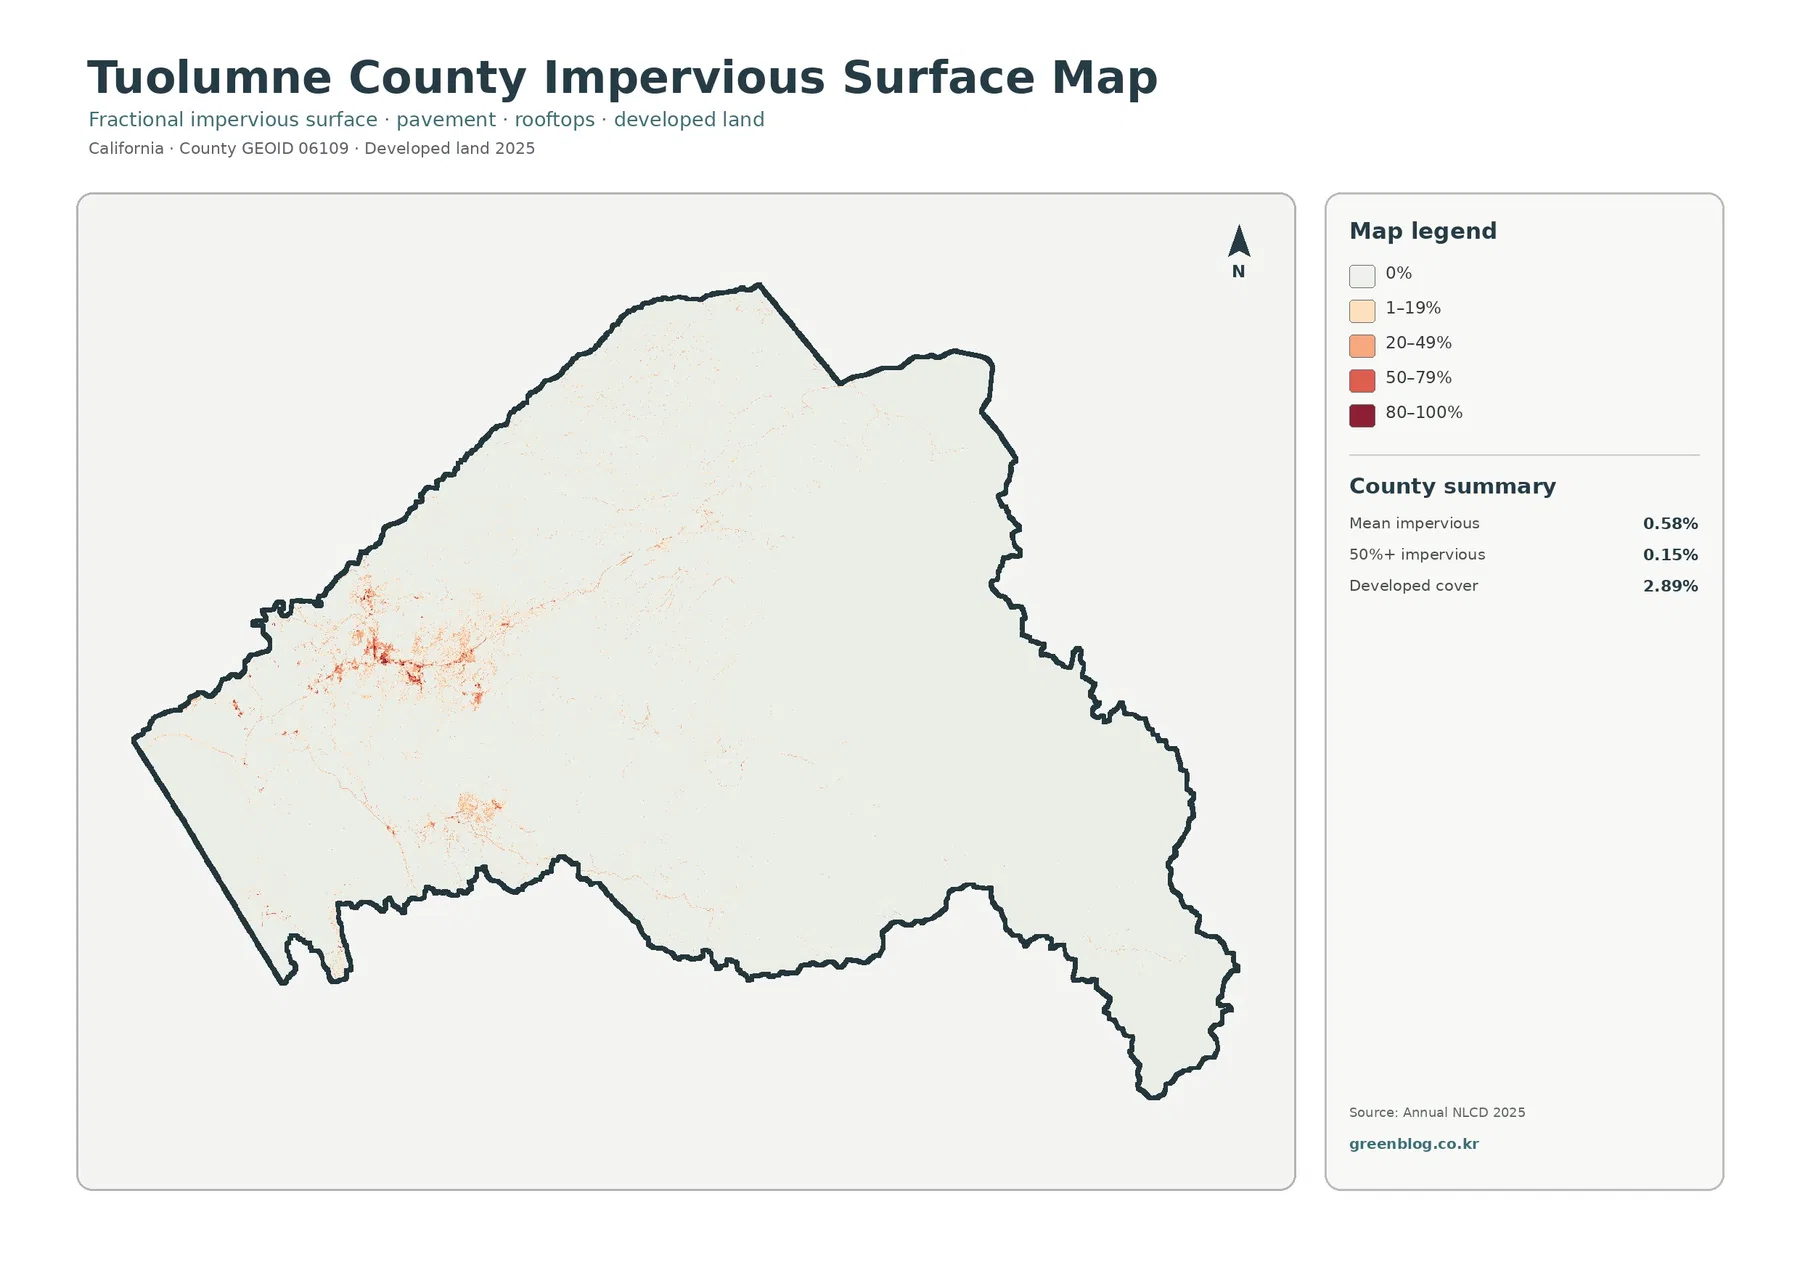
Impervious surface means pavement, rooftops, parking areas, and other surfaces that do not readily absorb water. It is not identical to the developed-land class. A low-density neighborhood can contain roads and buildings but still have substantial trees or open ground, so its impervious percentage may remain modest. That distinction matters here because the county has a recognizable western settlement cluster without the broad, continuous urban surfaces common in metropolitan counties.
The western concentration also fits the county’s settlement pattern. Sonora, the county seat and its only incorporated city, lies in the western foothill portion of the county, and several other communities are found in the same broad side of the county. The map supports a spatial comparison between settled areas and impervious cover, but it does not prove that any particular road or community caused the pattern.
Forest and shrubland define the 2025 county-wide pattern
The general land-cover map shifts attention from built surfaces to the county as a whole. Forest accounts for 42.32% of the mapped area and shrubland for another 40.42%. Grassland is 7.84%, barren land 3.63%, and developed land 2.89%. Those values explain why the map is visually dominated by green forest and broad tan-brown shrubland instead of large blocks of red development or yellow agriculture.
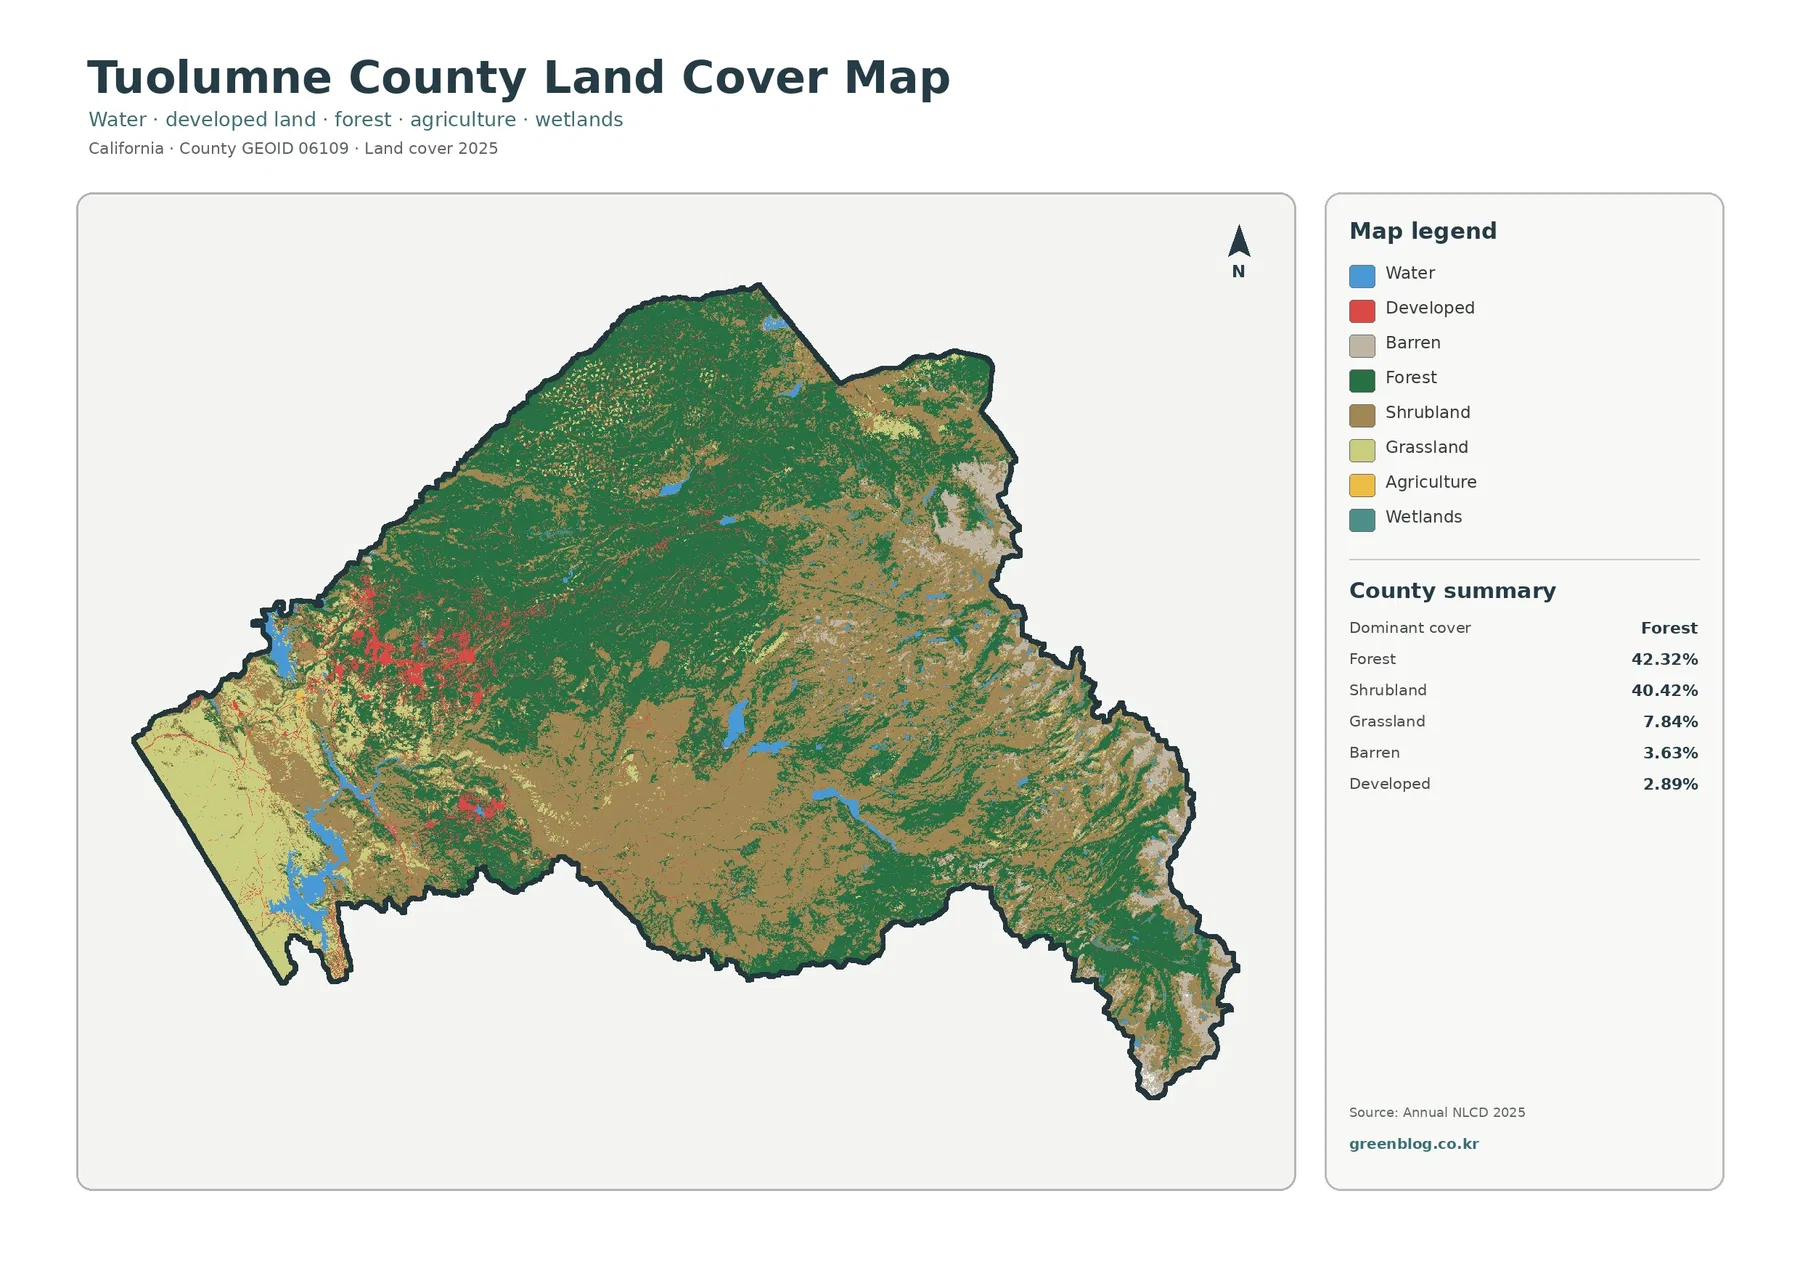
The pattern changes across the county rather than forming one uniform blanket. Forest is especially extensive through northern and northwestern areas, while shrubland becomes more prominent through broad central and eastern sections and appears mixed with forest toward the southeast. Brighter barren patches also become more noticeable in parts of the higher eastern landscape. Small water bodies punctuate these natural-cover classes and provide useful reference points when comparing the four maps.
Tuolumne County’s official geographic descriptions help explain why such different cover types can appear within one boundary. The county extends from western foothills into the Sierra Nevada, with elevations ranging from roughly 300 feet to more than 13,000 feet. Large portions fall within Yosemite National Park, Stanislaus National Forest, and other public lands. Those management boundaries are not shown by the land-cover colors, but the broad mountain setting is important context for understanding why forest, shrubland, and barren cover are so prominent.
The forest-and-farmland view makes the lack of broad agriculture clear
Agriculture occupies only 0.02% in the supplied forest-and-farmland summary. That is a striking contrast with the 42.32% forest share and 40.42% shrubland share. Grassland contributes 7.84%, water 1.92%, and wetlands 0.90%. On the map, agricultural colors do not form a large continuous belt; they appear only in very small pieces compared with the surrounding natural vegetation.
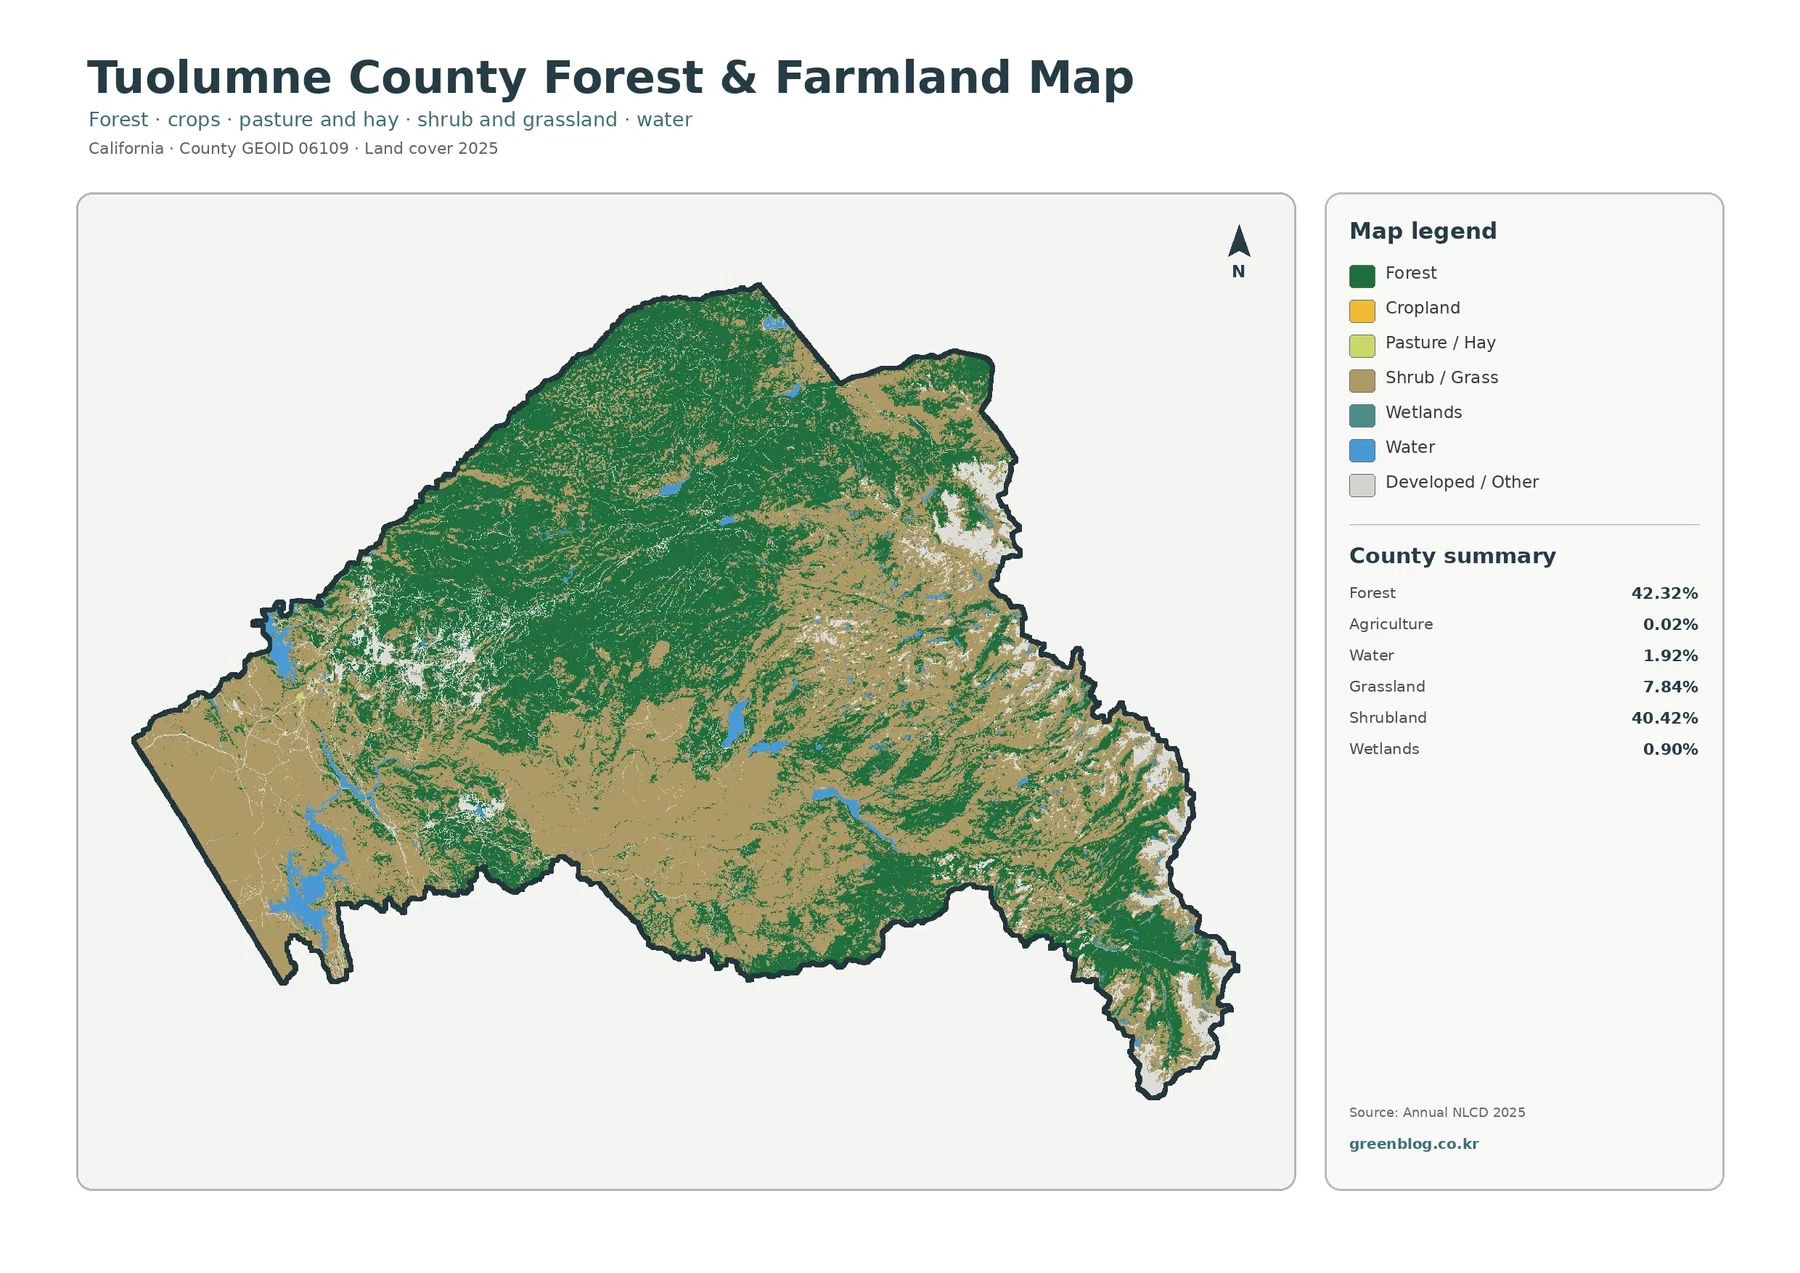
This simplified view is useful because it reduces the visual competition among many land-cover classes. The northern forest block becomes easy to follow, as do the broad shrub and grass areas extending across the central and eastern county. Water and wetland features remain visible but occupy a small share of the total area. The result is a clearer picture of a county where farmland is not the main land-cover story.
The agriculture percentage should not be read as the amount of land legally available for farming. Land cover describes what the surface was classified as during the observation year; it does not show zoning, ownership, agricultural preserves, parcel boundaries, or development rights. Anyone evaluating a specific property should use the county’s parcel, zoning, and General Plan GIS layers rather than treating the land-cover image as a legal land-use map.
What changed between 1985 and 2025 needs careful interpretation
The change map compares mapped classes at the beginning and end of a long period. It reports a class difference across 19.36% of the county. The largest labeled category is forest loss at 13.22%, followed by other difference at 5.15%. Areas classified as changing to developed cover account for 0.94%, while agricultural loss is 0.02%. These are mapped classification differences, not a complete explanation of what happened on the ground.
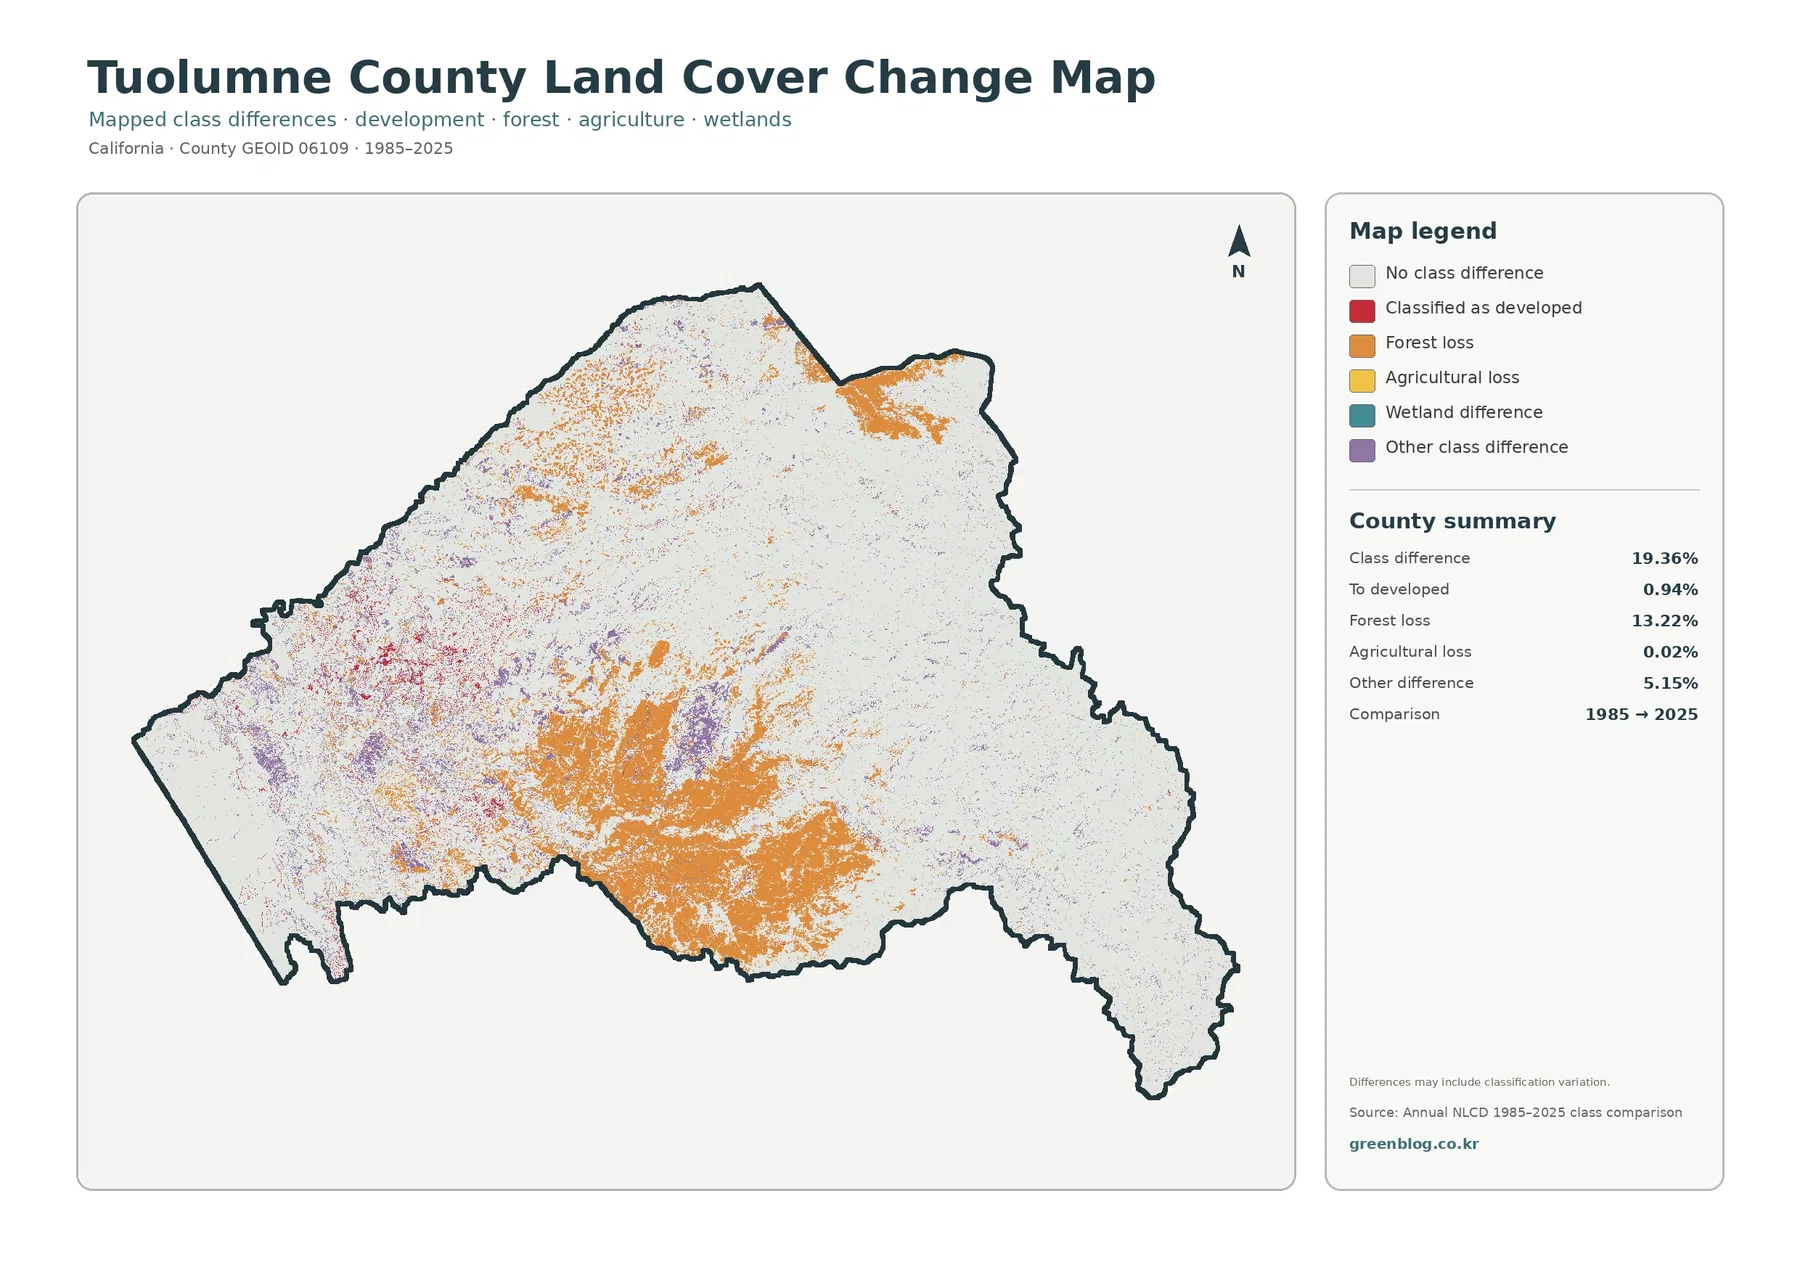
Orange forest-loss pixels are especially noticeable through parts of the central and southern county, with additional concentrations toward the northeast. Red pixels classified as changing to developed land are much more localized and are more common in the western part of the county. Purple other-difference areas are scattered rather than confined to one compact zone. This mixture shows that the long-term map is not describing a single county-wide transition.
The caution printed on the supplied map is important: class differences may include classification variation. Annual NLCD is a raster product, and a cell can change labels because of real vegetation change, disturbance, recovery, improved classification, or differences in how mixed surface types are represented. For that reason, the 13.22% forest-loss category should not be rewritten as a simple claim that 13.22% of the county was deforested.
A better use of the change map is to identify places that deserve a closer look. Researchers can compare a highlighted area with annual imagery, wildfire records, forest-management information, or local project records. Tuolumne County has a well-documented wildfire and fuels-management context, but this map alone cannot assign a cause to any individual orange or purple patch.
Sierra geography provides useful context for reading the colors
County documents describe Tuolumne as a central Sierra Nevada county crossed by major river systems and containing large federal-land holdings. The Stanislaus River and Tuolumne River run generally east to west, and major reservoirs include Lake Don Pedro and New Melones Lake. Although the land-cover map is not a named hydrography map, the visible blue areas make more sense when viewed within that river-and-reservoir setting.
The county also spans a large elevation range, from low western foothills to high Sierra terrain. That gradient is not shown as contour lines here, yet it helps explain why forest, shrubland, grassland, water, and barren cover can appear in different combinations from west to east. Readers should avoid turning that relationship into a precise elevation rule, because the supplied maps do not contain a numeric elevation layer. The geographic context simply helps interpret the broad contrasts.
A second piece of context is land management. Much of the county is within Yosemite National Park, Stanislaus National Forest, or other government-managed land. Those jurisdictions matter for understanding the county, but they must not be confused with the land-cover legend. A green forest pixel tells you that forest is the mapped surface class; it does not tell you who owns the land or which agency manages it.
How to choose among the four maps
For a quick county overview, start with the general land-cover map because it preserves the widest range of classes. It is the best option for comparing forest, shrubland, grassland, barren ground, water, wetlands, agriculture, and developed cover in one frame. If the goal is to explain the county’s natural-versus-agricultural balance, the forest-and-farmland version is easier to read because it groups the information into fewer categories.
Use the impervious map when the question is about concentrated built surfaces. Its percentage scale makes the western settlement cluster stand out even where the general land-cover map may mix developed and vegetated cells. For historical comparison, add the change map after reviewing the 2025 pattern. Seeing the current cover first helps prevent a colored change pixel from being mistaken for the county’s present-day land-cover class.
The four maps can also serve different presentation needs. A classroom lesson on Sierra landscapes may use the general and forest-focused maps. A watershed or runoff discussion may benefit from the impervious map together with the visible water features. A research briefing on long-term landscape change can use the 1985–2025 comparison, provided the classification caveat is included. Choosing only the maps that answer the actual question usually produces a clearer presentation than displaying all four without explanation.
Resolution, scale and what these files cannot tell you
Annual NLCD products are produced at 30-meter spatial resolution. In plain terms, the source data divide the landscape into raster cells, and each cell represents a generalized surface condition. Small roads, narrow streams, scattered buildings, or tiny vegetation patches may be mixed within one cell. The maps are therefore well suited to county-scale patterns but are not substitutes for parcel surveys or site inspections.
The observation year matters as well. The current-cover maps represent 2025 classification, while the change image compares 1985 with 2025. Construction, vegetation disturbance, recovery, reservoir conditions, or other changes after the mapped year will not be reflected until a later dataset is used. Classification methods also have uncertainty, so boundary edges between classes should not be treated as exact surveyed lines.
The download contains the four original JPG maps shown in this article: land cover, forest and farmland, impervious/developed land, and land-cover change. Each image is 2480×1754 pixels. The package does not mark these files as meeting the A3 high-resolution reference, so large-format printing should be tested before final production, especially when small legend text must remain easy to read.
Frequently Asked Questions
Why does Tuolumne County show so little impervious surface?
The supplied summary reports a mean impervious value of 0.58%, and the map shows higher values concentrated mainly in the western settled area. Most of the county is covered by forest, shrubland, grassland, barren land, or water rather than continuous built surfaces. The result should be read as a county-scale surface pattern, not as a statement that development is absent from rural communities.
Does the 13.22% forest-loss category mean that 13.22% was definitely deforested?
No. The change layer marks cells that were classified as forest in the earlier comparison and as another class in 2025, and the map itself warns that class differences may include classification variation. A specific cause such as wildfire, timber harvest, development, or natural vegetation change requires additional evidence from imagery and local records.
Can these maps be used to check zoning or a property boundary?
No. Land cover is a remote-sensing classification of surface conditions, not a legal parcel or zoning dataset. Tuolumne County maintains separate GIS layers for parcels, roads, zoning-related information, and General Plan land-use designations. Those official layers are the appropriate starting point for property or regulatory questions.
Map File Information
The ZIP contains the four original Tuolumne County land-cover JPG maps used on this page for offline reference, presentations, classroom material, and print layouts.
- Included Files: Land cover, forest & farmland, impervious/developed land, and land-cover change
- File Type: Four JPG maps in one ZIP
Related Maps
- Alameda County California Land Cover Map
- Alpine County California Land Cover Map
- Amador County California Land Cover Map
Sources and Further Reading
The percentages and mapped classes discussed above come from the supplied 2025 Annual NLCD-based map set. The county context is supported by official Tuolumne County documents and GIS pages, while the federal links below explain the Annual NLCD data and classification system.
- USGS Annual NLCD Collection 1.2 Land Cover — official information on the 2025 Annual NLCD release, 30-meter products, and land-cover data.
- MRLC Annual NLCD Data — official access point for Annual NLCD products and related land-cover datasets.
- Tuolumne County 2024 Hazard Mitigation Plan — county geography, elevation range, rivers, reservoirs, communities, and public-land context.
- Tuolumne County GIS — official GIS resources for roads, parcels, planning layers, and other information that should not be confused with land cover.
Green Map creates custom-edited map images using open geographic data sources such as geoBoundaries, Natural Earth, OpenStreetMap, and government open data.
These maps are edited visual materials, not raw data files, and are provided for education, documents, presentations, and graphic reference.