Mercer County is mostly farm country, but its western edge looks very different from its interior. The 2025 land-cover summary assigns 79.28% of the county to agriculture, while the Mississippi River side contains a much more varied mix of water, wetlands, forest, and small river communities. The four maps on this page let you compare that contrast from several angles rather than treating the county as one uniform agricultural block.
All four original JPG maps are available together in one download. The general land-cover map is the quickest overview, the forest-and-farmland map clarifies the wooded drainage pattern, the impervious map isolates built surfaces around Aledo and other communities, and the 1985–2025 map marks places where the classified cover differs between the two dates.
Table of Contents
Why the western edge looks unlike the farm-dominated interior
Mercer County lies in western Illinois with the Mississippi River along its western boundary. Illinois emergency-management planning material identifies Aledo as the county seat and notes U.S. Highway 67 and Illinois Routes 17 and 94 as important transportation routes. Local communities are spread across the county: Aledo sits near the middle, New Boston and Keithsburg are on the river side, and places such as Viola, New Windsor, and Sherrard occupy the eastern and northeastern part of the county.
That geography helps explain the first impression of the maps. Agriculture covers 79.28% of the 2025 classification, forest accounts for 10.66%, developed land 5.89%, wetlands 2.45%, and water 1.46%. Grassland is only 0.20% and shrubland 0.02%. Large yellow agricultural areas therefore dominate the interior, but the river margin and branching wooded strips keep the county from appearing as an uninterrupted field pattern.
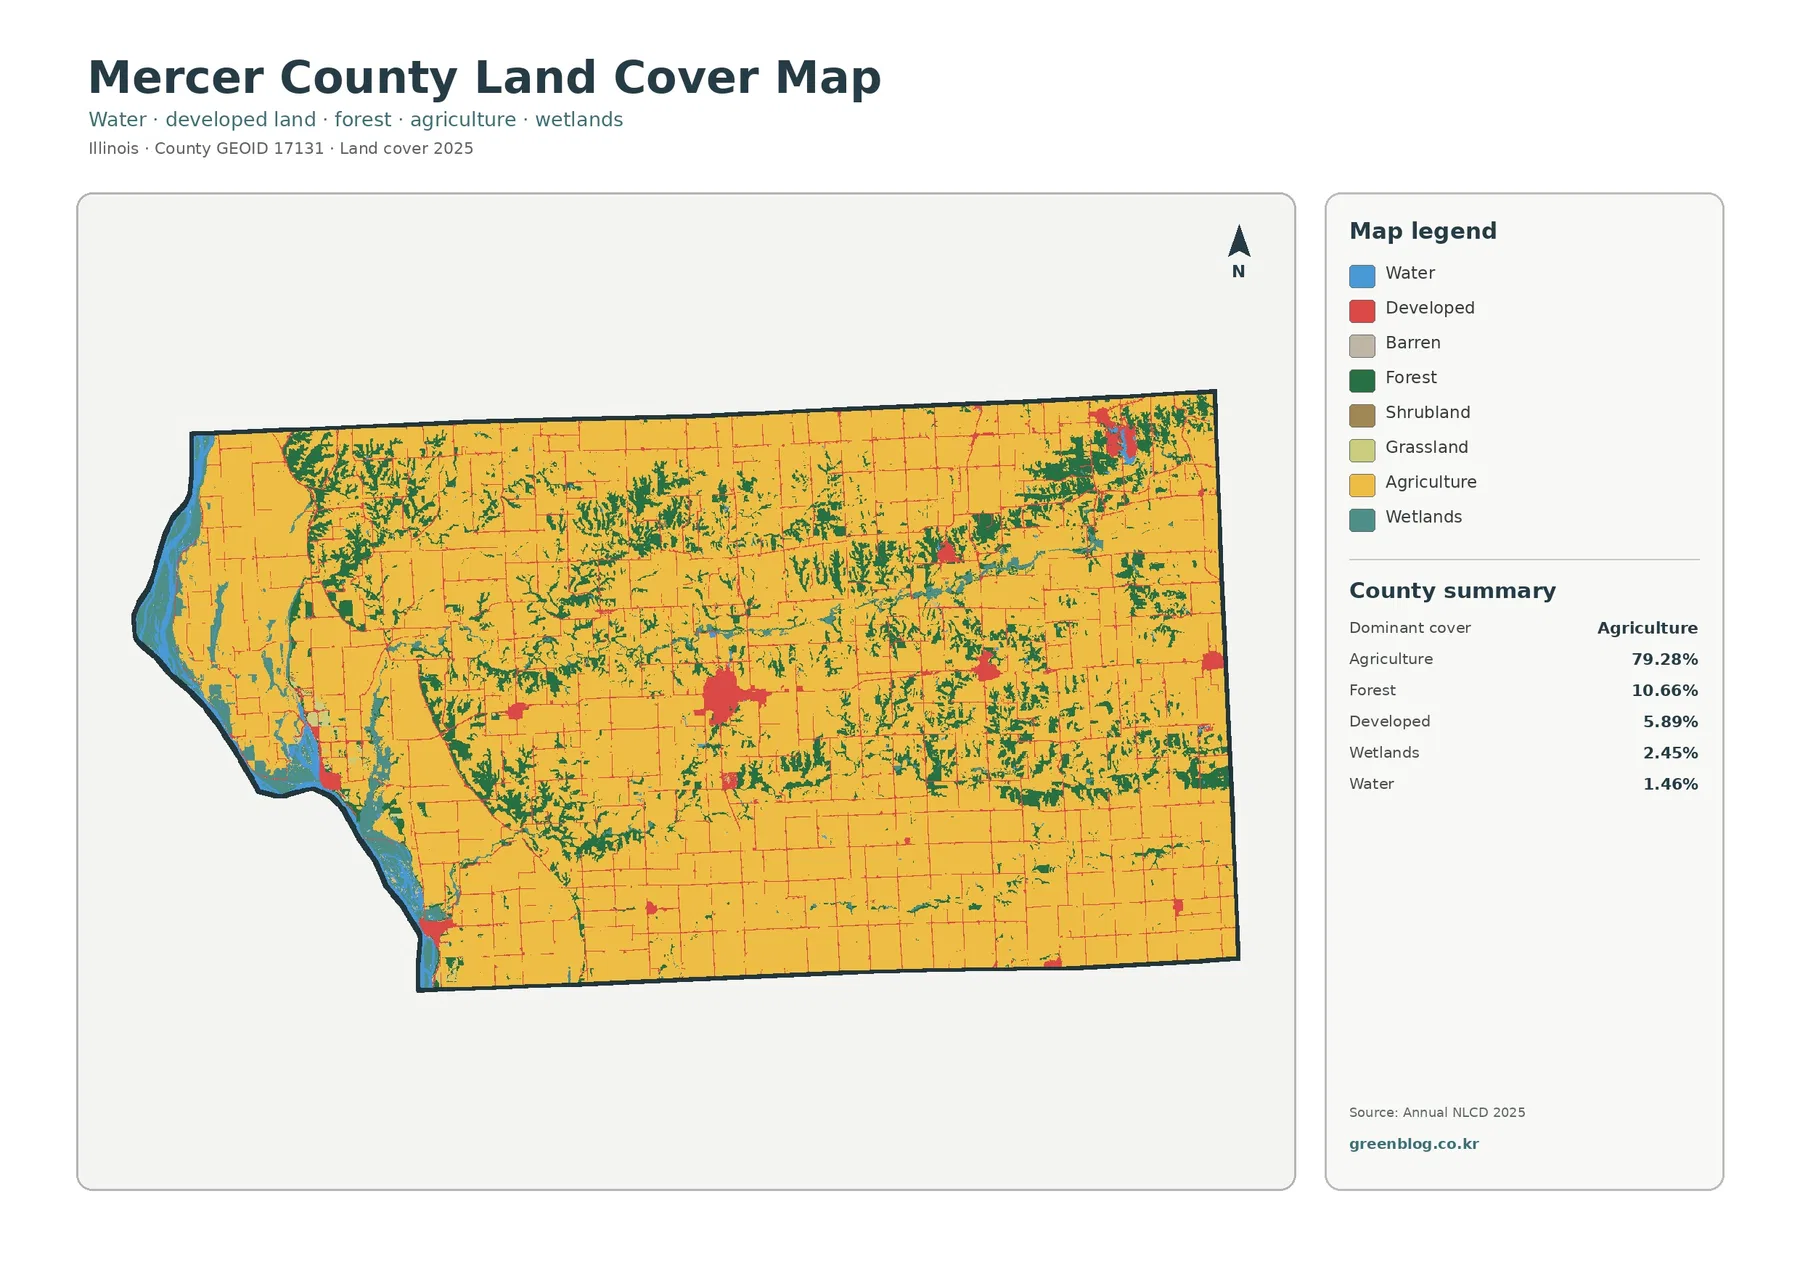
The general map makes the west-to-interior contrast easy to see. Blue water and teal wetlands form the most continuous nonfarm pattern along the Mississippi side, especially around the bends and backwater areas in the southwestern and western part of the county. Forest occurs beside parts of this river corridor, but it also reaches inland in narrow, branching bands that cut across the agricultural background. Those wooded bands are more useful to read as drainage-related landscape features than as one large forest block.
Aledo forms one of the clearest inland developed clusters. Smaller red patches appear toward the northeast and east near the locations of communities such as Sherrard, Viola, and New Windsor, while New Boston and Keithsburg add smaller built areas along the river side. Thin developed lines also cross the fields where roads are mapped. The result is a county where settlement is distributed among several compact communities rather than spread evenly across the agricultural land.
The river margin deserves separate attention because it contains several cover types in a relatively narrow part of the county. The U.S. Fish and Wildlife Service describes the Keithsburg Division of Port Louisa National Wildlife Refuge as a mosaic of wetland and bottomland forest habitat immediately north of Keithsburg. That official description matches the complex pattern seen on the map and provides useful context for the wetland, forest, and water colors along the Mississippi floodplain.
Built surfaces stay compact around towns and roads
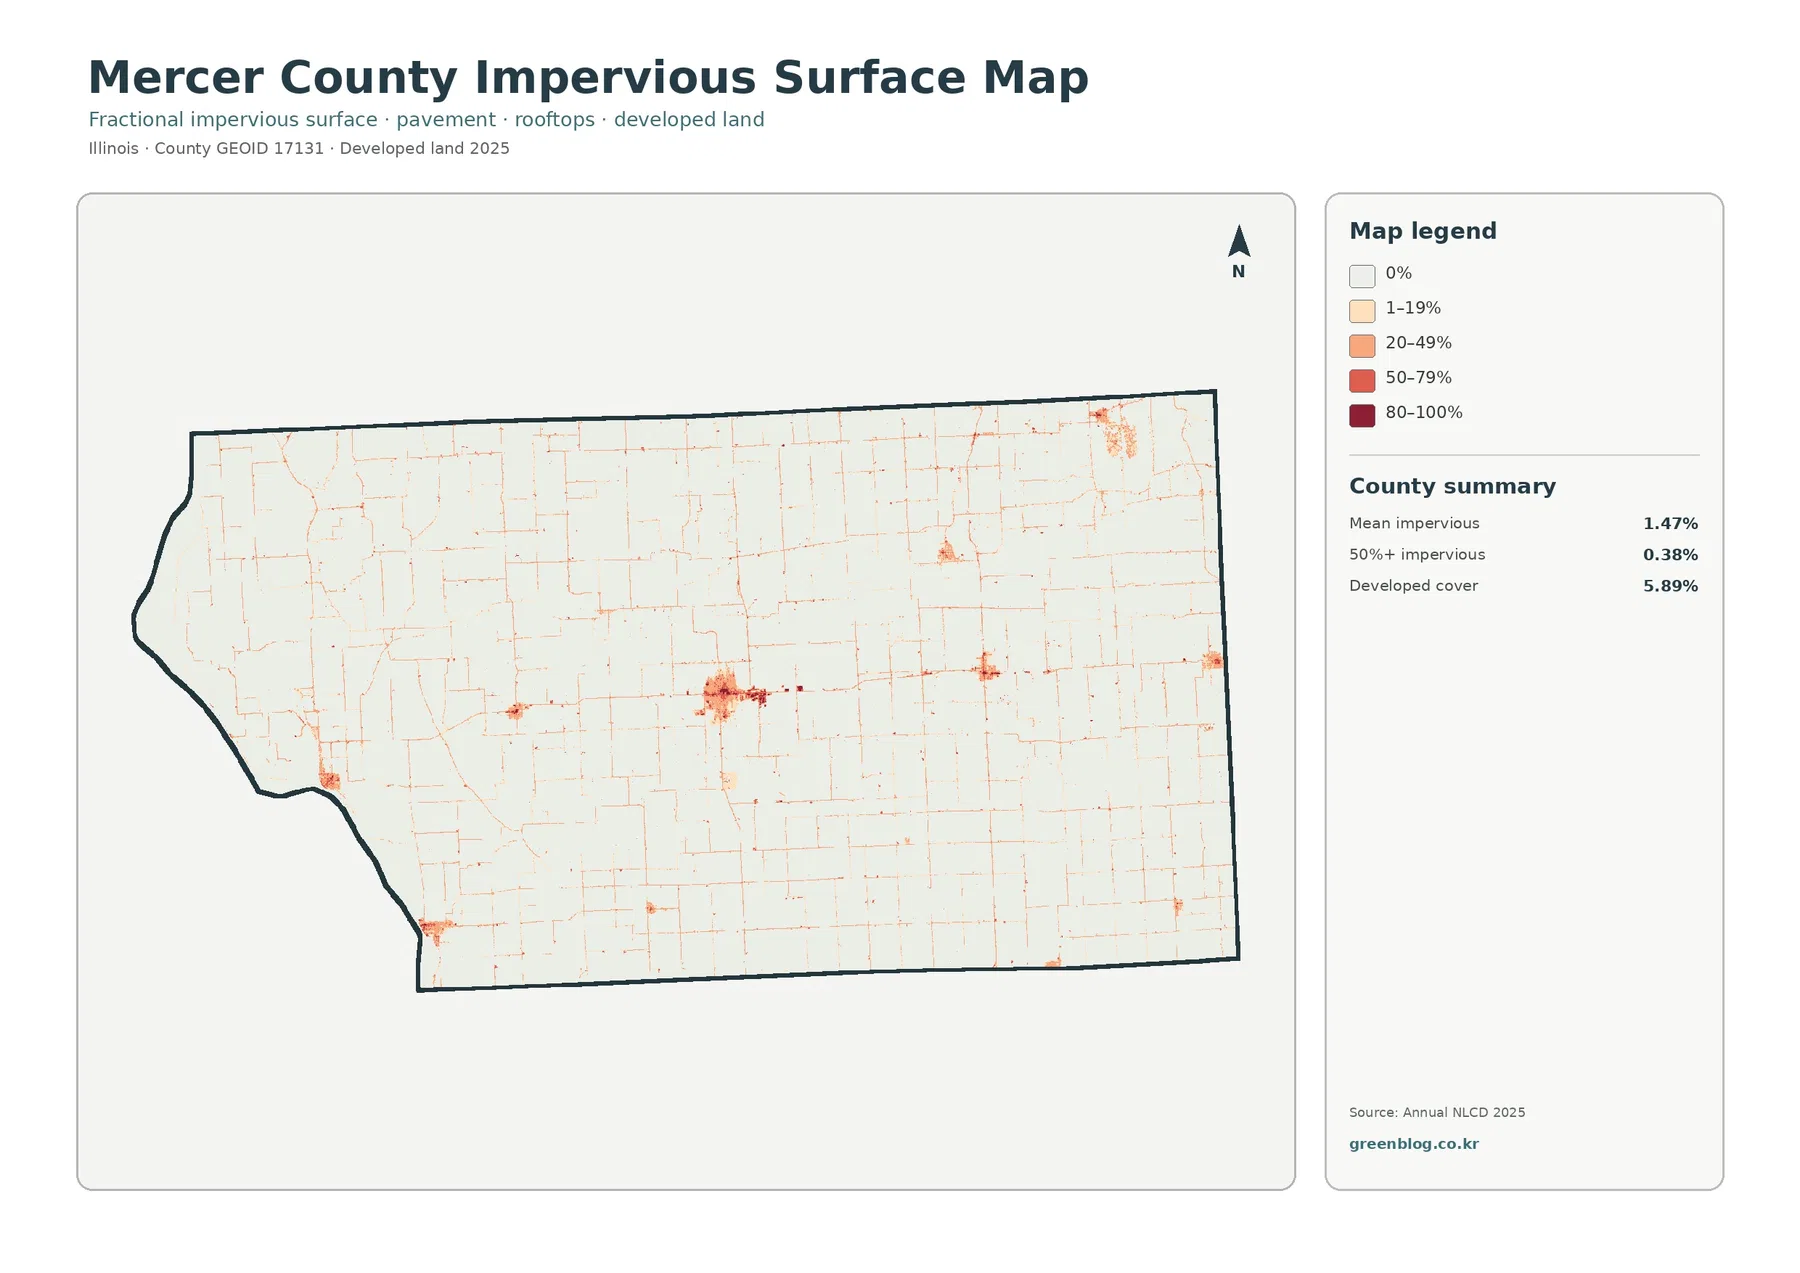
Impervious surface means pavement, rooftops, parking areas, and other hard surfaces that do not readily absorb water. The countywide mean impervious value is 1.47%, and only 0.38% of the mapped area falls in cells that are at least 50% impervious. Those low numbers fit the visual pattern: most of the county remains very pale, while stronger values are concentrated in compact settlements and along narrow transportation lines.
Aledo stands out as the largest central concentration. The built surface extends beyond a single point and connects to several roads that continue into the surrounding farm landscape. Other communities create separate, smaller clusters rather than one continuous urban belt. Along the eastern side and northeast, several patches correspond to the locations of towns and villages; along the Mississippi side, smaller concentrations appear near New Boston and Keithsburg.
The road pattern is easier to notice here than on the general land-cover map. Many rural roads appear as fine lines through areas that are otherwise close to zero impervious cover. This distinction matters when using the maps for a presentation or local overview. A red developed class on the general map combines several kinds of built cover, while the impervious map gives a more direct view of how much hard surface is present within each raster cell.
Impervious percentage should not be confused with zoning or development rights. A dark cell does not identify a commercial parcel, and a pale cell does not mean land is available for construction. The map describes the surface that was classified at the observation date. Parcel ownership, building permits, drainage requirements, and local zoning must be checked in separate county or municipal records.
Farm fields dominate, but wooded drainage lines break up the pattern
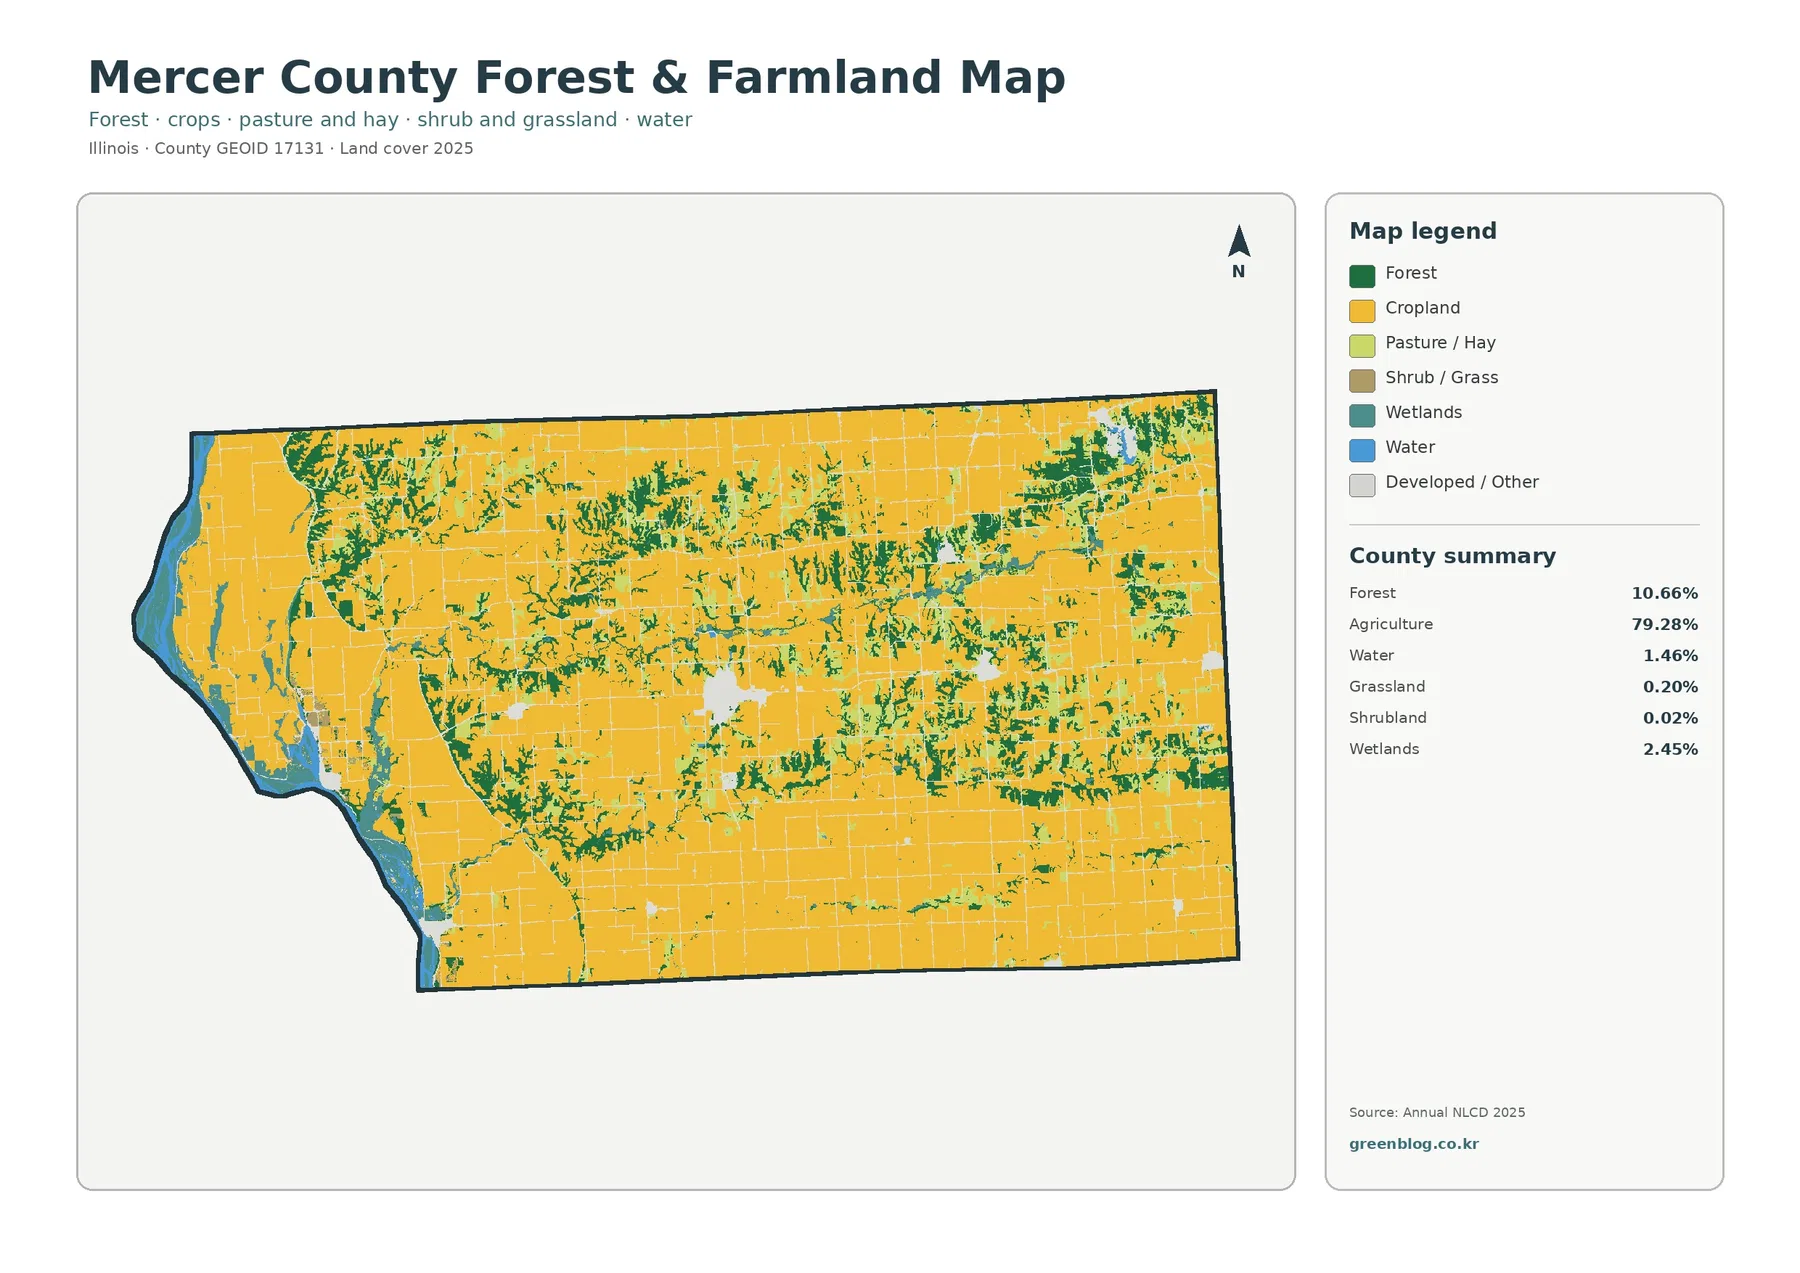
The forest-and-farmland view removes some of the visual competition from the general map. Cropland becomes the dominant yellow background, making the 10.66% forest share easier to locate. Wooded cover is not evenly scattered. It forms branching strips through parts of the north, center, and east and becomes more complex toward the Mississippi River, where forest sits beside wetland and open-water classes.
On the western edge, the relationship among water, wetlands, forest, and agriculture is especially clear. Fields approach the river corridor in some places, but they are interrupted by backwater areas, wetland cells, and wooded floodplain cover. Around the Keithsburg portion of Port Louisa National Wildlife Refuge, the map’s mixture of green, teal, and blue is consistent with the refuge description of sloughs, wetlands, and bottomland timber.
Farther inland, cropland is much more continuous. Forest often follows irregular lines rather than the rectangular field geometry, which makes the wooded areas easy to distinguish even though they occupy a much smaller share of the county. This map is useful when the question is not simply “How much farmland is there?” but “Where does forest remain connected within a largely agricultural county?”
Grassland and shrubland are minor classes in the county summary, at 0.20% and 0.02%. Small patches of these colors should therefore be interpreted cautiously and not treated as major landscape zones. The most informative comparison is among cropland, forest, wetlands, and water. Together they show how a heavily farmed interior meets a much more varied river floodplain.
It is also important to remember what “forest” and “cropland” mean on a land-cover product. These are surface classes derived from remote sensing and classification, not property descriptions. A woodland class does not establish conservation status, and a cropland class does not identify the crop grown on a specific field. The map is best used to compare broad patterns across the county.
What the 1985–2025 comparison actually means
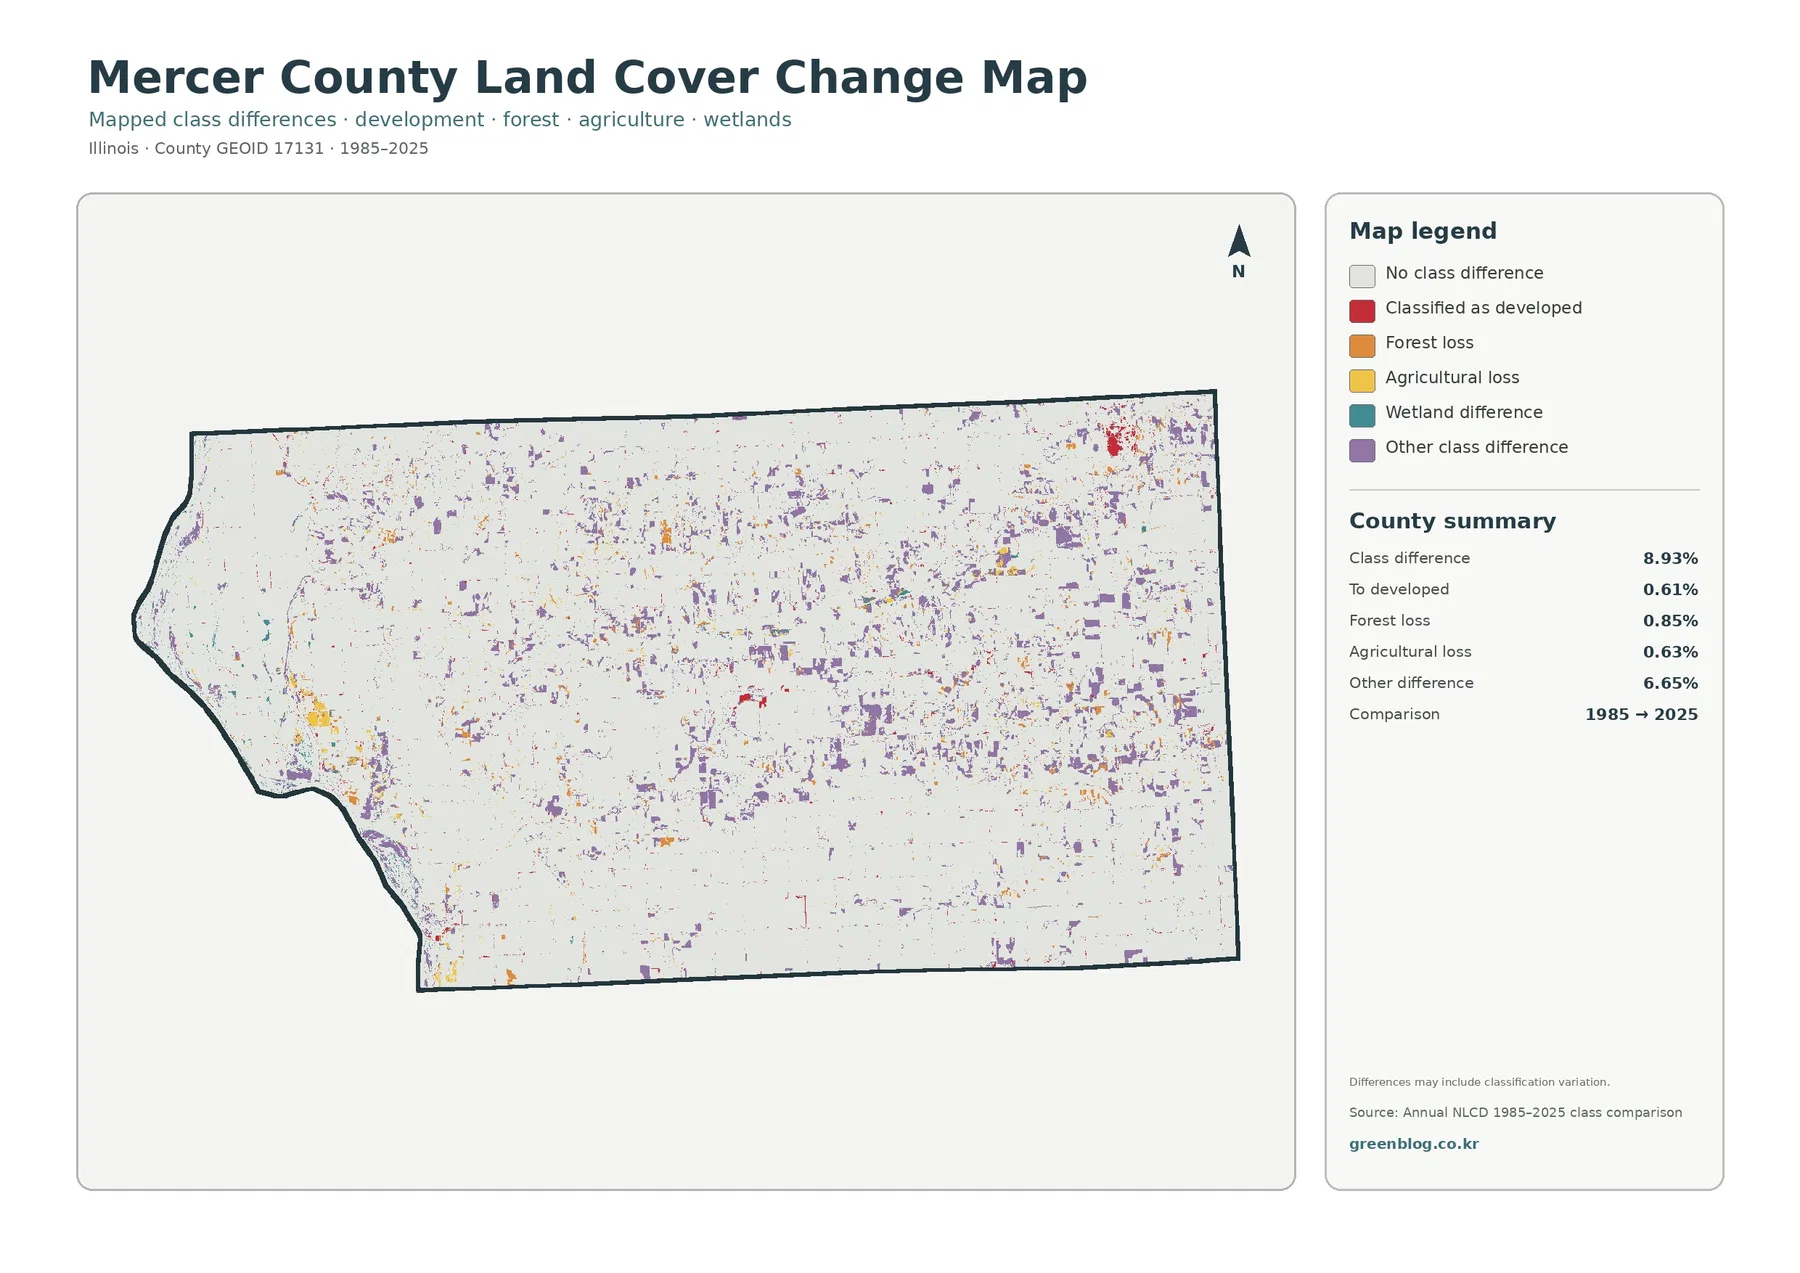
The change map reports a total class difference of 8.93% between 1985 and 2025. Within that total, 0.61% is mapped as change to developed, 0.85% as forest loss, 0.63% as agricultural loss, and 6.65% as other class difference. The legend also includes wetland difference, but the map summary does not provide a separate percentage for that category. It is therefore better to discuss its mapped location rather than invent an exact value.
Most of the county remains light, indicating no mapped class difference in those cells. Colored differences are scattered rather than forming one continuous zone. Patches occur near communities, along some roads, around wooded drainage features, and in parts of the river corridor. The northeast contains several noticeable areas of difference, while the Mississippi side includes a mix of categories where water and wetland boundaries are naturally complex.
The 8.93% figure is not a development-growth rate. Only a portion of the mapped differences is classified as “to developed,” and the largest reported component is the 6.65% other-difference category. Classification can change because the actual surface changed, but it can also differ where a raster cell contains mixed cover, imagery was acquired under different conditions, or classification methods improved between the two dates.
For that reason, the change map works best as a screening tool. If a particular colored patch is important to a project, compare historical aerial imagery, intermediate-year land-cover data, local records, or field information before drawing a conclusion about when and why the change occurred. This caution is particularly important along the Mississippi River, where open water and wetland boundaries can vary with hydrologic conditions.
Using the four maps together without mixing their meanings
Aledo is a good reference point for comparing the four views. The general map places the developed cluster within the larger agricultural setting. The impervious map then separates the harder built surfaces and road lines from the surrounding fields. The forest-and-farmland map simplifies the same area into a clearer agricultural-versus-wooded comparison, while the change map answers a different question by highlighting cells whose classes differ between 1985 and 2025.
The Mississippi River edge benefits from another combination. Start with the general land-cover map to see water, wetlands, forest, agriculture, and developed areas together. Then use the forest-and-farmland map to emphasize the floodplain vegetation and field boundary. The impervious map helps isolate the smaller built areas near river communities, and the change map can be used last to locate long-term classification differences without assuming that every difference represents permanent land conversion.
In the eastern agricultural interior, the maps reveal subtler details. The general and forest-and-farmland views may look similar at first because cropland is so extensive. Looking more closely, however, wooded drainage lines interrupt the field pattern, and the impervious map exposes the fine road grid and compact town clusters. That side-by-side comparison is more informative than repeating the countywide agriculture percentage.
Scale, raster cells, and limits of the classification
Annual NLCD products classify land cover in 30-meter raster cells. A raster cell is a square unit in the image grid, and one cell can contain more than one real-world feature. A narrow road may share a cell with cropland, or a small stream may share a cell with trees. The final class represents the mapped result for that cell, so boundaries on the map are more generalized than parcel lines or a field survey.
This matters most for small features. Farmstead trees, narrow riparian strips, minor roads, small ponds, and irregular wetland edges can be simplified or blended into a neighboring class. The maps remain useful for county-scale comparison because every area is handled under the same classification framework, but they should not be used to measure a property boundary or determine regulatory wetland limits.
The 2025 maps represent the classification for that observation period. Construction, crop rotation, vegetation removal, restoration, or flooding that occurred later may not appear. Likewise, the 1985–2025 map compares two dates rather than documenting every year in between. A colored change cell does not reveal the exact year of change unless other time-series evidence is added.
For planning context, environmental education, watershed discussion, or county presentation graphics, that level of detail is often appropriate. For parcel-level decisions, use current local GIS, surveys, zoning records, flood maps, soil data, or site inspection as needed. Keeping those purposes separate prevents a useful overview map from being asked to answer questions it was not designed to resolve.
Choosing a map for printing, teaching, or local reference
Use the general 2025 map when you need one image that introduces the whole county. It is the best choice for showing the 79.28% agricultural dominance together with the Mississippi River, wetlands, wooded strips, and settlement clusters. For a lesson focused on farming and natural cover, the forest-and-farmland version removes some categories and makes the contrast easier to explain.
The impervious map is the more direct choice for discussing Aledo, smaller towns, roads, and hard-surface concentration. The change map belongs in a different type of discussion: it helps identify where 1985 and 2025 classifications differ, but it should be presented with its legend and the warning that classification variation may be part of the result. Using only the map that answers the question keeps a page or presentation easier to read.
The downloadable files are 2480 × 1754 pixel JPGs. For printing or slides, it is usually better to place one primary map at a readable size and use a second map only when the comparison adds something important. Shrinking all four onto one small page can make the fine road lines, river-edge wetlands, and change patches difficult to distinguish.
Frequently Asked Questions
What is the dominant land cover in Mercer County?
Agriculture is the dominant 2025 class at 79.28%. Forest accounts for 10.66%, developed land 5.89%, wetlands 2.45%, and water 1.46%. The countywide percentage is useful, but the map also shows that water, wetlands, and forest are much more concentrated along the Mississippi River side than in the interior.
Why is the Keithsburg side more complex than the interior farmland?
Keithsburg lies on the Mississippi River side, where the map includes water, wetland, forest, and agricultural cover in close proximity. The U.S. Fish and Wildlife Service describes the nearby Keithsburg Division of Port Louisa National Wildlife Refuge as a mosaic of wetland and bottomland forest habitat, which provides useful context for the mapped pattern.
Does the 8.93% change value mean Mercer County became 8.93% more developed?
No. The 8.93% figure is the total share of cells with a different mapped class between 1985 and 2025. The map separately reports 0.61% as change to developed, 0.85% as forest loss, 0.63% as agricultural loss, and 6.65% as other class difference. Classification variation can also contribute to the result.
Sources and Reference Material
- MRLC Annual NLCD Data — annual land-cover and related datasets
- USGS Annual NLCD Land Cover Classification — classification and land-cover class guidance
- U.S. Census Bureau TIGER/Line Shapefiles — county boundary reference
- Illinois IEMA Mercer County Hazard Mitigation Plan — Mississippi River boundary, Aledo, and regional transportation context
- U.S. Fish & Wildlife Service Port Louisa National Wildlife Refuge — Keithsburg Division wetland and bottomland forest context
- University of Illinois Extension Agriculture and Natural Resources — agriculture and natural-resource information serving Mercer County and neighboring counties
Map File Information
Download four original JPG maps for Mercer County, Illinois: 2025 land cover, forest and farmland, impervious surface and developed land, and the 1985–2025 land-cover change comparison.
- Included Files: Four original JPG land-cover maps used in this article
- File Type: JPG images packaged in a ZIP archive
- Intended Use: Printing, education, presentations, and map-based projects
Related Maps
- Adams County Illinois Land Cover Map
- Alexander County Illinois Land Cover Map
- Bond County Illinois Land Cover Map
Green Map creates custom-edited map images using open geographic data sources such as geoBoundaries, Natural Earth, OpenStreetMap, and government open data. These maps are edited visual materials, not raw data files, and are provided for education, documents, presentations, and graphic reference.