A Sweden Map has to accommodate one of Europe’s most elongated national shapes while keeping 21 county areas, two prominent Baltic islands, and a dense central-southern boundary pattern readable. Norrbotten alone occupies a broad northern space, whereas Stockholm and several neighboring counties require short labels and leader lines within a much tighter area. A tall page therefore does more than echo the country’s silhouette: it gives both extremes enough room to be understood together.
This collection includes a labeled color map, a labeled black-and-white map, and an unlabeled outline. The same county geometry runs through all three images, allowing readers to move from recognition to testing or custom annotation without learning a new layout. Nearby countries, surrounding seas, inland water shapes, Gotland, Öland, and the Stockholm archipelago also help establish orientation in the labeled editions.
The files are best treated as county-level reference graphics. They do not show Sweden’s 290 municipalities, road routes, elevation, population density, or exact city-point locations. Teachers can select the edition that matches a lesson, while writers and designers can use the maps in reports, regional comparisons, presentations, and carefully sourced thematic graphics.
Table of Contents
Sweden Map Overview
Sweden occupies the eastern side of the Scandinavian Peninsula. Its land boundary with Norway extends along the west and northwest, while Finland meets the country in the far northeast. The Gulf of Bothnia separates much of Sweden from Finland, and the Baltic Sea opens along the southeastern coast. Denmark appears beyond the Skagerrak and Kattegat near the southern end, but it does not share a land border with Sweden.
The labeled maps widen that context by naming the Norwegian Sea, Gulf of Bothnia, Gulf of Finland, Skagerrak, Kattegat, and Baltic Sea. Estonia, Latvia, and Lithuania are placed across the water to the east and southeast. These labels help a reader understand Sweden’s Baltic position without implying that every named country is an immediate neighbor.
County size changes sharply down the page. Norrbotten and Västerbotten dominate the north; Jämtland, Västernorrland, Gävleborg, and Dalarna create a transition toward the center; and smaller counties gather around Stockholm and the lakes of south-central Sweden. Västra Götaland reaches the western coast, Skåne forms the southern tip, and Blekinge occupies a compact southeastern coastal section.
How the County Boundaries and Labels Read
The 21 areas on this Sweden Map correspond to counties rather than municipalities or the three historical lands of Norrland, Svealand, and Götaland. Statistics Sweden currently lists 21 counties and 290 municipalities, so a municipal map would require far more divisions than the supplied images contain. The county scale offers a useful middle level between a plain national outline and a detailed local map.
Labels in the graphics omit Swedish diacritics. Västra Götaland, Östergötland, Jönköping, Örebro, Skåne, and several other official names consequently appear in simplified forms such as Vastra Gotaland, Ostergotland, Jonkoping, Orebro, and Skane. This improves compatibility within the artwork, but readers preparing formal educational or administrative material should restore the correct Swedish spelling in any text they add.
Gotland is both an island and a county, so it stands alone as a labeled administrative area in the Baltic. Öland is also prominent, yet it belongs to Kalmar County rather than forming a separate county. The maps draw major inland water shapes and intricate coastal edges, but they do not name the lakes. “Stockholm” and the other names identify county areas, not precisely located county seats or city markers.
Regional Color Map
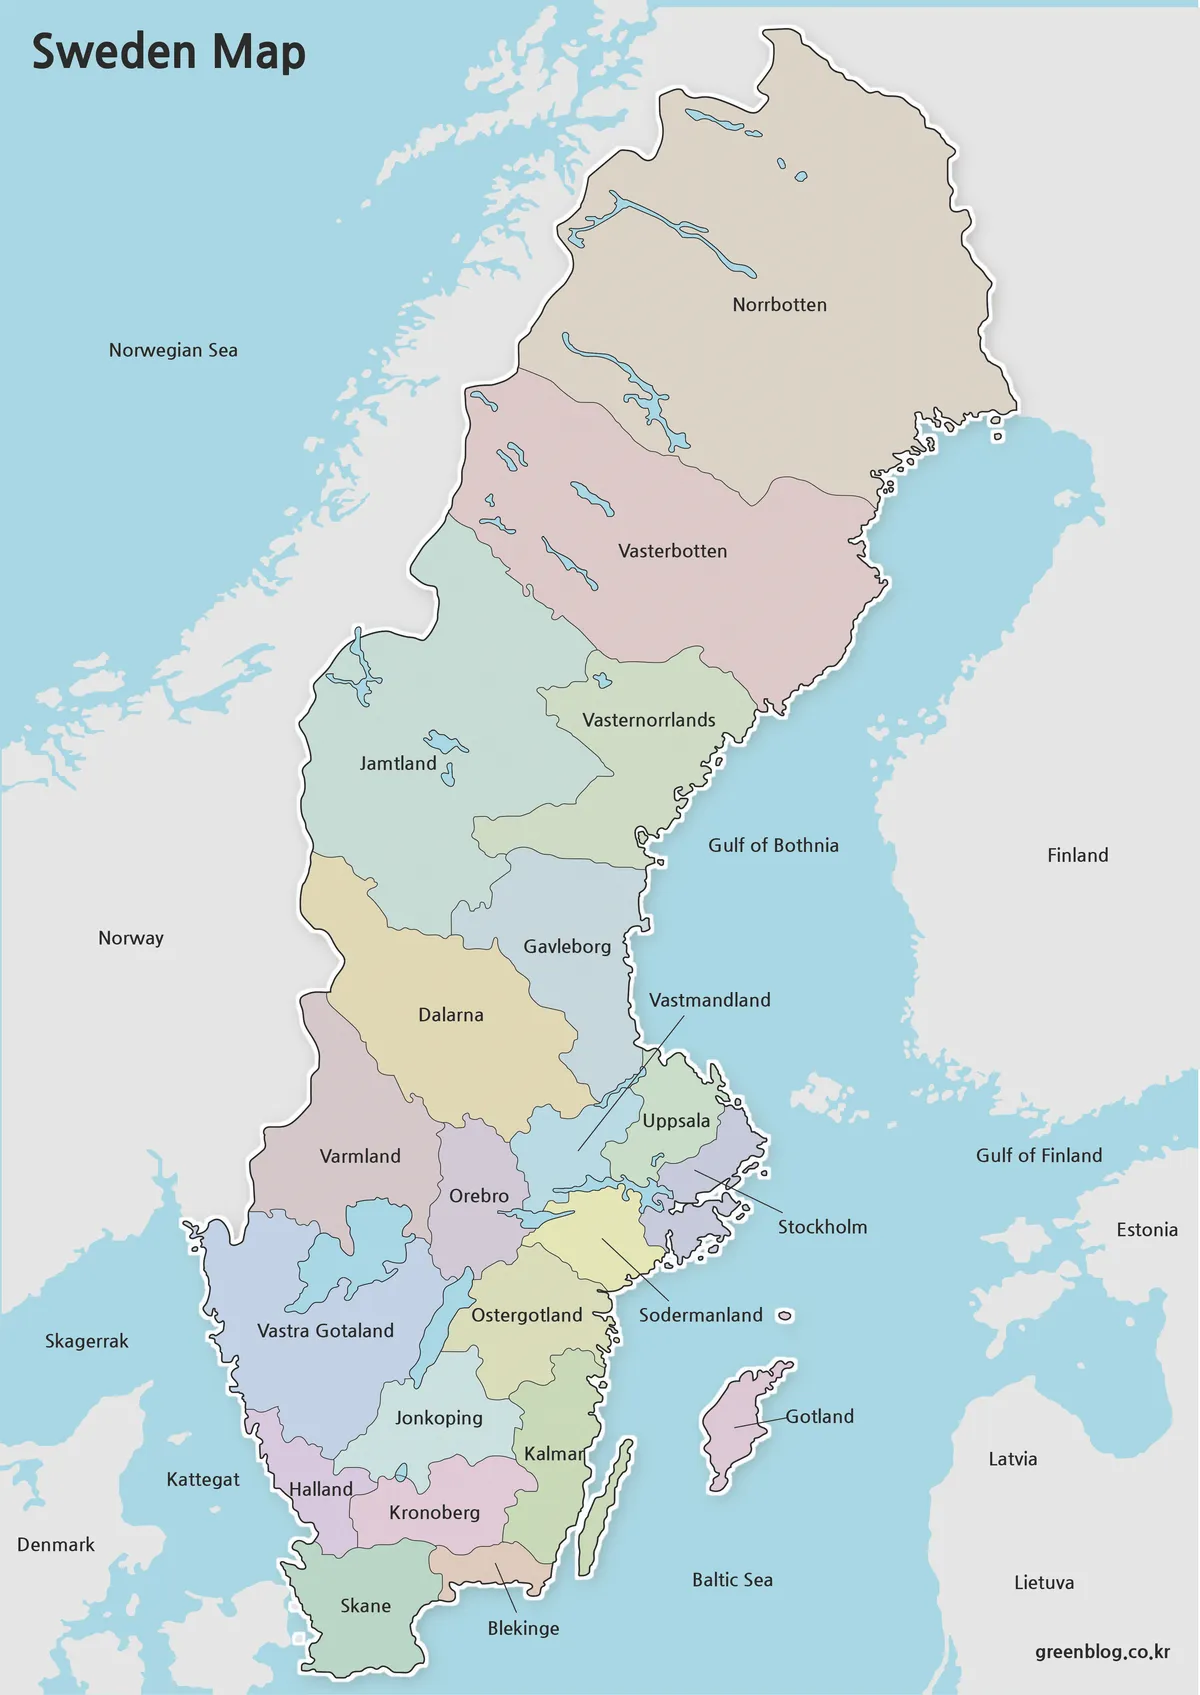
The color edition separates adjoining counties with a restrained pastel palette while using blue for water and gray for surrounding land. This makes the contrast between the broad northern counties and the compact Stockholm-area divisions immediately visible. The palette is categorical only: no color represents population, climate, politics, elevation, or another measured value.
Choose this Sweden Map when the first task is to identify or compare county positions. It works well on a presentation slide introducing the national administrative pattern, beside a discussion of northern and southern scale, or as a reference for county-level statistics supplied from another source. Gotland and Öland remain easy to distinguish because their fills differ from the adjacent mainland counties and surrounding sea.
Readers should still consult the labels rather than identifying counties by color alone, especially after the image has been printed on a monochrome device or displayed through a projector with reduced color contrast.
Black and White Printable Version
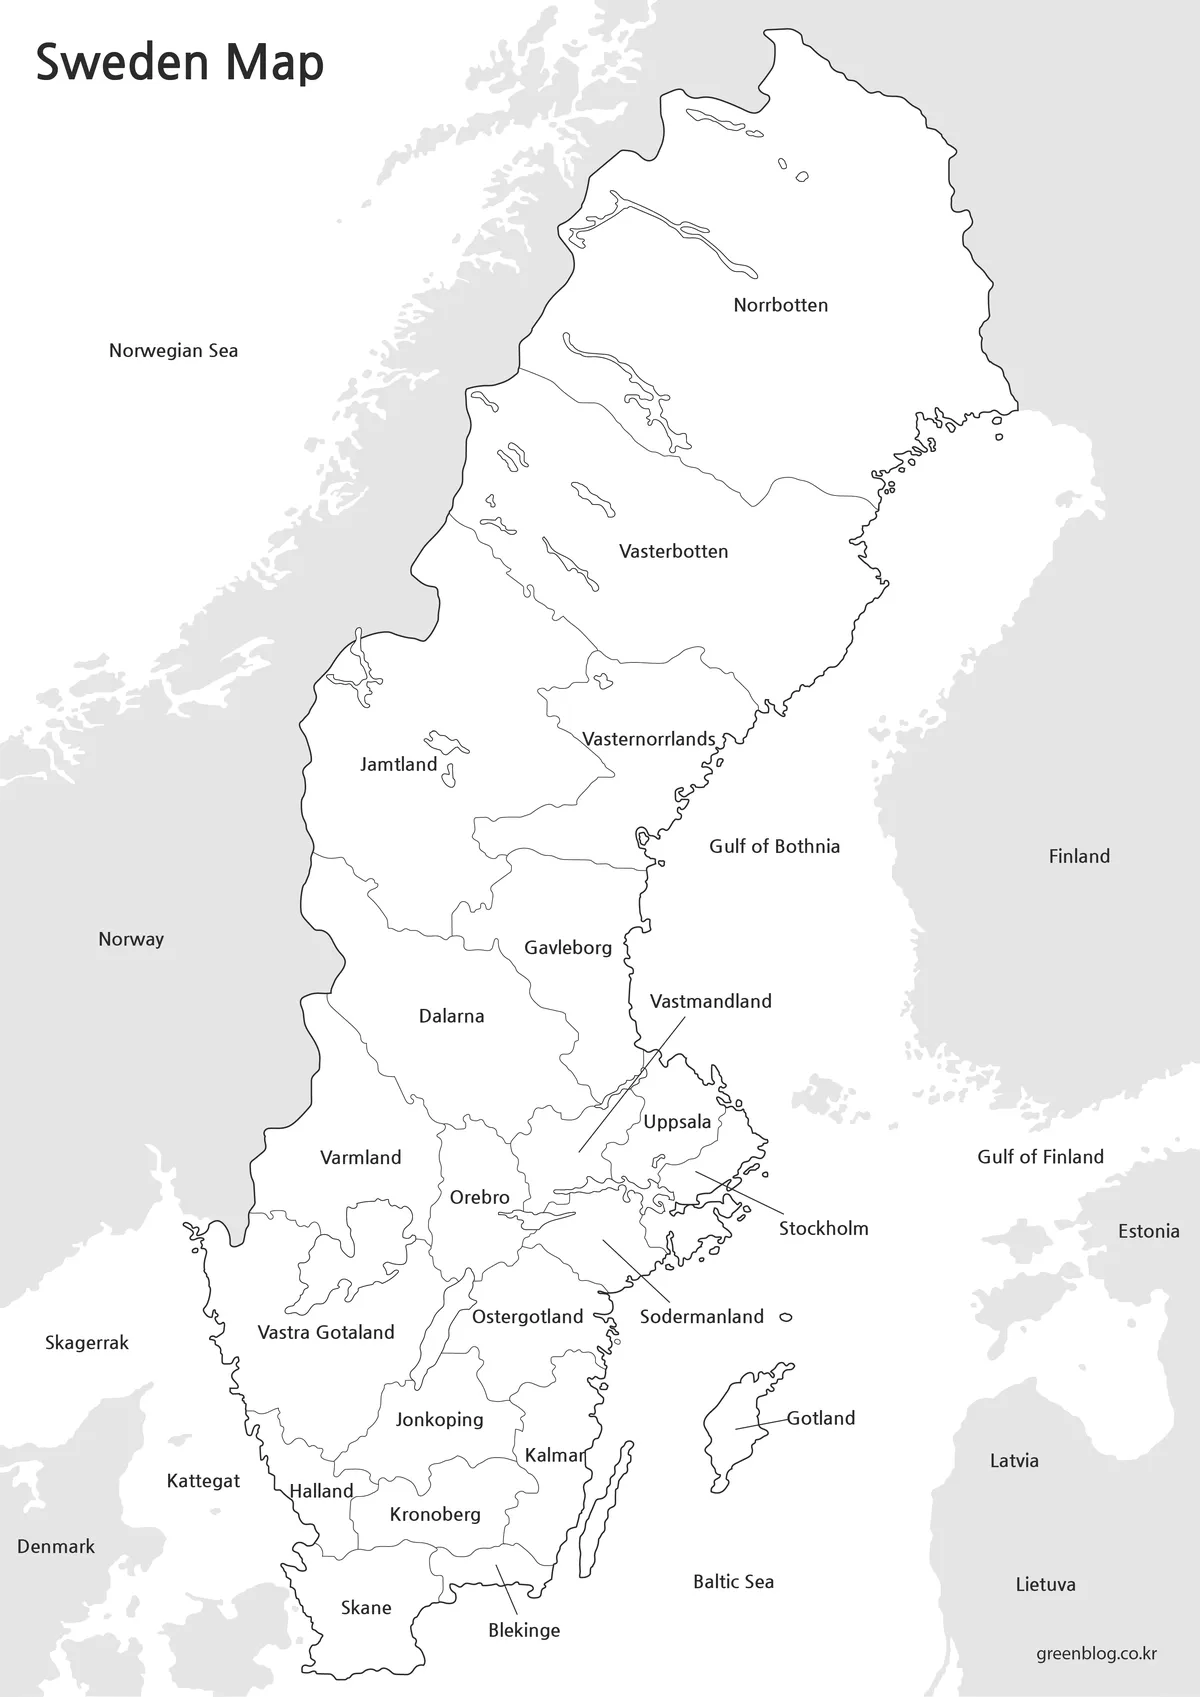
The black-and-white Sweden Map retains the 21 county names, internal boundaries, surrounding place names, seas, islands, and water outlines while removing the pastel fills. White county interiors and dark linework make the edition suitable for reports, photocopied handouts, and worksheets in which students highlight selected counties without covering the original labels.
This is also the better reference when a document already has a strong color system of its own. A teacher might ask learners to find the counties bordering Norway, distinguish Gotland from Öland, or trace the progression from Norrbotten to Skåne. If the page will be reduced substantially, print one proof first: the compact boundaries and leader lines around Stockholm set the practical minimum for legibility.
Blank Outline Map for Editing
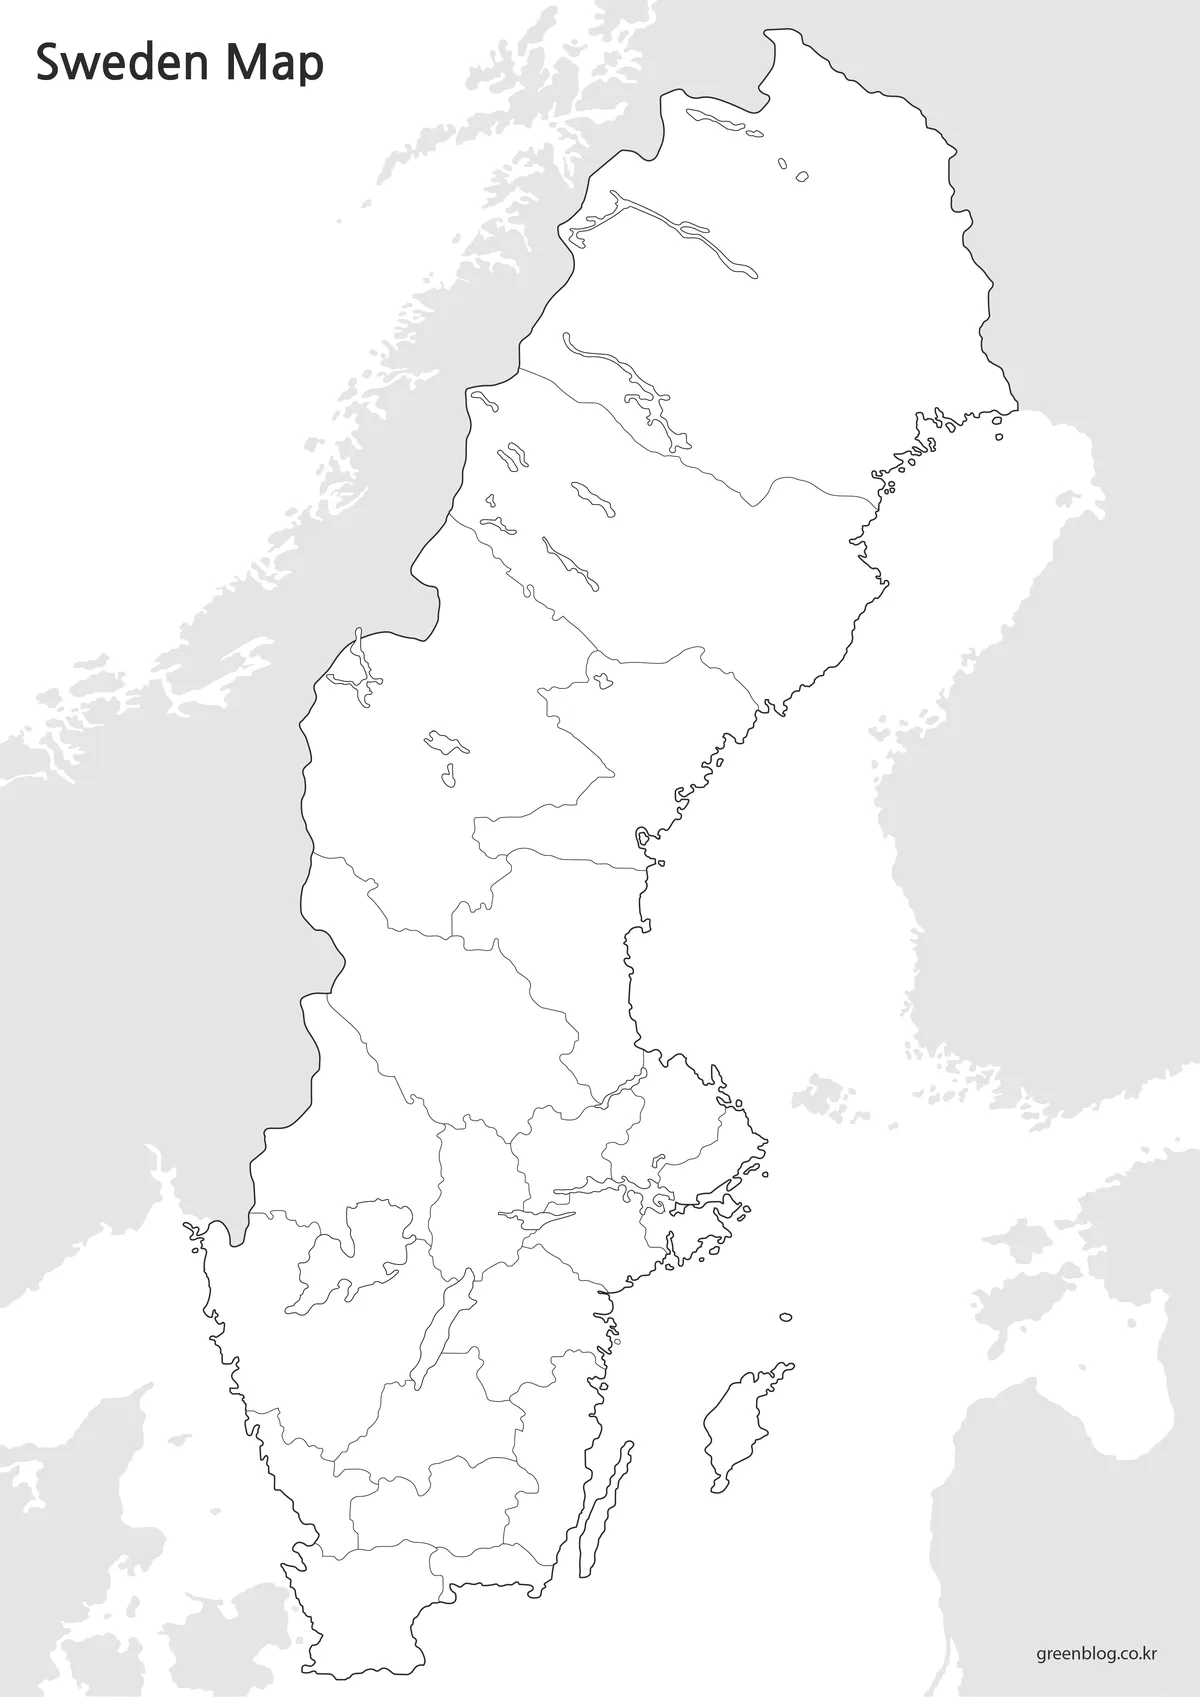
The outline Sweden Map removes county, country, and sea labels as well as colored water. It preserves Sweden’s outer shape, the 21 internal county divisions, major inland water shapes, Gotland, Öland, nearby coastlines, and the fine island pattern around Stockholm. The printed graphic title remains, but the geographic field is otherwise open for user-added information.
For a labeling exercise, students can write all county names or focus on a regional subset. A custom project might shade counties by a properly sourced variable, add county-seat points, mark a simplified journey, or group areas into Norrland, Svealand, and Götaland with a separate legend. Those historical lands are not the same administrative units as the 21 counties, so any grouping should be explained clearly.
The supplied image is a raster asset, not a vector boundary file. Add text, arrows, fills, and symbols as annotation layers, preserve an untouched master, and test the final export at its intended size. The outline is useful as a visual base, but it should not be presented as an official boundary dataset or used for precise surveying.
Built for Printing and Presentation Use
The published Sweden Map images use portrait canvases approximately 1,200 pixels wide and 1,695–1,697 pixels high. Preserve that tall aspect ratio when placing them in a document or slide; independent horizontal or vertical stretching distorts county proportions and changes the apparent relationship between mainland Sweden, Gotland, and the neighboring coast.
A full-page portrait placement gives Norrbotten enough height without forcing the southern counties into a cramped strip. On a landscape slide, place the map beside a concise text panel instead of cropping it into a banner. Leave margin around the northern tip, the Skåne and Blekinge labels, and the outer sea labels so that automatic print scaling does not remove context.
Version choice should follow the reader’s task. Use color for fast county separation, monochrome for a labeled handout or restrained report, and outline for recall exercises or original annotations. A Sweden Map from this set can support county comparison, but route planning requires a transport map, terrain study requires a physical map, and municipal analysis requires boundaries more detailed than those shown here.
When adding data, record its date, unit, and source, then create a legend that is visually distinct from the original county colors. When adding locations, use separate point symbols so a county name is not mistaken for a city marker. These small decisions preserve the maps’ administrative purpose and keep later edits understandable to readers who did not create the graphic.
Frequently Asked Questions
These answers explain printing, classroom selection, annotation, and the vertical layout of the Sweden Map collection.
Can I print these maps in large sizes?
Yes. The maps were prepared in high resolution and work well for larger print formats.
Which version is best for classroom use?
The black and white version is often the easiest option for worksheets and handouts.
Is the outline map editable?
Yes. The outline version was designed for annotations, custom coloring, and graphic editing projects.
Why is the map arranged vertically?
Sweden’s geography extends significantly from north to south, making a vertical layout more practical and readable.
Map File Information
The ZIP archive contains three portrait-oriented county map images for reference, printing, and annotation.
- Included Versions: Labeled color, labeled black and white, and unlabeled outline maps
- File Type: Image files supplied in a ZIP archive
- Intended Use: Lessons, worksheets, presentations, county comparisons, and annotated graphics
Related Maps
Additional Resources
- Statistics Sweden: Counties and Municipalities — Confirm the current number of counties and municipalities and review official regional codes and division changes.
Green Map creates custom-edited map images using open geographic data sources such as geoBoundaries, Natural Earth, OpenStreetMap, and government open data.
These maps are edited visual materials, not raw data files, and are provided for education, documents, presentations, and graphic reference.