A Colorado Map becomes much more informative when it shows the state’s 64 counties rather than only its familiar rectangular outline. The supplied set uses one consistent county layout in three treatments: a softly colored labeled map, a black-and-white labeled map, and an unlabeled outline. Together, they support county identification, classroom exercises, print handouts, presentation graphics, and custom annotation without changing the underlying geography from one version to another.
The county pattern is not uniform. Large blocks dominate parts of the eastern plains and western interior, while Denver, Broomfield, Gilpin, Clear Creek, and nearby counties form a compact cluster that demands closer reading. The images solve that contrast with a landscape layout, leader lines for tight labels, and enough surrounding-state context to orient every edge of Colorado.
These graphics show county names and boundaries, not physical terrain. They do not plot highways, rivers, mountain ranges, elevation, county seats, or travel routes. Readers should therefore use them as administrative reference images and annotation bases rather than navigation maps or authoritative survey products.
Table of Contents
Why This Colorado Map Is Useful
Colorado’s borders meet Wyoming and Nebraska on the north, Kansas and Oklahoma on the east and southeast, New Mexico on the south, and Utah on the west. The southwest corner also meets Arizona at the Four Corners point, although Arizona is not labeled in these images. Naming the surrounding states around the frame makes it easier to distinguish northern, plains, southern, and western counties without adding a compass rose.
The official state data catalog identifies 64 Colorado counties, and this Colorado Map provides a place for every county name in the two labeled versions. The regular outer boundary can make the state look simple from a distance, but internal shapes vary considerably. Eastern counties such as Yuma, Kit Carson, Cheyenne, Kiowa, and Baca are comparatively rectilinear, while many central and western boundaries follow more irregular lines.
The greatest visual density appears around the Denver metropolitan area and the central mountain corridor. Denver is enclosed by adjoining county shapes; Broomfield is small and narrow enough to need a leader line; and Gilpin, Clear Creek, and Jefferson occupy tight spaces nearby. This local complexity is why a county-level view offers more value than a plain state silhouette.
Color County Map for Regional Comparison
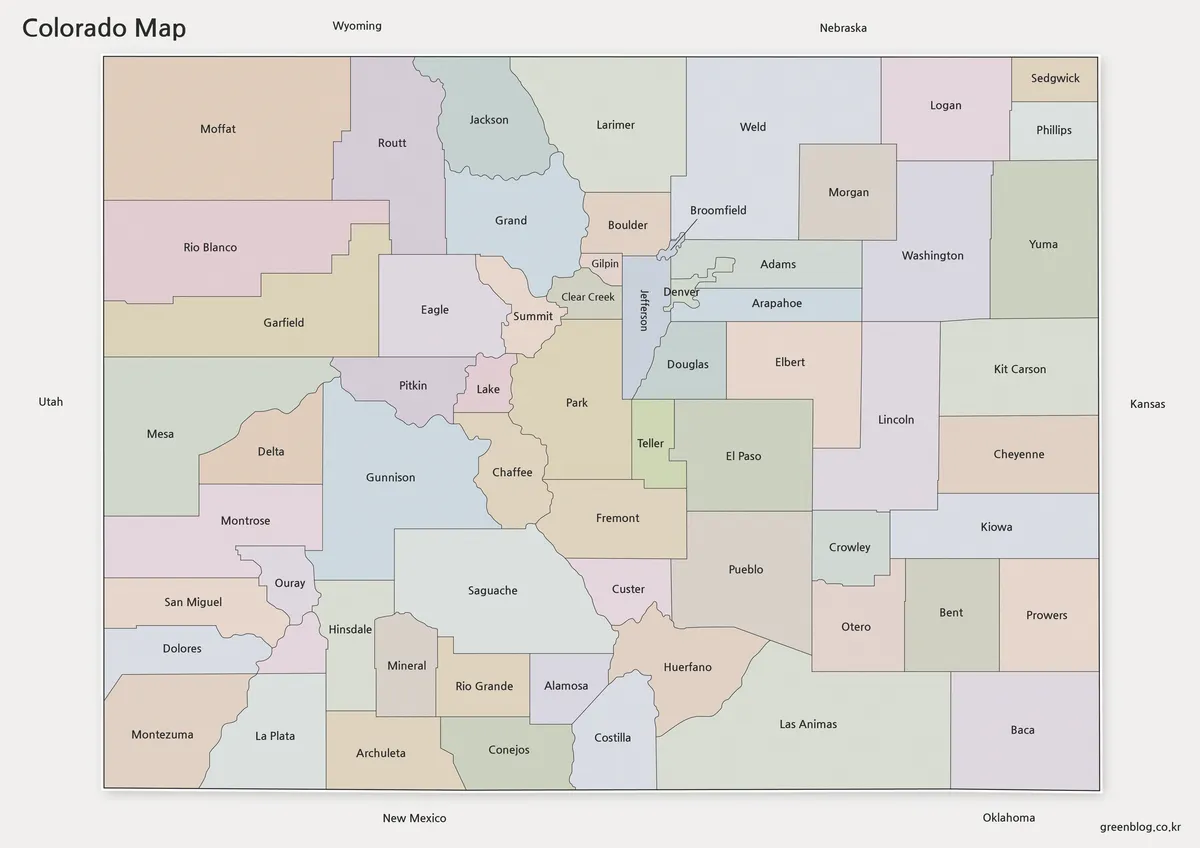
The color edition gives each county a muted pastel fill, helping adjacent shapes remain distinct without implying statistical categories. County names sit directly inside the larger areas. In the central cluster, carefully placed text and callout lines make smaller jurisdictions such as Broomfield and Denver easier to locate while keeping their true boundary shapes visible.
This Colorado Map is the strongest choice for an introductory slide, a state profile, or a reference sheet that viewers must understand quickly. The colors separate neighboring counties, but there is no legend because the fills do not encode population, elevation, politics, land use, or any other variable. Add a separate legend only after applying your own verified data.
The surrounding labels also help with edge orientation. Moffat and Mesa sit against Utah; Larimer and Weld lie along the northern edge; Sedgwick, Phillips, Yuma, Kit Carson, Cheyenne, Kiowa, and Baca form much of the east; and Montezuma, La Plata, Archuleta, Conejos, Costilla, and Las Animas line the south. That sequence can support regional comparison without requiring roads or city markers.
Clean Black and White Version for Printing
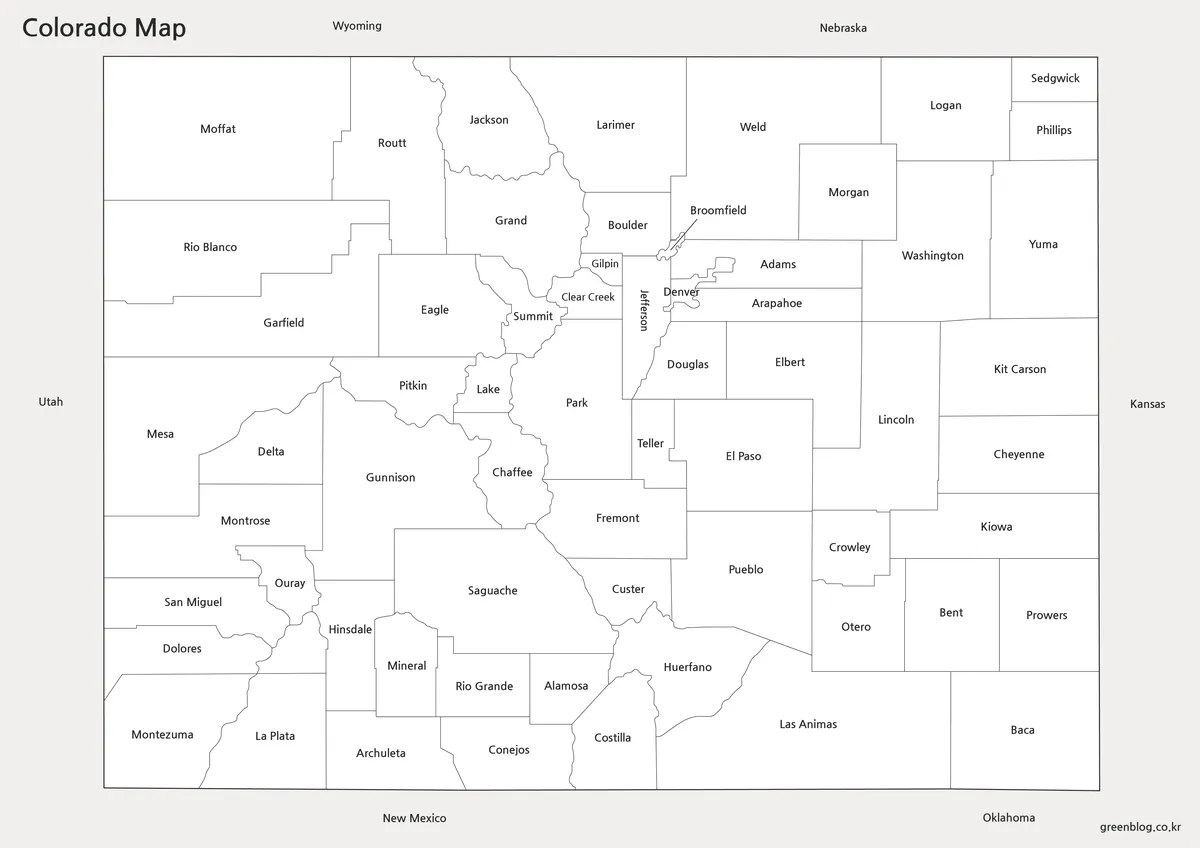
The monochrome version preserves the title, every county label, the complete boundary network, and the names of neighboring states. Removing the pastel fills reduces ink coverage and gives handwritten notes greater contrast. The map remains a reference sheet rather than a blank quiz because learners can still read the county names.
Choose this Colorado Map when the labels are essential but color is unnecessary. It works well beside a reading assignment, in a county-comparison report, or as a discussion handout. Before producing a large batch, print one sample at the intended scale and check the Denver-area labels, since those are the smallest and most tightly arranged elements.
The page also leaves white interiors that can accept symbols, short notes, or light shading. If students must color counties by category, establish a legend and verify the source data first. The existing black lines should remain visible beneath pale pencil or marker tones, whereas dark fills may obscure names and boundaries.
Blank Outline Map for Editing Projects
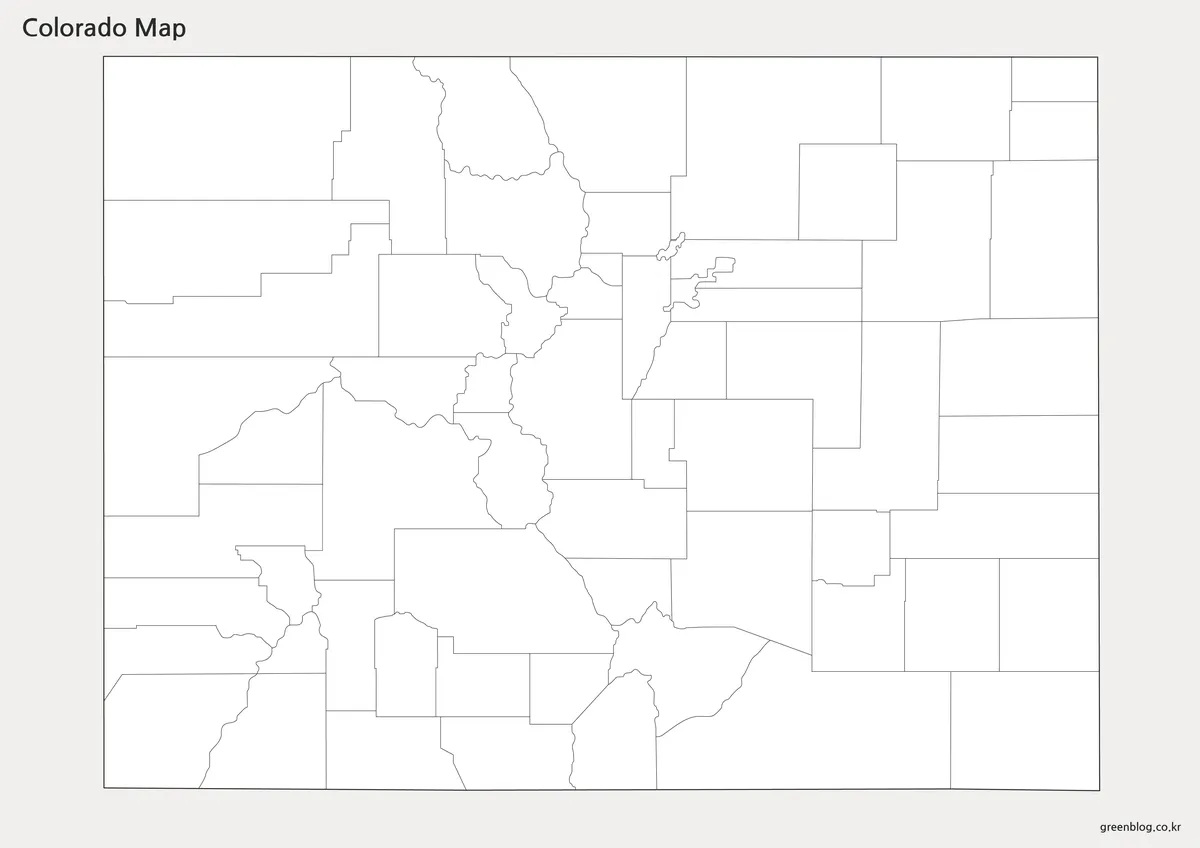
The outline edition removes county names, neighboring-state labels, and all color while retaining the state border and internal county lines. It is intended as a visual base for labeling exercises, thematic coloring, presentation overlays, and custom symbols. Because the county geometry matches the labeled maps, users can keep one version nearby as an answer reference.
Use the blank Colorado Map when the activity depends on recall or when existing text would compete with new information. Students can identify border counties, compare the eastern blocks with the irregular central and western shapes, or label a selected regional sequence. Designers can add callouts, but should avoid covering the small boundaries around Denver and Broomfield.
The published preview is a raster image rather than a set of individually selectable vector polygons. It can be placed in common document and graphics applications, but enlarging it far beyond its native dimensions may soften thin lines. Keep an untouched master copy and edit a duplicate so the original boundary reference remains available.
Built for Classroom and Presentation Use
A simple three-step lesson can use all versions without changing the geographic base. Begin with the color Colorado Map to introduce the statewide pattern, move to the outline for a labeling or coloring task, and finish with the black-and-white map for review. This sequence helps learners separate recognition, recall, and checking rather than treating all three images as interchangeable decoration.
For presentations, the color edition reads best at a glance, while the monochrome version fits reports that will be printed or photocopied. The outline is most useful when a speaker adds a limited number of highlights. A crowded overlay defeats the purpose of the clean base, so prioritize the counties directly relevant to the topic and explain the remainder in supporting text.
None of the images includes county seats or major cities. Denver appears as a county label, not as a general city marker, and Colorado Springs is not plotted even though El Paso County is named. When a project concerns cities, routes, terrain, parks, or watersheds, pair this county reference with a source designed for that subject instead of inferring missing features.
Reading Colorado’s Regional County Pattern
The Colorado Map reveals three broad visual patterns without needing terrain shading. Many eastern counties form large rectangles; western counties are generally larger and more irregular; and the center contains a dense mixture of shapes. These are observations about the drawn boundaries only, not evidence of population size, economic activity, or landscape type.
County area can also be misleading when viewers equate visual size with importance or population. A large polygon does not necessarily represent more residents, and a tiny Denver-area county may carry considerable civic significance. When presenting demographic or economic information, add a dated source and legend so the administrative base does not appear to communicate values it was never designed to show.
FAQ
Does the Colorado Map show all 64 counties?
Yes. The labeled color and black-and-white versions name all 64 counties, while the outline retains the same boundary arrangement without names. Small central counties are visible, but users should inspect that cluster carefully when labeling the blank version.
Can I use the maps for route or terrain planning?
No. Roads, rivers, elevation, mountain ranges, distances, and scale information are not included. Use a current transportation or topographic source for navigation and physical-geography tasks.
Can I print the Colorado map in A3 size?
Yes. The files were prepared for high-resolution A3 printing and remain readable when enlarged.
Does the Colorado map include county boundaries?
Yes. The color and black-and-white versions include county boundaries.
Is the outline version editable?
Yes. The blank outline version is designed for editing, annotations, and infographic projects.
Which Colorado map version is best for presentations?
The color county map is generally the best option for presentation slides and visual explanations.
Can the Colorado map be used in classrooms?
Yes. The collection was designed for classroom reference, worksheets, geography projects, and educational presentations.
Map File Information
The archive groups the three county-map image versions shown on this page.
- Included Versions: Labeled color, labeled black-and-white, and blank outline
- File Type: Image files
- Intended Use: County reference, printing, lessons, annotation, and presentation layouts
Related Maps
Additional Resources
- Colorado Local Government — Find official state links for counties, municipalities, and other local-government resources.
Green Map creates custom-edited map images using open geographic data sources such as geoBoundaries, Natural Earth, OpenStreetMap, and government open data.
These maps are edited visual materials, not raw data files, and are provided for education, documents, presentations, and graphic reference.