Download a Howard County Texas Map set for a closer look at Big Spring, the county road network, named creeks and lakes, and the large change in elevation across this part of West Texas. Big Spring is the clearest reference point on the maps, with Interstate 20 crossing the county from west to east and U.S. 87 providing a strong north-south route. Coahoma lies to the east along the I-20 corridor, while Forsan is south of Big Spring. The downloadable ZIP on this page contains high-resolution A3 JPG versions of the county, city-connections, terrain-and-water, and elevation maps.
The four maps are most useful when they are read together rather than treated as interchangeable pictures. The general county map establishes roads, places, county limits, and the broader drainage network. The city map simplifies the settlement pattern around Big Spring. The water map labels creeks, reservoirs, and lakes that are difficult to distinguish on the general map, while the elevation map shows an actual mapped range of about 662 to 865 meters, with a mean near 769 meters. Those differences explain why some parts of the county look open and gently rolling while others are cut by narrow valleys and branching streams.
Table of Contents
Big Spring as the main reference point
On the county map, Big Spring sits a little south of the county’s center and is surrounded by the densest cluster of mapped roads and developed land. That makes it a practical place to orient yourself before following smaller features. Sand Springs and Coahoma extend eastward along the I-20 side of the county, and Forsan appears to the south. The distribution is not a ring of equally sized communities around the county. Instead, one dominant city anchors the network, and the smaller communities help define the main directions of travel away from it.
| Main reference city | Big Spring |
| Mapped communities | Coahoma, Forsan, Sand Springs |
| Major roads shown | Interstate 20, U.S. 87, TX 350, TX 176 |
| Named water features | Morgan Creek, Wildhorse Creek, Beals Creek, Moss Creek, Elbow Creek, North Concho River |
| Mapped elevation range | about 662–865 m, mean about 769 m |
I-20, U.S. 87, and the settlement pattern
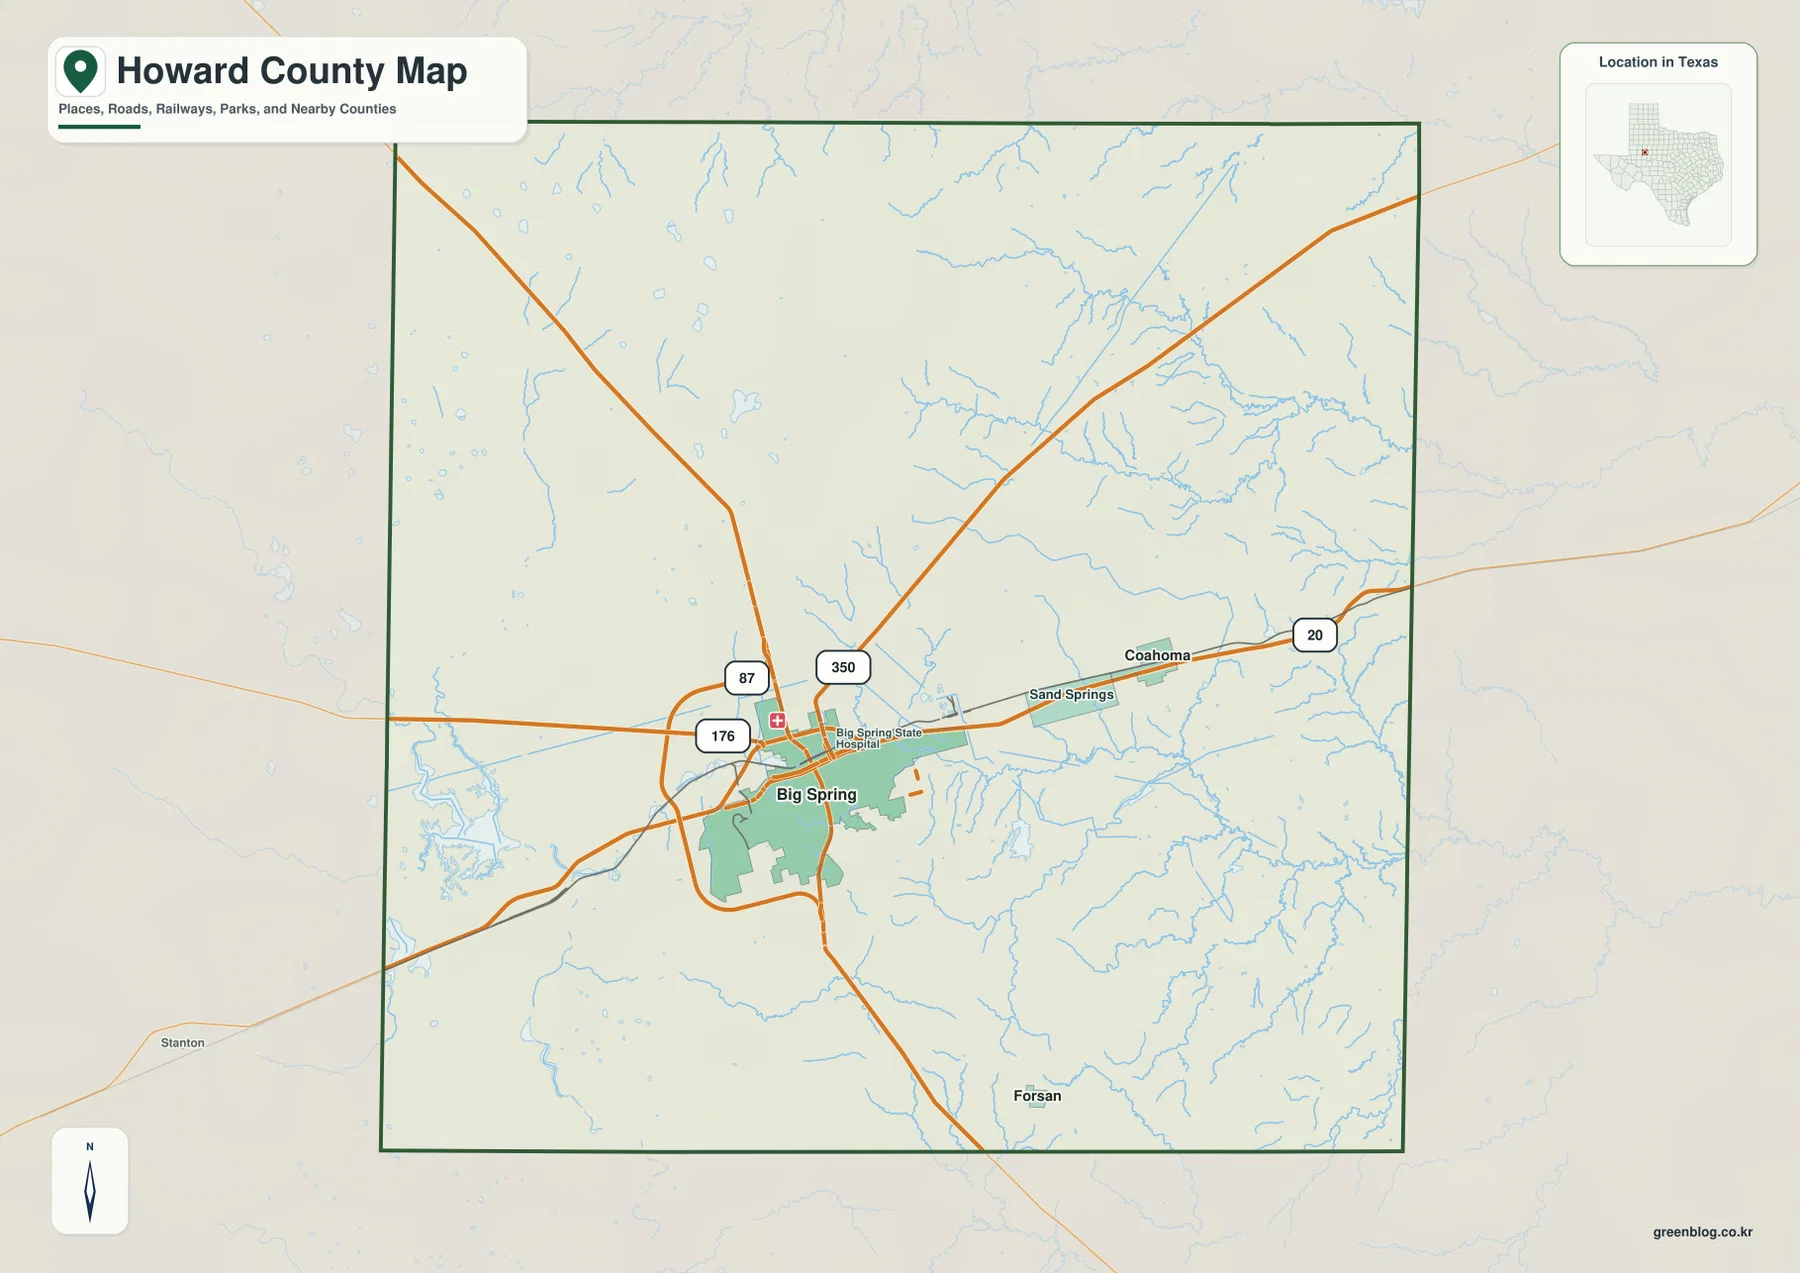
Interstate 20 is the most obvious east-west line on the general map. It approaches Big Spring from the west, passes through the urban area, and continues through Sand Springs toward Coahoma. U.S. 87 crosses the Big Spring area on a north-south line, giving the city a second major direction of access. TX 350 and TX 176 add other connections around the city, so the road pattern is more than a simple crossroads. The concentration of routes near Big Spring helps explain why the city appears so prominent even before any population figures are considered.
The city-connections map makes the relationship among the main communities easier to compare. Big Spring is the hub. Coahoma is shown about 11 miles away to the east, and Forsan about 11 miles to the south. Those similar distances lead in different directions and connect with different parts of the road network. Coahoma is closely tied to the I-20 corridor, while the route toward Forsan leaves the denser east-west highway pattern and heads into the southern part of the county. Sand Springs, visible on the general map between Big Spring and Coahoma, adds another point along the eastern corridor.
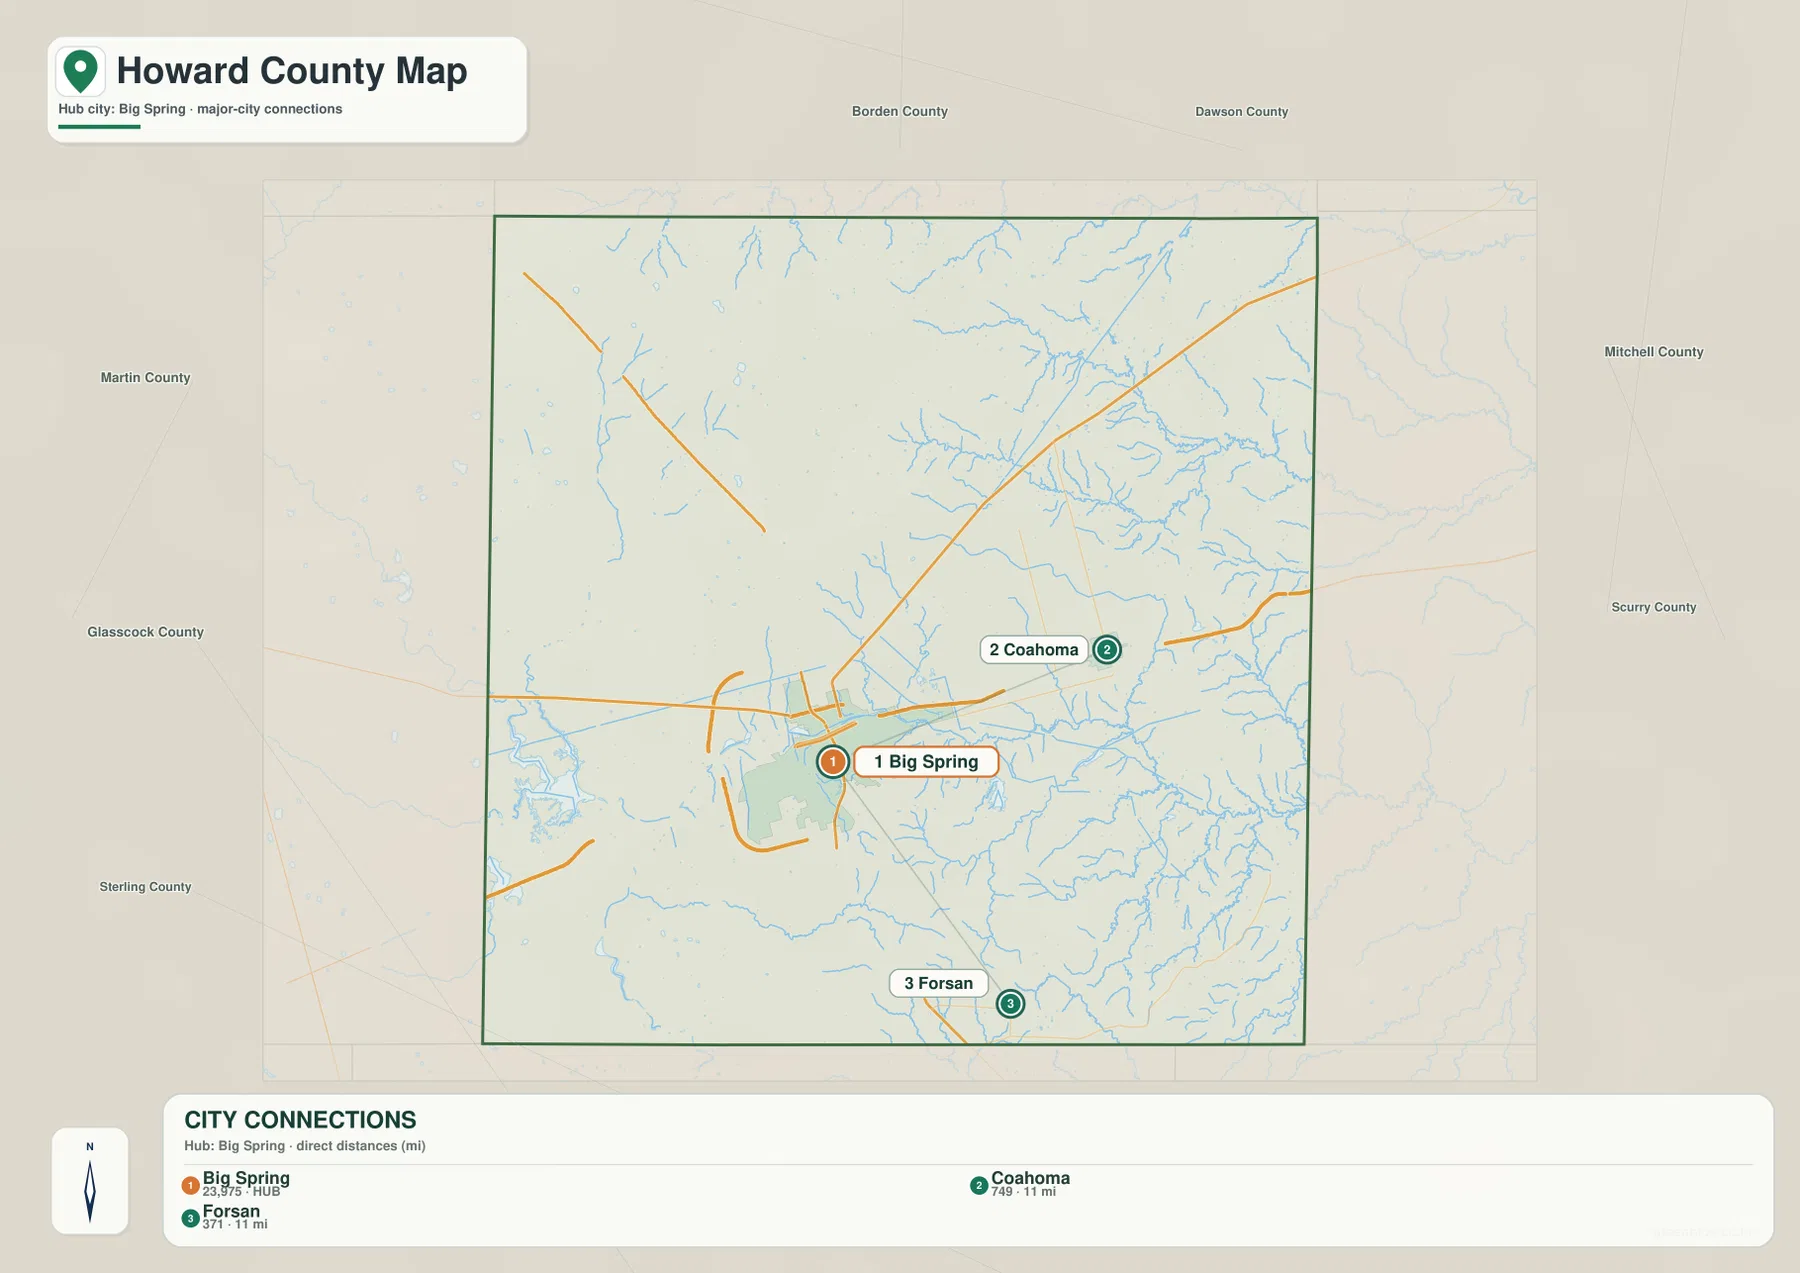
The same map labels the counties surrounding Howard County: Borden and Dawson to the north, Mitchell and Scurry to the east, Sterling and Glasscock toward the southwest, and Martin to the west. These labels are useful because the important highways do not stop at the county line. I-20 is regional by nature, and U.S. 87 also continues beyond Howard County. For route planning or regional research, the county boundary tells you where the jurisdiction changes, while the road lines show how Big Spring remains connected to places outside that boundary.
A denser network of creeks in the east and south
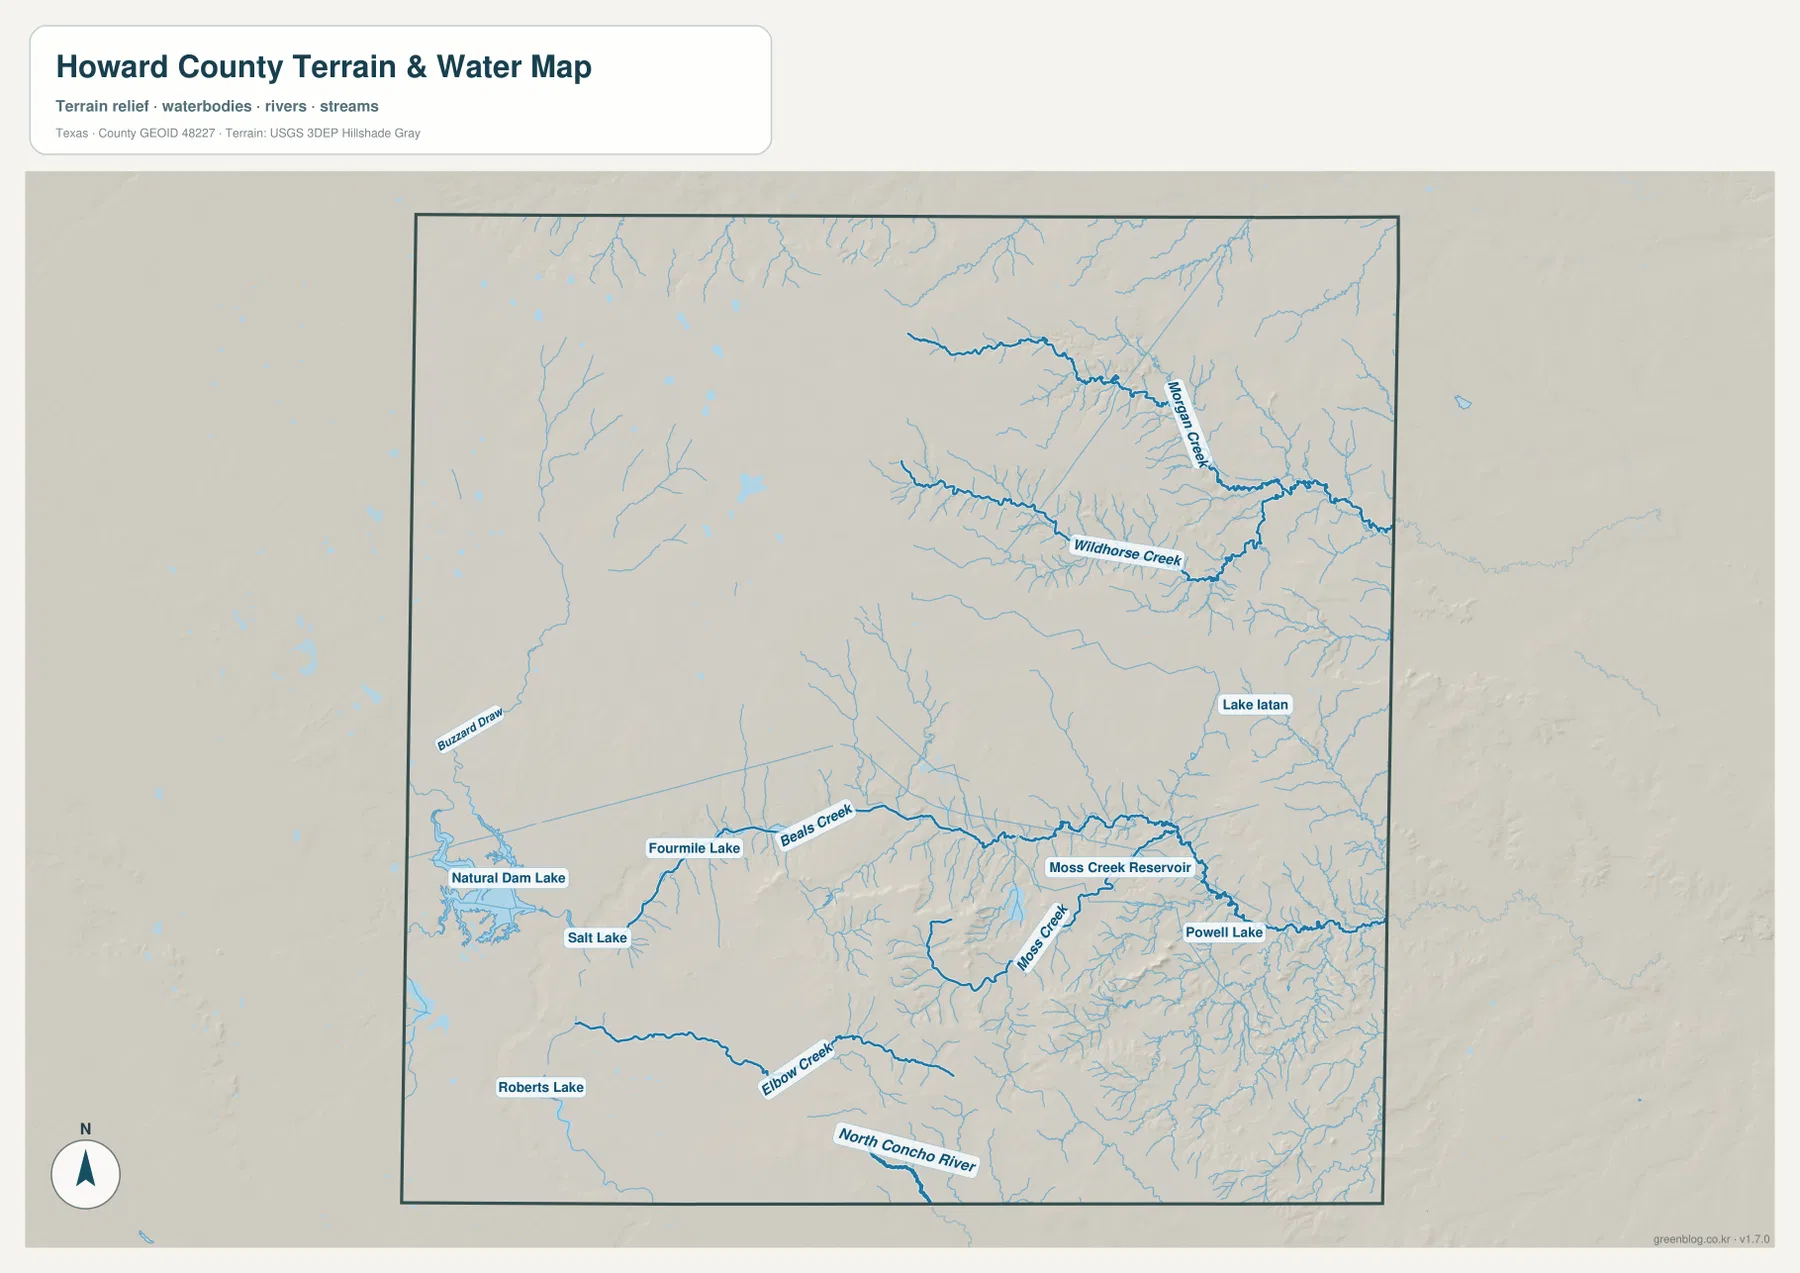
The water map changes the visual emphasis of the county. In the eastern half, thin tributaries branch repeatedly into larger named creeks. Morgan Creek is prominent in the northeast, with a long channel and many side branches. Wildhorse Creek lies farther south and also develops a branching network before reaching the eastern side of the map. Near the center and south, Beals Creek and Moss Creek collect water from several smaller channels. Elbow Creek is visible farther southwest, and the North Concho River is labeled near the southern edge.
Several lakes and reservoirs provide additional landmarks. Natural Dam Lake, Salt Lake, and Fourmile Lake are grouped in the western part of the county. Roberts Lake appears farther south-west. Moss Creek Reservoir sits in the south-central drainage system, while Powell Lake is farther east and Lake Iatan is north-east of the reservoir area. These features are useful for identifying a specific part of the county because they are not distributed evenly. A person looking for water features near the eastern stream valleys will use a different section of the map from someone locating the cluster of western lakes.
The general county map already shows many blue drainage lines, but it does not give the same level of naming. That is why the water map is the better choice when a project depends on a creek, reservoir, or lake rather than on a highway. It also helps prevent a common mistake: assuming that a large number of blue lines means one major river dominates the county. Howard County’s supplied map instead shows several separate creek systems and small water bodies spread across different parts of the landscape.
From higher northwestern ground to lower northeastern valleys
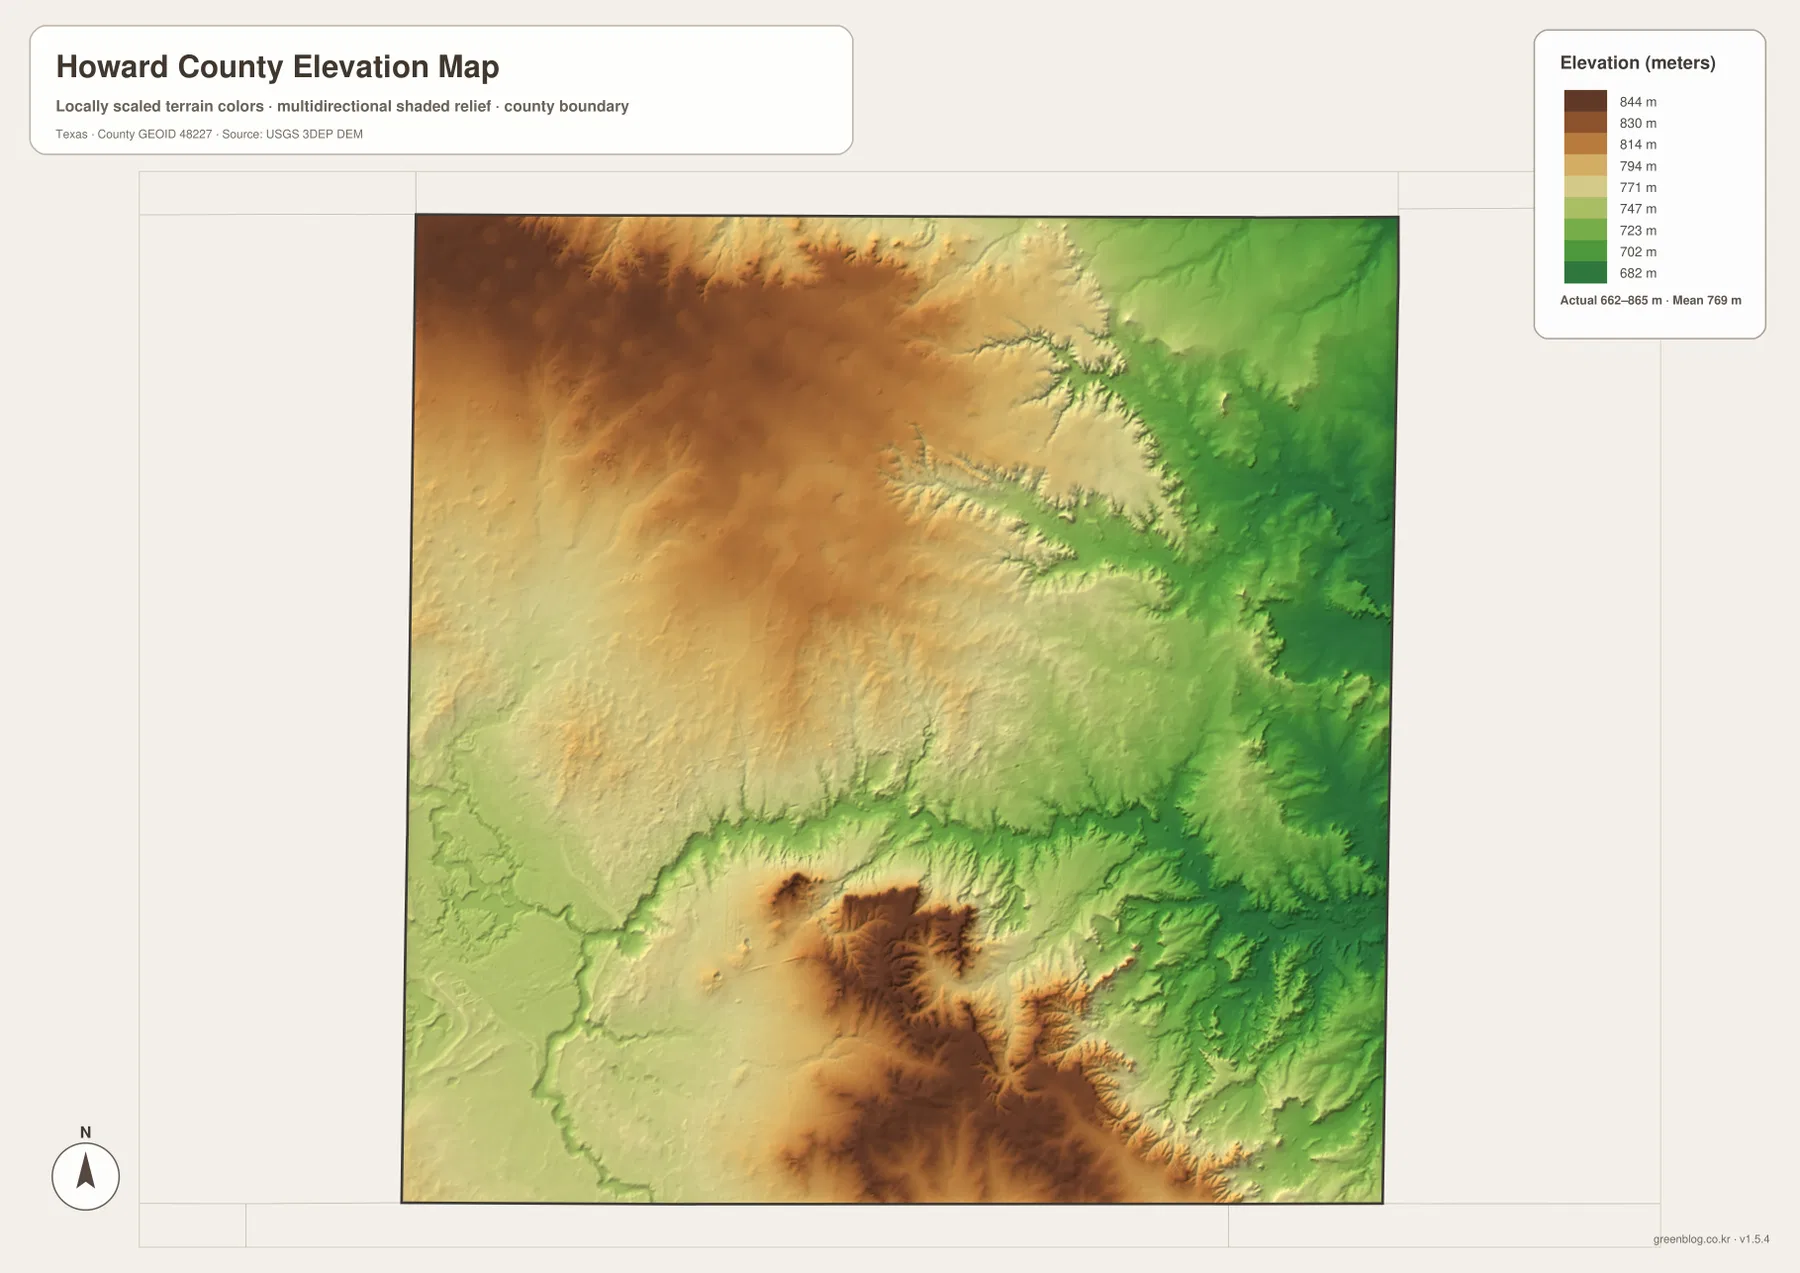
The elevation map gives Howard County much more relief than a simple road map suggests. Its legend reports an actual range from about 662 to 865 meters, a difference of more than 200 meters. Brown and orange tones mark higher terrain across much of the northwest. Green tones become dominant in the northeast, where lower ground and incised valleys are more evident. The southern part of the county rises again in several rugged areas, including pronounced high ground in the south-central and southeastern sections.
The shaded relief makes narrow valleys visible even where the color change is gradual. In the east, the land is cut by a complicated set of channels that matches the denser drainage pattern on the water map. The relationship is especially clear around the northeastern and southeastern stream networks: creeks occupy lower lines between higher ridges and uplands. The west has fewer densely branching channels on the supplied water map and looks broader and more open on the elevation surface, although local depressions and rises are still present.
This comparison is useful because elevation should not be reduced to a single county-wide average. The mean of about 769 meters describes the middle of the range, but it does not show the contrast between the high northwest, the low northeast, and the higher southern terrain. For a classroom exercise, local history project, or landscape description, those internal differences are more informative than one number. For engineering, flood risk, or site-specific slope decisions, however, the map should be treated as a regional reference rather than a substitute for detailed survey data.
Choosing the right Howard County map for the task
Use the general county map when the question combines several kinds of information at once. It is the clearest starting point for locating Big Spring, following I-20 and U.S. 87, finding Coahoma or Forsan, and keeping the county boundary in view. The city-connections version is better when the focus is the relationship among the main communities. It removes some of the visual detail and makes Big Spring’s role as the hub much easier to explain.
Choose the terrain-and-water map when a named creek, lake, reservoir, or drainage area matters. Morgan Creek, Wildhorse Creek, Moss Creek Reservoir, and the western lake cluster can be found directly by name. Choose the elevation map when the main question is why one part of the county appears higher, lower, or more deeply cut by valleys. The northwestern high ground, northeastern low ground, and rugged southern terrain are immediately visible there even though road and town labels are not the main focus.
For printed reports and presentations, using two complementary maps is often clearer than forcing every detail onto one page. A transportation discussion can pair the county map with the city map, while a physical-geography section can pair the water map with the elevation map. In a teaching setting, placing Big Spring in the same approximate position on all four maps and then comparing roads, towns, drainage, and height provides a straightforward way to show how different map layers describe the same county without turning the exercise into a technical GIS lesson.
Reading Howard County in its surrounding regional context
Howard County’s shape is easy to recognize on the city map, but the surrounding county labels make the location more useful. Borden and Dawson Counties sit to the north, Mitchell and Scurry are on the eastern side, Sterling and Glasscock lie to the southwest, and Martin is west of Howard County. When a route leaves Big Spring, these neighboring names provide a more concrete sense of direction than a generic reference to east or west.
That regional context also matters for natural features. Drainage lines and elevation patterns do not stop at the political boundary. The lower valleys visible in the northeast continue toward the county edge, and the higher terrain in the west and south belongs to a broader landscape that extends beyond Howard County. The county maps are therefore useful for organizing information by jurisdiction, but a geographic interpretation should still recognize the continuity of roads, streams, and terrain across the boundary.
Frequently Asked Questions
Where is Big Spring on the Howard County map?
Big Spring is slightly south of the county’s center, around the junction of the major I-20 and U.S. 87 routes shown on the map. Coahoma is east of Big Spring, while Forsan is south, so Big Spring works well as the first reference point for locating the rest of the county.
Which named creeks stand out on the water map?
Morgan Creek and Wildhorse Creek are prominent in the northeastern and eastern part of the map. Beals Creek and Moss Creek are important farther south, and Elbow Creek is labeled in the southwest. The map also names several lakes and reservoirs, including Moss Creek Reservoir, Lake Iatan, Powell Lake, and Fourmile Lake.
How much elevation change does the supplied map show?
The elevation map reports an actual range of about 662 to 865 meters and a mean near 769 meters. Higher ground is especially visible in the northwest and parts of the south, while the northeast is generally lower and more deeply cut by stream valleys.
Sources and Reference Data
For additional official geographic data, see the U.S. Census Bureau TIGER/Line Shapefiles for boundaries and transportation layers, USGS National Hydrography for water features, and the USGS 3D Elevation Program for elevation data. The USGS The National Map Viewer provides a convenient way to compare several official map layers in one interface.
Map File Information
The download contains high-resolution A3 JPG versions of the Howard County general map, city map, terrain-and-water map, and elevation map. Use the ZIP when you need larger files than the WebP previews shown in the article.
- Included Files: Use only the versions confirmed in the article and supplied images
- File Type: Use the confirmed download contents
- Intended Use: Printing, education, presentations, and map-based projects
Related Maps
- Sterling County Texas map
- Scurry County Texas map
- Terry County Texas map
- Reagan County Texas map
- Andrews County Texas map
Green Map creates custom-edited map images using open geographic data sources such as geoBoundaries, Natural Earth, OpenStreetMap, and government open data.
These maps are edited visual materials, not raw data files, and are provided for education, documents, presentations, and graphic reference.