The Tehama County California Land Cover Map shows a county where open natural cover occupies far more area than farms or built surfaces. In the 2025 summary, grassland accounts for 52.80%, followed by shrubland at 24.53% and forest at 10.99%. Agriculture and developed land are much smaller countywide classes, yet both are visually concentrated through the central valley floor. This page compares the general land-cover map, the forest-and-farmland view, the impervious/developed-land map, and the 1985–2025 class-difference map.
The WebP images below are intended for on-page viewing. A single download farther down the page contains the four original JPG maps, each at 2480 × 1754 pixels. They can be used to compare the central agricultural corridor with the broad grassland and shrubland interior, show where hard surfaces cluster around Red Bluff, or provide county-scale reference graphics for environmental lessons, reports, and presentations.
Table of Contents
Grassland Covers More Than Half of the County
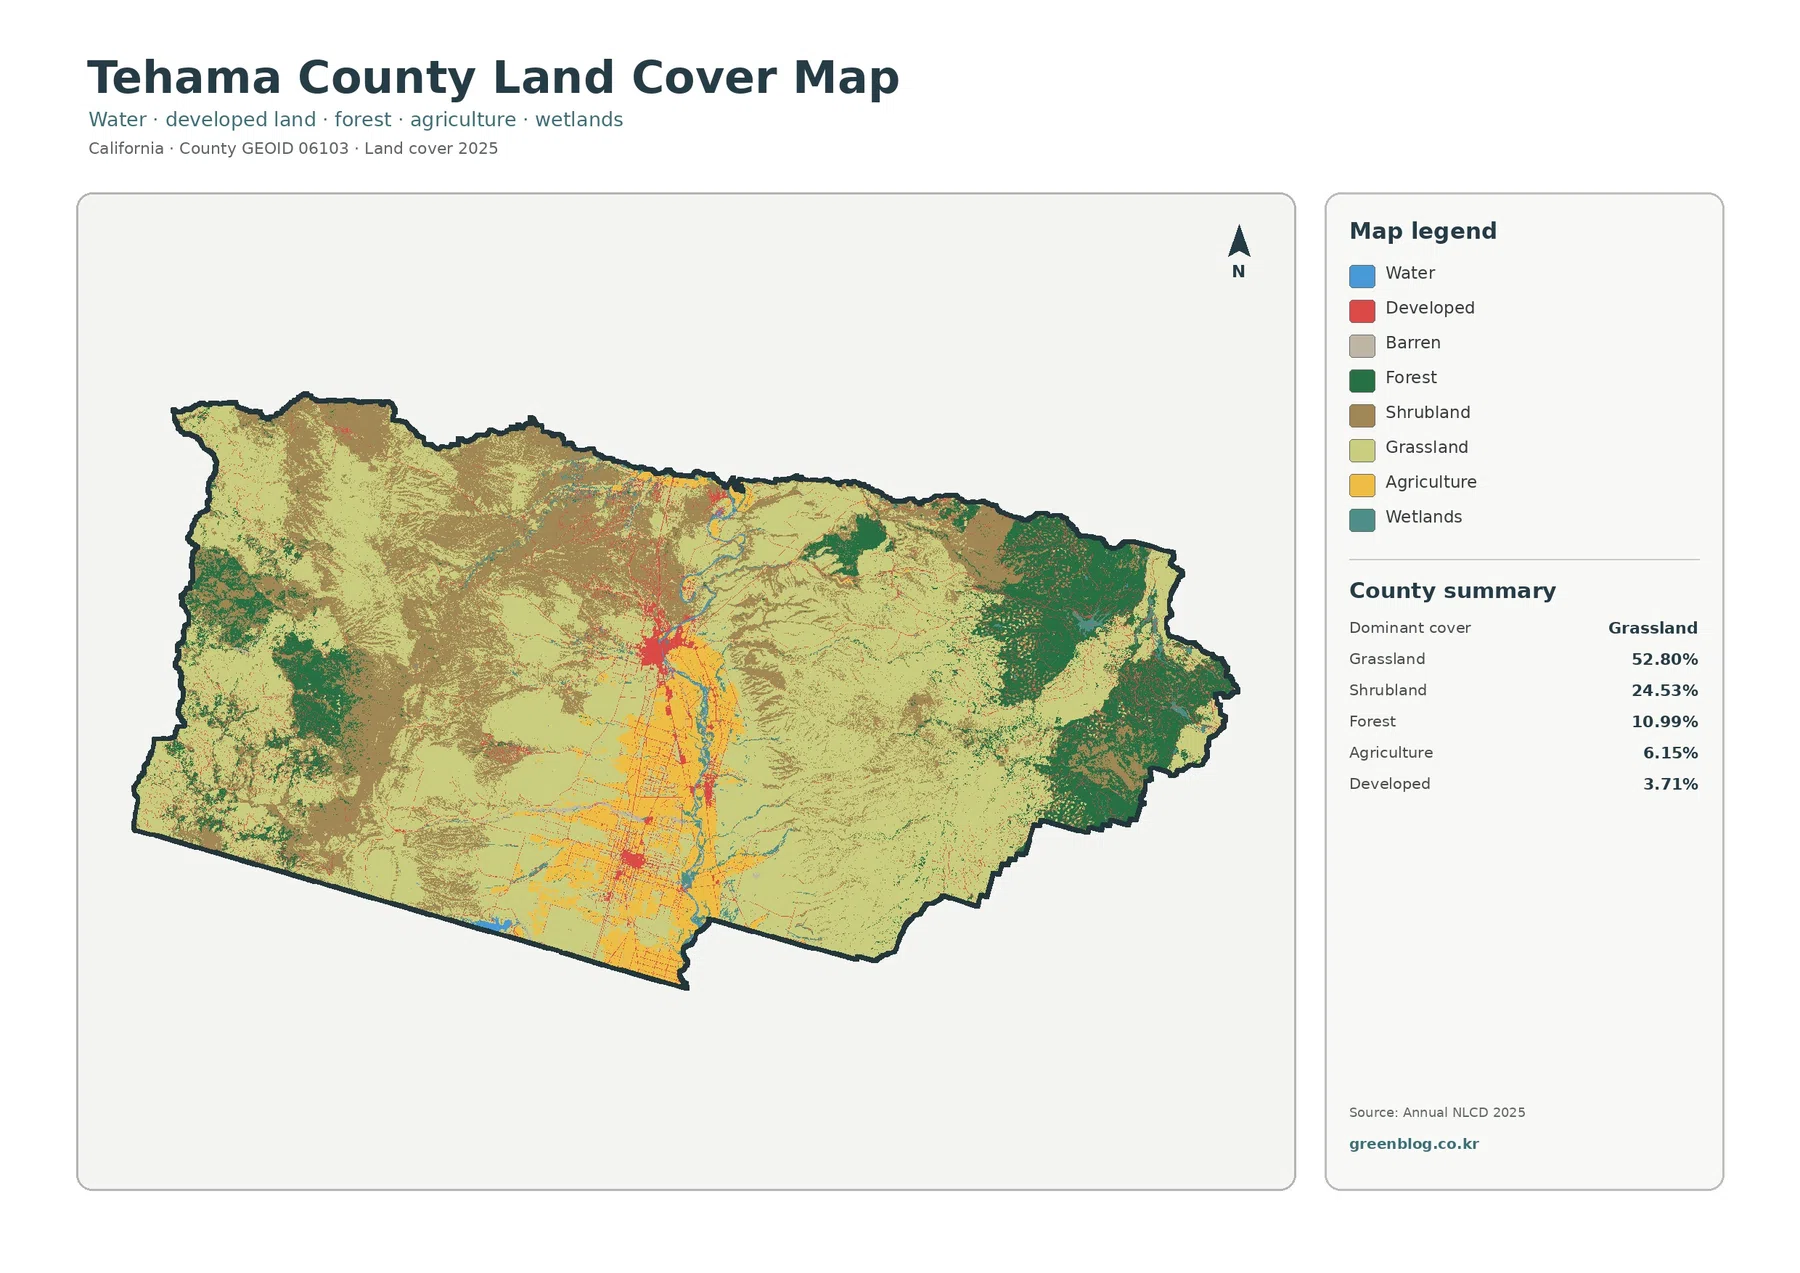
Tehama County’s 2025 land-cover summary is led by grassland at 52.80%. Shrubland adds another 24.53%, so those two relatively open vegetation classes together occupy most of the mapped county. Forest represents 10.99%, agriculture 6.15%, developed land 3.71%, wetlands 1.33%, and water 0.27%. The important point is not only which categories are largest, but also how differently they are arranged. Grassland and shrubland spread widely, while agriculture and development form a much narrower band in the middle of the county.
Tehama County’s official overview describes the area as overwhelmingly open space, with significant development limited mainly to the central valley floor. That broad description is visible in the map. Red and yellow developed or agricultural cells are concentrated near the center, while the county’s western and eastern expanses are dominated by grass, shrub, and forest classes. A small countywide percentage can therefore still be very important locally when it is packed into one part of the landscape.
A Different Land-Cover Mix Along the Sacramento River Valley
The county’s official website notes that the Sacramento River cuts through the central portion of Tehama County. In the general map, water and wetland colors follow parts of that central corridor, with agricultural cover occupying many adjacent areas. The valley floor therefore contains a more varied mix of farm fields, water-related cover, and developed land than the broad open country to the east and west. This contrast is more informative than treating the county as a single grassland-dominated block.
Red Bluff forms the most obvious developed cluster in the center of the map. Smaller developed areas continue southward through the valley, surrounded by agricultural and open cover. The land-cover map is not a municipal-boundary or street map, however, so the red cells should not be read as legal city limits. They represent surfaces classified as developed by the 2025 land-cover dataset. Zoning, parcel ownership, permitted uses, and city or county jurisdiction require separate planning records.
The Farm-and-Forest View Separates the Valley from the Mountain Edges
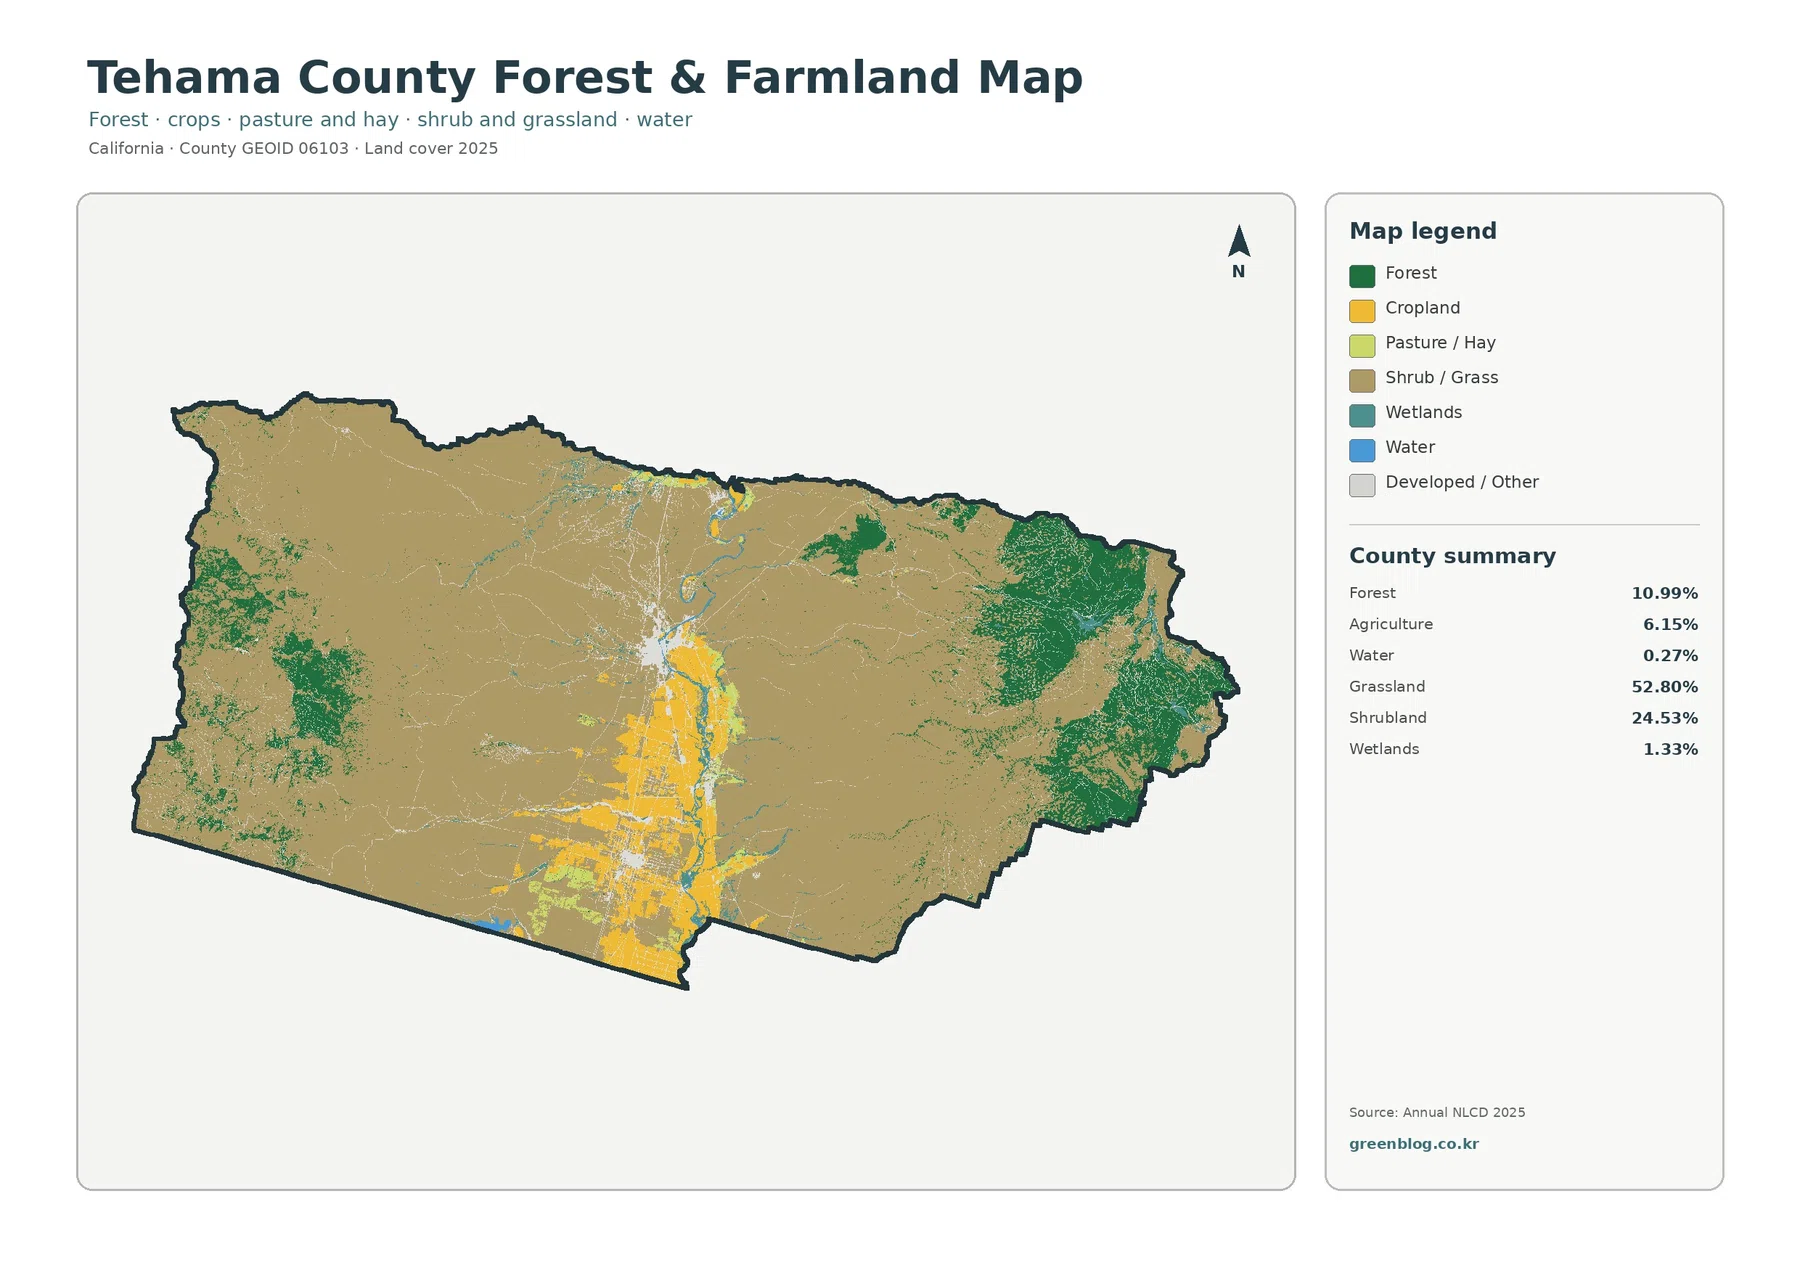
The forest-and-farmland map groups the landscape into categories that are easier to compare when the question is about agriculture and vegetation. Agriculture remains 6.15%, forest 10.99%, water 0.27%, wetlands 1.33%, grassland 52.80%, and shrubland 24.53%. The agricultural share is modest at the county scale, but yellow cropland and pasture-related areas form a conspicuous north-south concentration through the central valley. That concentration explains why agriculture is locally important even though grassland is the much larger class overall.
Forest is not spread evenly either. Larger green patches appear along the eastern edge and in portions of the west and southwest, separated from much of the central agricultural strip. The pattern helps distinguish the valley floor from the more wooded margins without requiring a detailed terrain map. Tehama County planning documents also discuss agriculture, timber, grazing, habitat, watershed resources, and open space together, which fits the map’s picture of a county with several very different surface-cover settings.
Grassland, Shrubland, and Forest Are Not Interchangeable
Because grassland and shrubland together cover such a large share of Tehama County, it is tempting to describe all of the non-farm, non-urban interior as the same kind of open land. The map shows more variation than that. Grassland forms very broad areas through the center and south, while shrubland becomes more prominent in portions of the west, northwest, and east. Forest appears as darker, more concentrated patches within and beside those open-cover areas.
These are land-cover classes, not legal land-use categories. Land cover describes what the ground surface is classified as being covered by: trees, shrubs, grass, crops, water, wetlands, or developed material. It does not tell a reader whether a parcel is privately owned, zoned for agriculture, managed for timber, permitted for grazing, protected as habitat, or available for development. Those questions belong to county planning, property, and resource-management records.
Hard Surfaces Are Highly Concentrated Rather Than Widespread
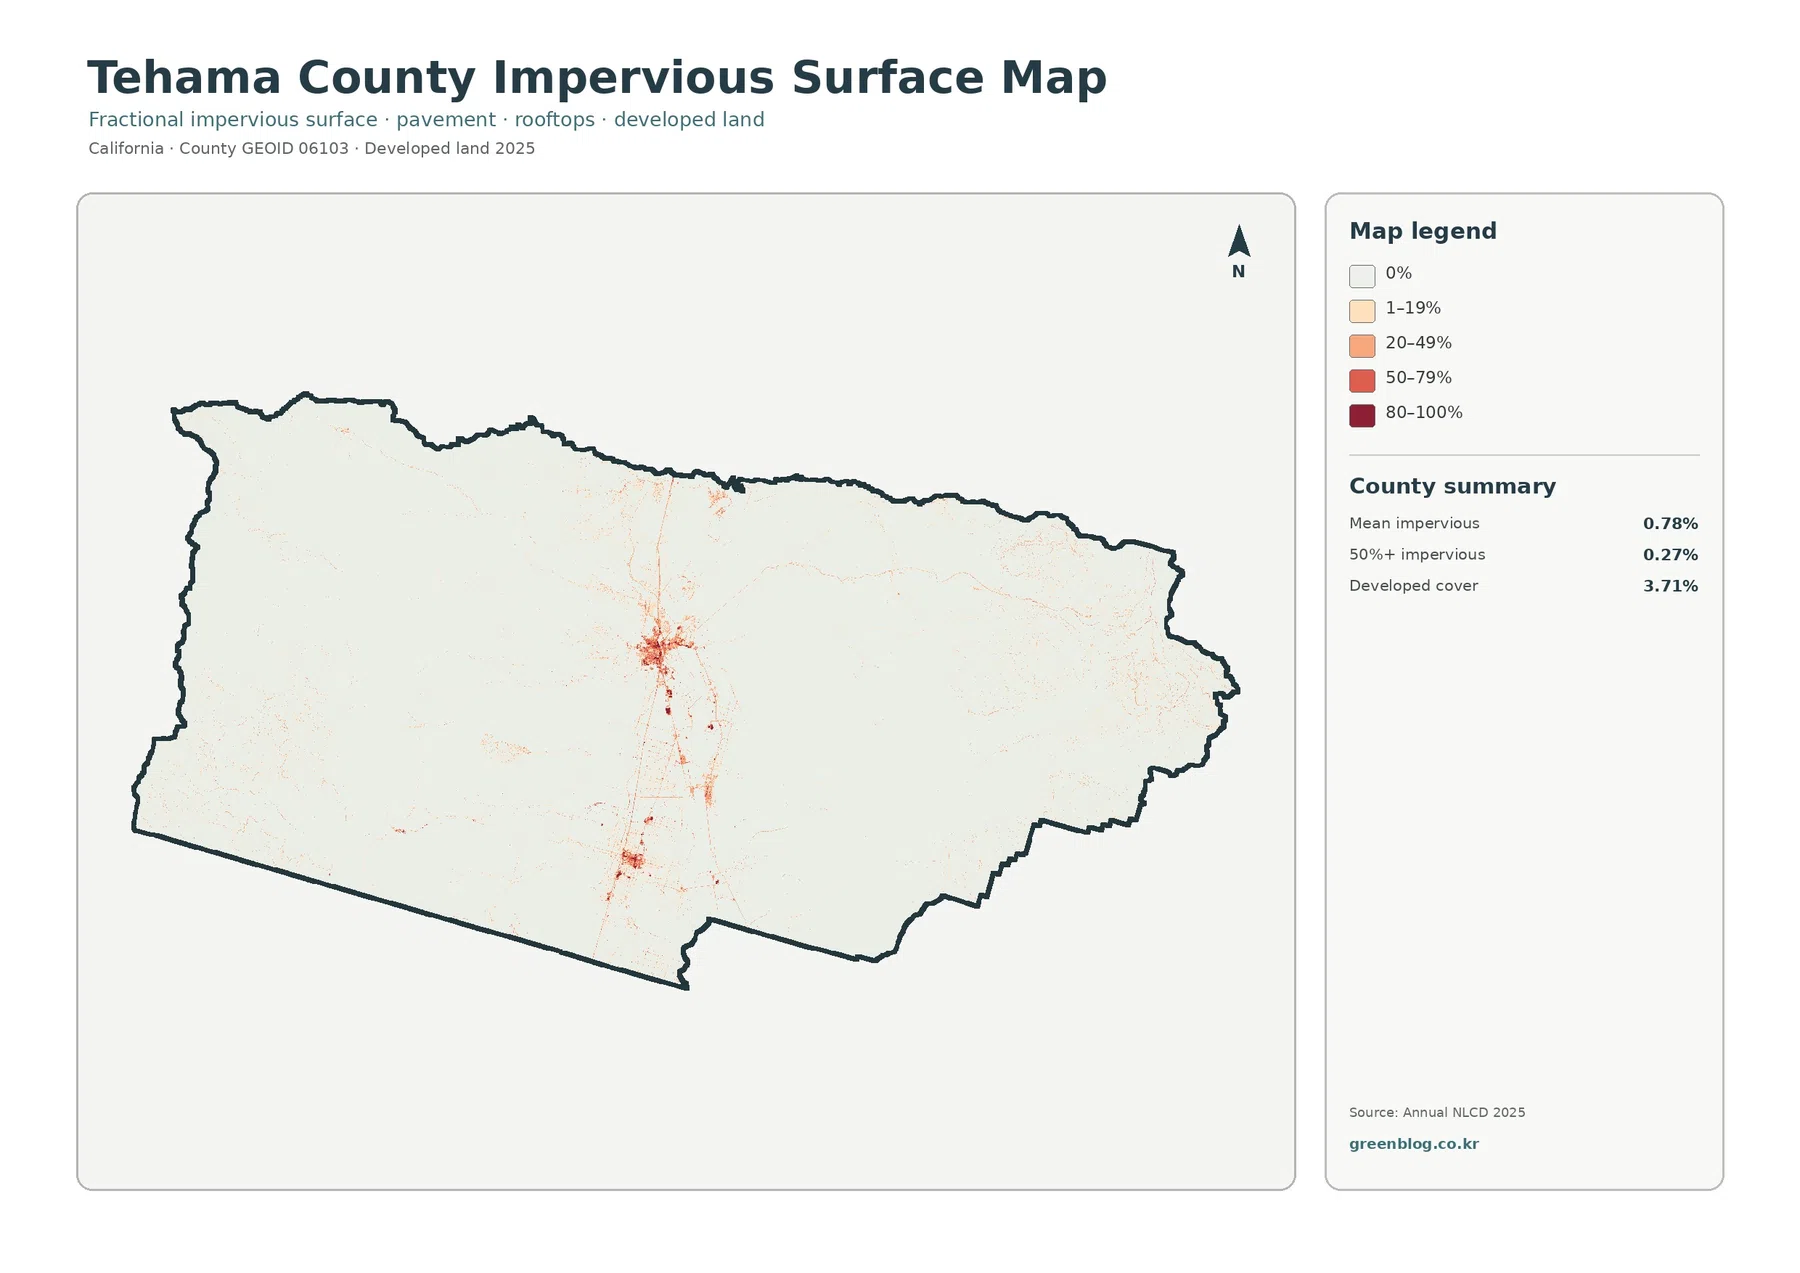
Impervious surface measures the fraction of the ground covered by materials such as pavement and rooftops that do not readily absorb water. Tehama County’s mean impervious value is only 0.78%, and areas with at least 50% impervious cover account for 0.27% of the county. Developed cover is higher at 3.71% because a developed class can include both hard surfaces and permeable elements such as yards, trees, bare soil, and low-density open space.
The map makes the concentration especially clear. The strongest impervious values form a compact cluster around Red Bluff, with smaller concentrations continuing south through the central valley. Most of the county remains very pale, indicating little high-density hard surface. Thin linear traces are also visible through parts of the valley, but the map does not label roads, so those lines should not be assigned to a specific route without another reference map. For a simple urban-versus-rural comparison, this is the clearest of the four images.
The 1985–2025 Map Shows Class Differences, Not a Single Story of Change
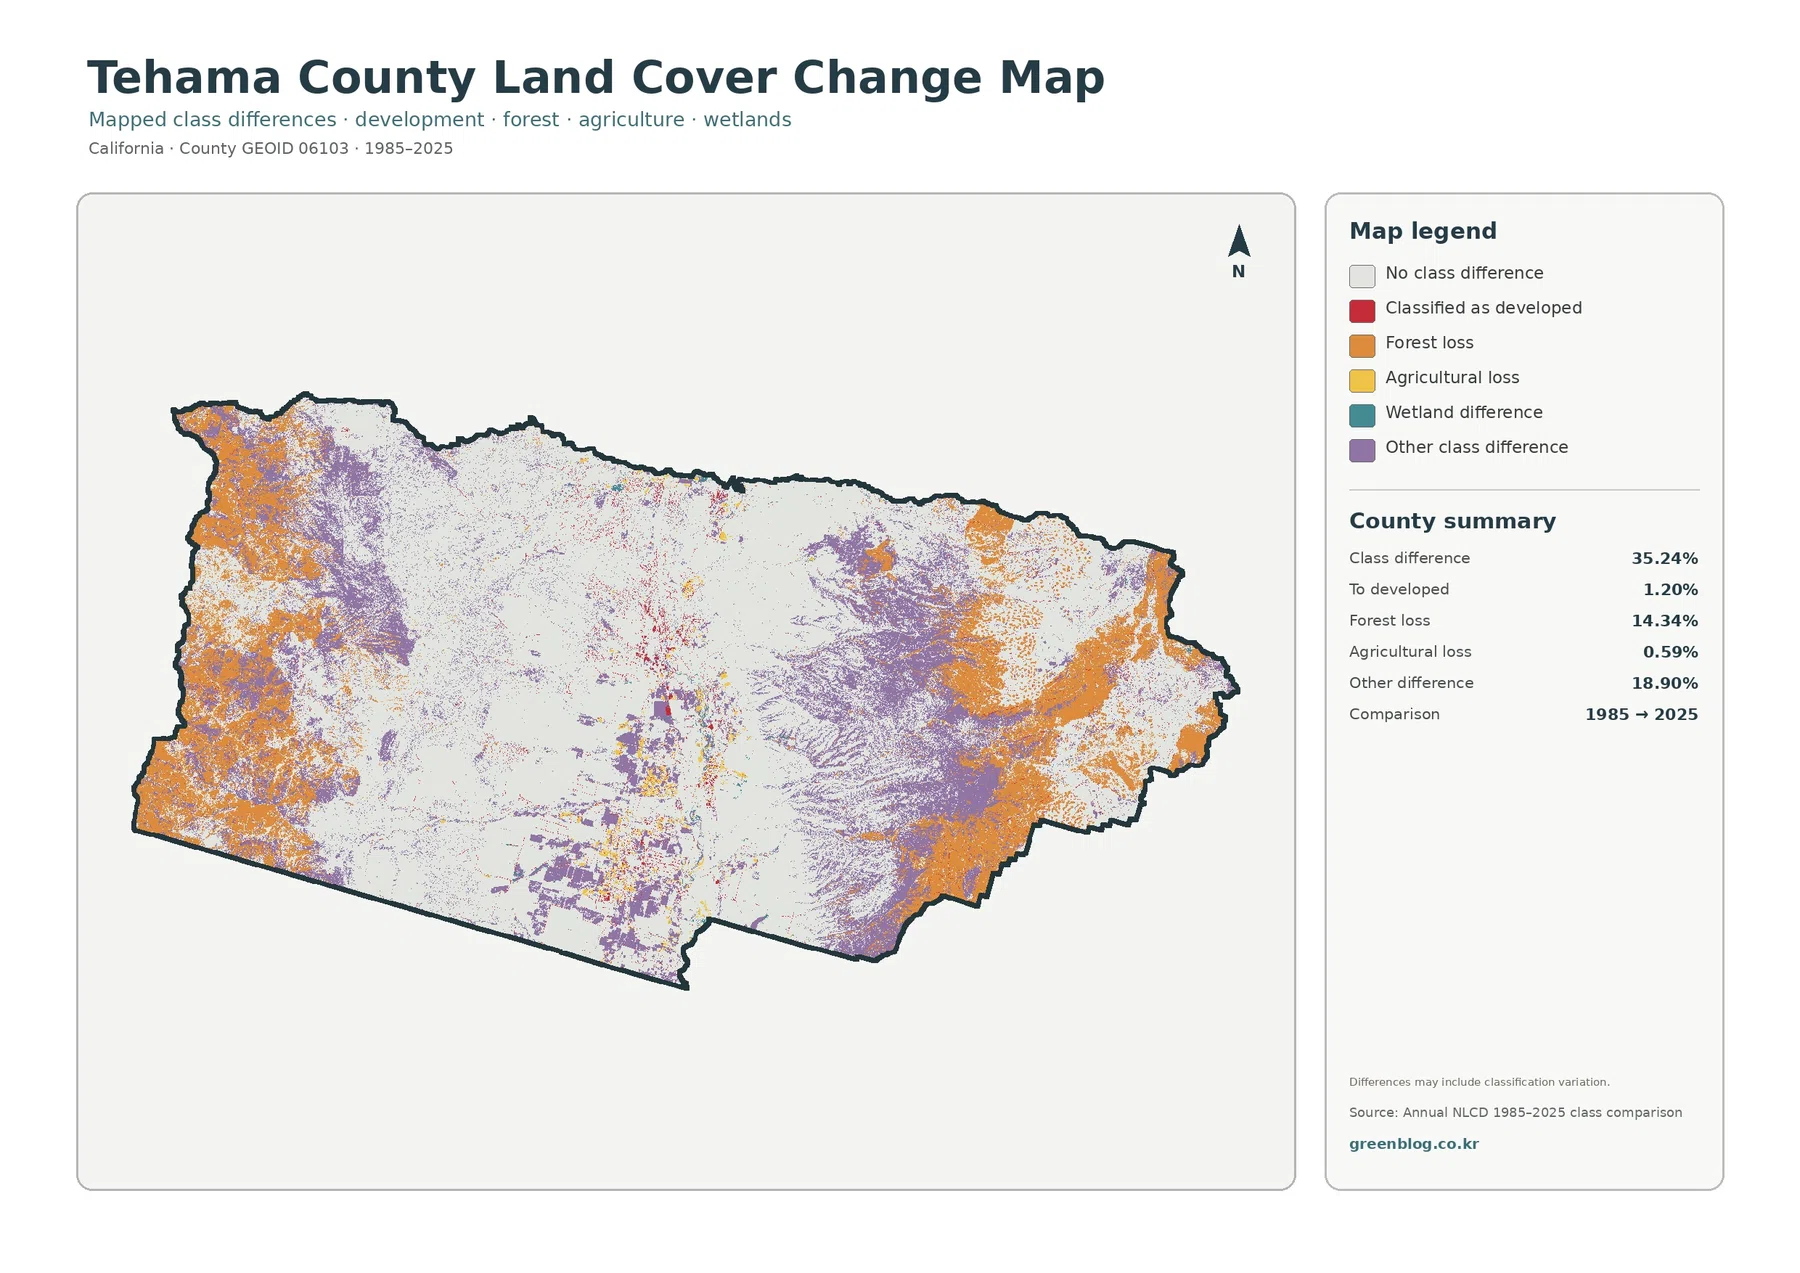
The comparison map reports that 35.24% of the county has a different mapped class in 2025 than in 1985. The summary separates 1.20% as change to developed, 14.34% as forest loss, 0.59% as agricultural loss, and 18.90% as other class differences. Large orange and purple areas appear across parts of the eastern and western uplands, while red developed-change cells are much more limited and concentrated through the central corridor.
The 14.34% forest-loss category requires careful wording. It means cells classified as forest in 1985 were classified differently in 2025. It does not identify a cause. A changed forest cell could be associated with many real-world processes, but this map alone does not establish whether the cause was fire, logging, drought, vegetation succession, agriculture, or development. Answering that question would require additional evidence such as historical imagery, fire records, timber records, permits, or field information.
The map itself warns that differences may include classification variation. Annual NLCD is a generalized raster product, commonly represented in 30-meter cells, so a single cell can contain more than one surface type. Changes in imagery, mixed pixels, classification methods, or the exact placement of a boundary can produce a different class even when the ground did not undergo a simple one-step conversion. For that reason, the 35.24% figure should not be described as proof that exactly that share of Tehama County changed legal land use.
A Practical Sequence for Reading the Four Maps
For a general county introduction, begin with the full land-cover map. It quickly establishes the broad grassland and shrubland background, the forested margins, and the concentration of agriculture and development in the middle. For an agriculture or habitat discussion, the forest-and-farmland version is a better second step because it simplifies some of the smaller classes and makes the valley’s farm concentration easier to compare with forest and open vegetation.
If the topic is development, the impervious map should follow. It demonstrates that hard surfaces are much more concentrated than the 3.71% developed-land figure might suggest by itself. The change map is best used after the current landscape is understood, because it asks a different question: where did the mapped class differ between 1985 and 2025? It is useful for locating areas that deserve closer study, but it should not be used to assign a cause without other records.
Because all four images use the same county boundary, they can be placed in sequence in a report or presentation without changing the geographic frame. They are useful for county-scale comparison, environmental education, and visual reference. They are not parcel surveys, zoning maps, flood-hazard maps, ownership records, or engineering drawings. Small features and class boundaries are generalized, and land cover may also have changed after the 2025 observation period.
Download the Four Tehama County JPG Maps
The download archive contains the original JPG versions of the four maps shown on this page: 2025 land cover, forest and farmland, impervious/developed land, and the 1985–2025 class-difference map. Each image is 2480 × 1754 pixels. The source package identifies them as original-resolution files and does not mark them as meeting an A3 high-resolution reference standard, so check the legend and small map details at the intended print size before producing a large print.
Frequently Asked Questions
Does 52.80% grassland mean that more than half of Tehama County has the same land use?
No. The figure is a 2025 land-cover classification describing surface cover. It does not define ownership, zoning, grazing status, conservation status, or permitted land use. Those questions require separate county or property records.
Why is developed cover 3.71% when mean impervious surface is only 0.78%?
Developed land can include a mixture of pavement, roofs, lawns, trees, soil, and other permeable areas. Impervious surface measures the hard fraction more directly, so it can be much lower than the total developed-land class.
Can the 14.34% forest-loss class be treated as a wildfire or logging total?
No. It indicates cells mapped as forest in 1985 and as another class in 2025. The map does not identify the cause, and classification variation can contribute to the difference. Fire, logging, development, or other explanations require independent evidence.
Map File Information
The ZIP contains four original JPG maps for Tehama County covering 2025 land cover, forest and farmland, impervious/developed land, and 1985–2025 class differences.
- Included Files: Use only the versions confirmed in the article and supplied images
- File Type: Use the confirmed download contents
- Intended Use: Printing, education, presentations, and map-based projects
Related Maps
- Alameda County California Land Cover Map
- Alpine County California Land Cover Map
- Amador County California Land Cover Map
Sources and Further Reading
- MRLC Annual NLCD Data — official access to annual land-cover datasets and related products.
- USGS Annual NLCD Land Cover Classification — class definitions and interpretation guidance for the Annual NLCD product.
- Tehama County official overview — county background on the Sacramento River, open space, the central valley floor, and local natural-resource setting.
- Tehama County Planning Department — official planning information for land-use, zoning, and permitting questions that are separate from land-cover classification.
Green Map creates custom-edited map images using open geographic data sources such as geoBoundaries, Natural Earth, OpenStreetMap, and government open data.
These maps are edited visual materials, not raw data files, and are provided for education, documents, presentations, and graphic reference.