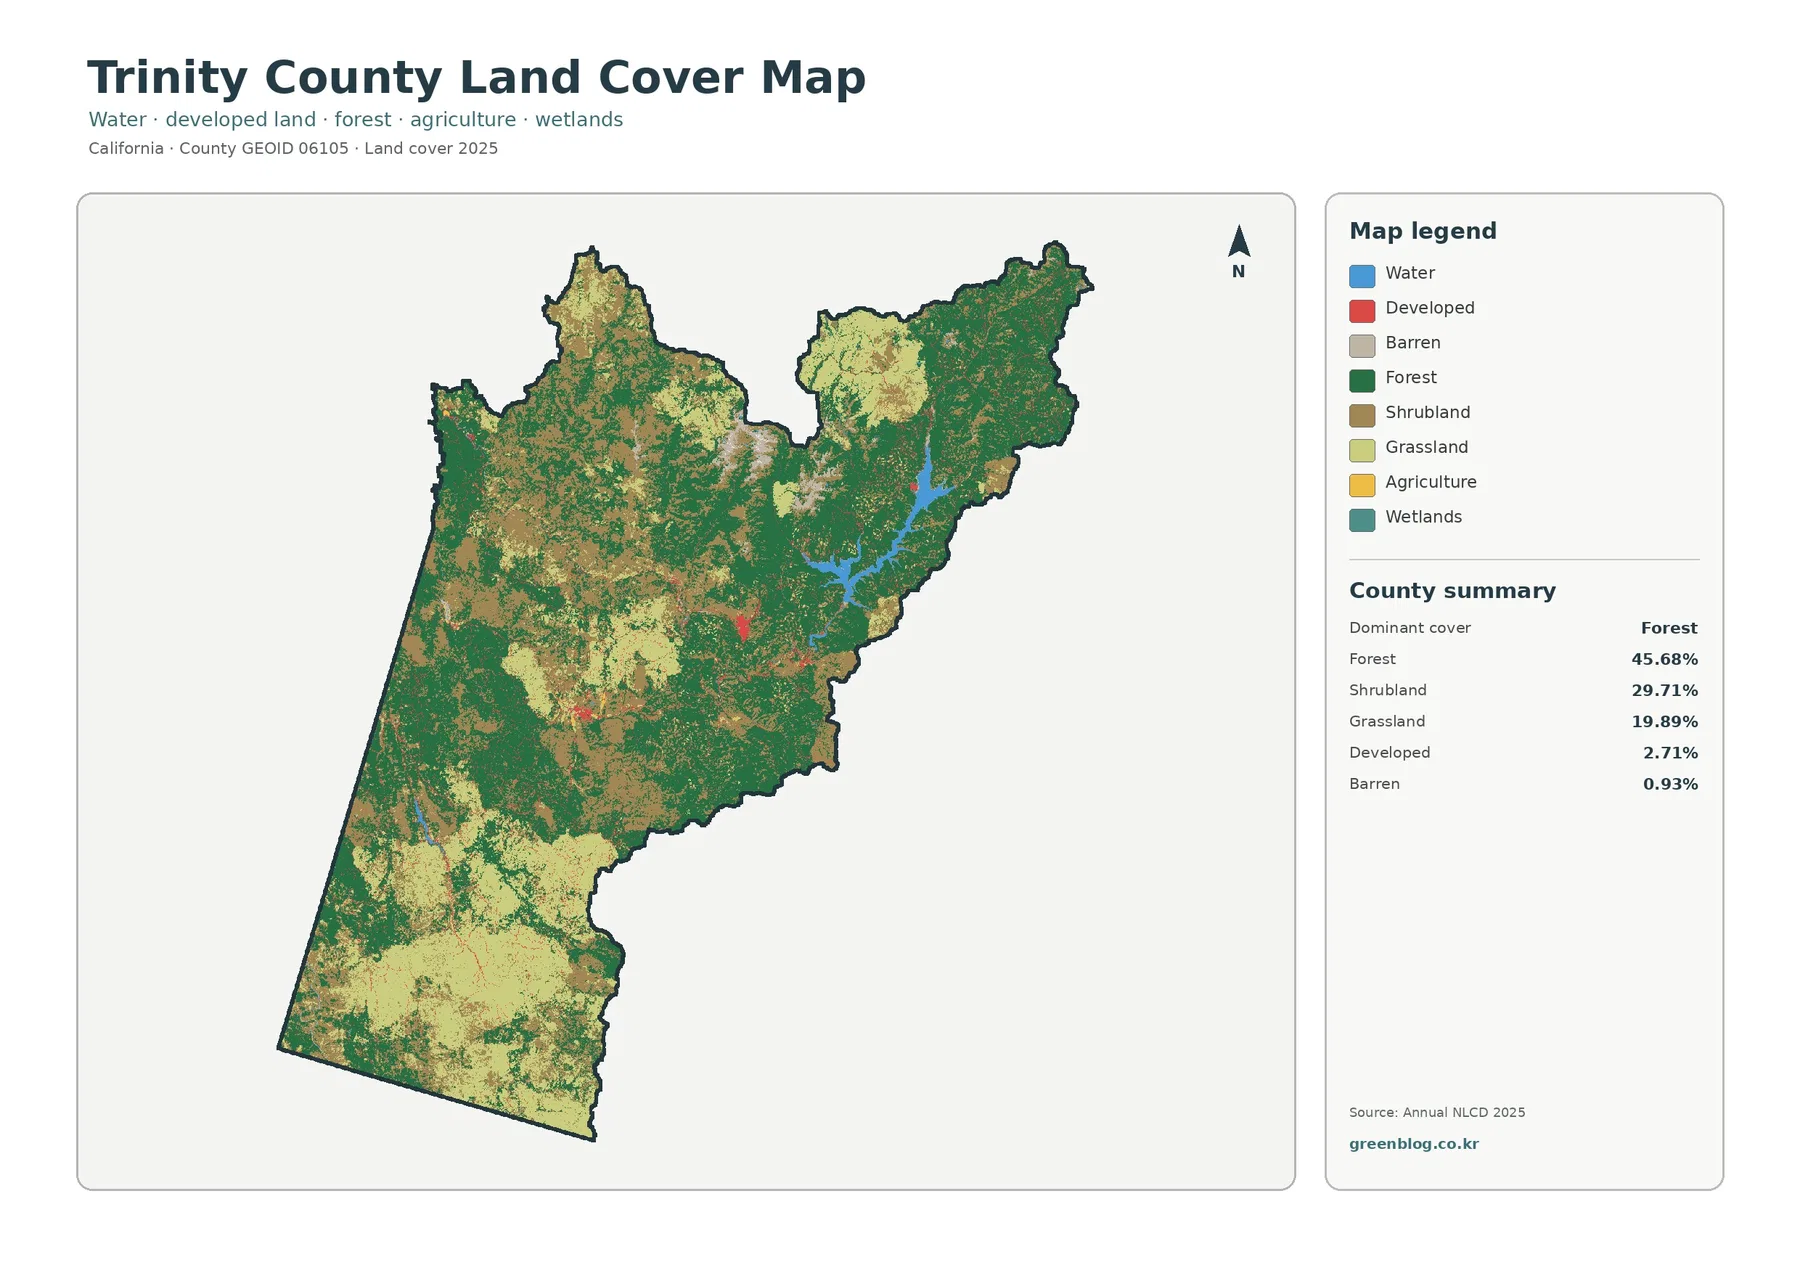
The Trinity County California Land Cover Map is dominated by natural cover rather than built surfaces. Forest accounts for 45.68% of the 2025 summary, while shrubland covers 29.71% and grassland 19.89%. Developed cover is only 2.71%, so the strongest countywide contrast is not between city and countryside. It is between broad forested areas and large openings of shrub and grass cover.
This page compares four views of the same county: general land cover, forest and farmland, impervious surface and developed land, and mapped class differences from 1985 to 2025. The WebP images are convenient for reading on the page, and the four original JPG maps are available together in one download. They can be used for classroom work, reports, presentations, or as reference images when discussing Trinity County’s landscape.
Table of Contents
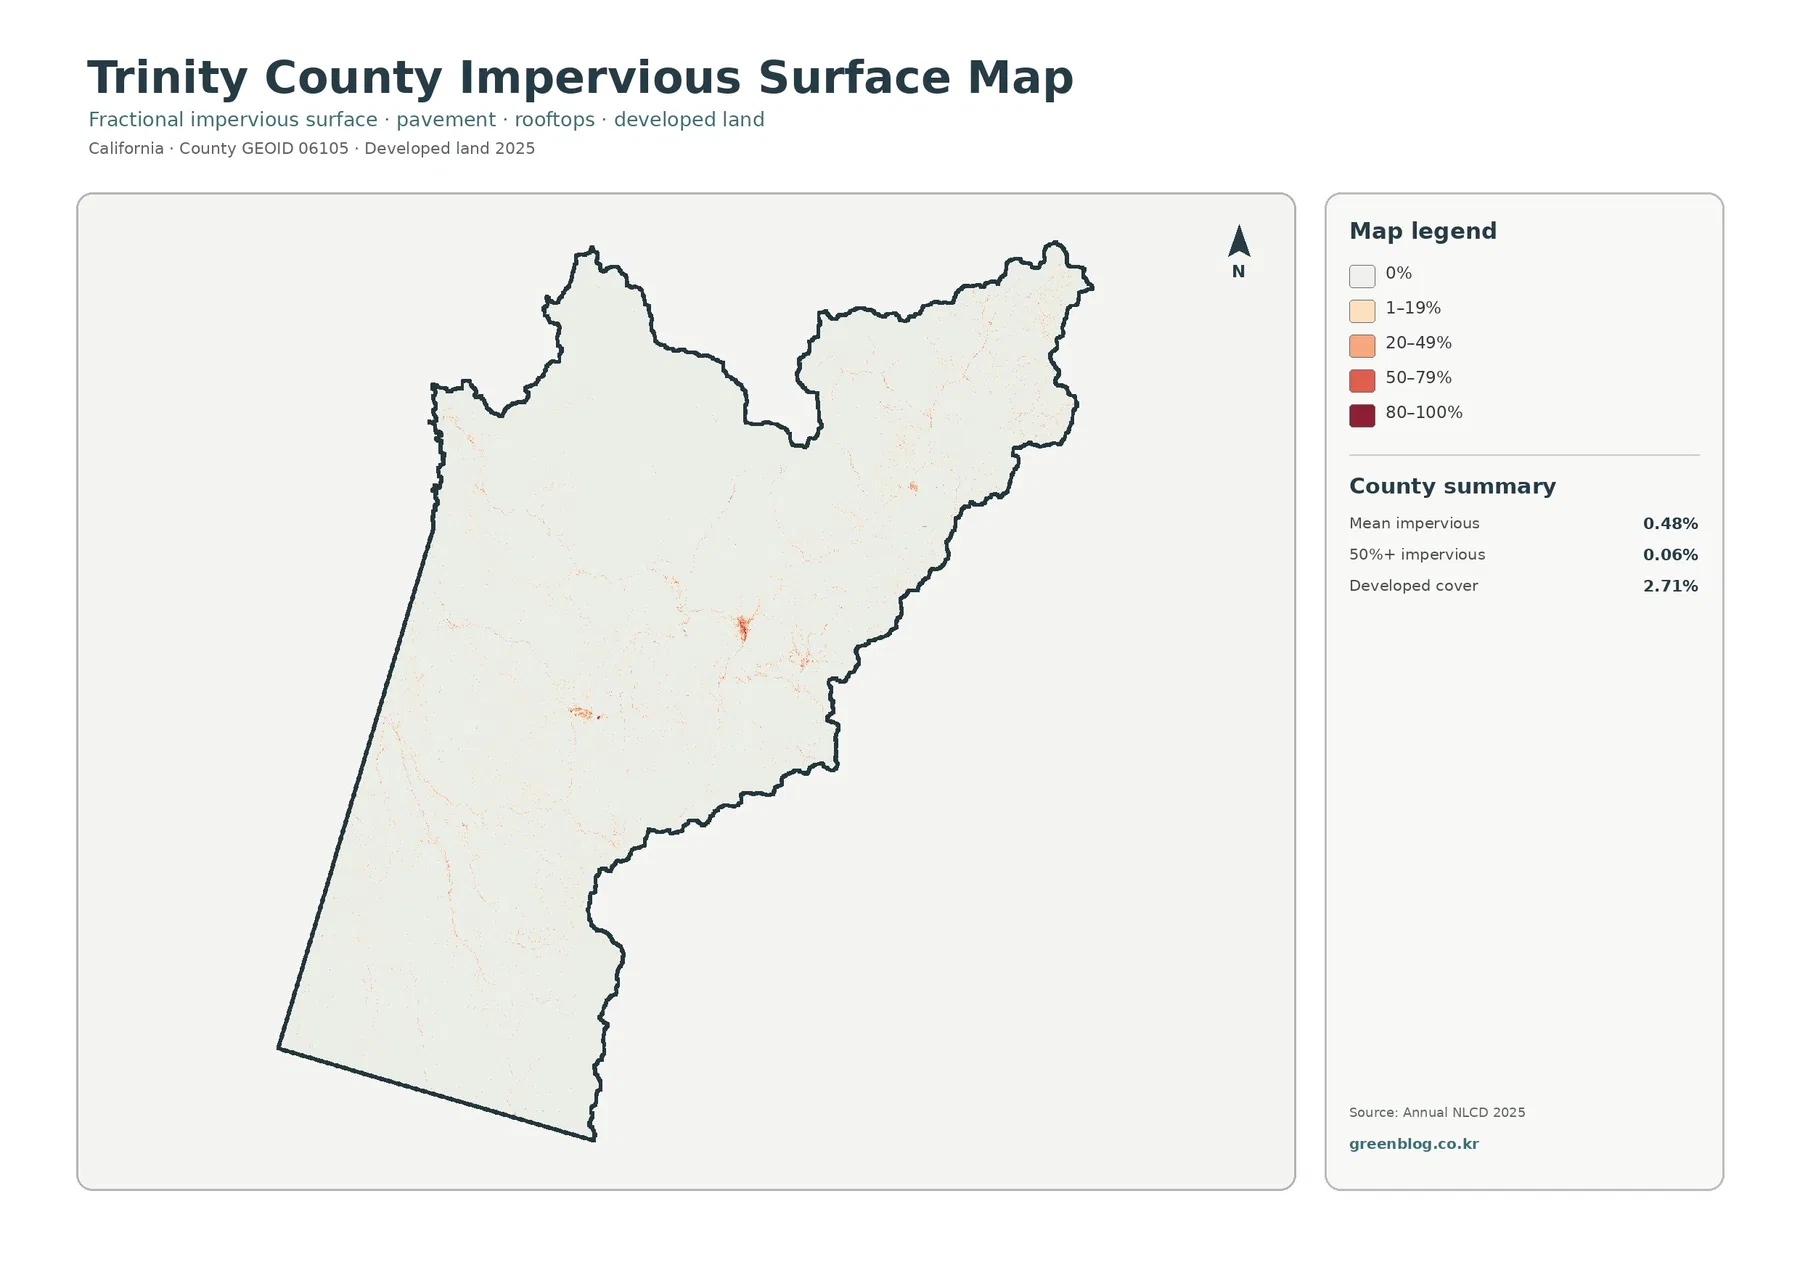
Hard surfaces barely register at county scale
Trinity County’s impervious map is unusually pale. Impervious surface means roofs, pavement, and other hard surfaces that do not readily absorb rainfall. The countywide mean is just 0.48%, and only 0.06% of the mapped area reaches 50% impervious cover or more. Even the broader developed-land class occupies 2.71% of the county. Those numbers help explain why the map is mostly near white, with stronger orange and red appearing only in small clusters and thin lines.
The most visible hard-surface concentrations are small compared with the county outline. A few compact spots appear around the central portion of the map, with lighter traces extending along narrow corridors elsewhere. The map is useful for comparing where built surfaces are concentrated, but it is not a street map and cannot show individual parcels accurately. At a 30-meter land-cover scale, a single cell can contain a road, vegetation, and a building at the same time.
Forest shares the county with broad shrub and grass cover
The general 2025 land-cover view fills much of Trinity County with forest green, but large brown and light-green areas interrupt that forest across the west, north, south, and interior. Forest is the largest single class at 45.68%. Shrubland follows at 29.71%, and grassland adds another 19.89%. Together, those three categories account for most of the county and create a much more varied surface than a simple label such as “forested county” would suggest.
Barren cover is listed at 0.93%, while developed land is 2.71%. Water and wetlands appear clearly in the legend and on the map but are smaller components of the total area. The eastern side contains the most conspicuous blue water feature, surrounded largely by forest with patches of open cover. Elsewhere, forest and open vegetation break into irregular mosaics rather than neat bands, which is one reason a countywide raster map should be treated as a broad surface summary instead of a property-level boundary map.
Trinity Lake and the Trinity Alps add useful geographic context
The U.S. Forest Service describes the Trinity Alps area of the Shasta-Trinity National Forest as encompassing Trinity Lake, Lewiston Lake, the Trinity River, and the Trinity Alps Wilderness. That official context helps explain why water and forest deserve to be considered together when interpreting the eastern side of the county map. The land-cover image itself is not a hydrology or recreation map, so it should not be used to identify precise lake shorelines, river channels, trails, or management boundaries.
The broader Shasta-Trinity National Forest includes millions of acres, mountain lakes, streams, rivers, and a wide range of elevations. Not all of that forest lies within Trinity County, and national-forest boundaries are not the same as the county boundary shown here. Still, the Forest Service description provides verified regional context for the large forest and water components visible in the county map. Land cover tells us what the surface is classified as; it does not tell us who owns or manages the land.
Agriculture is almost absent from the 2025 summary
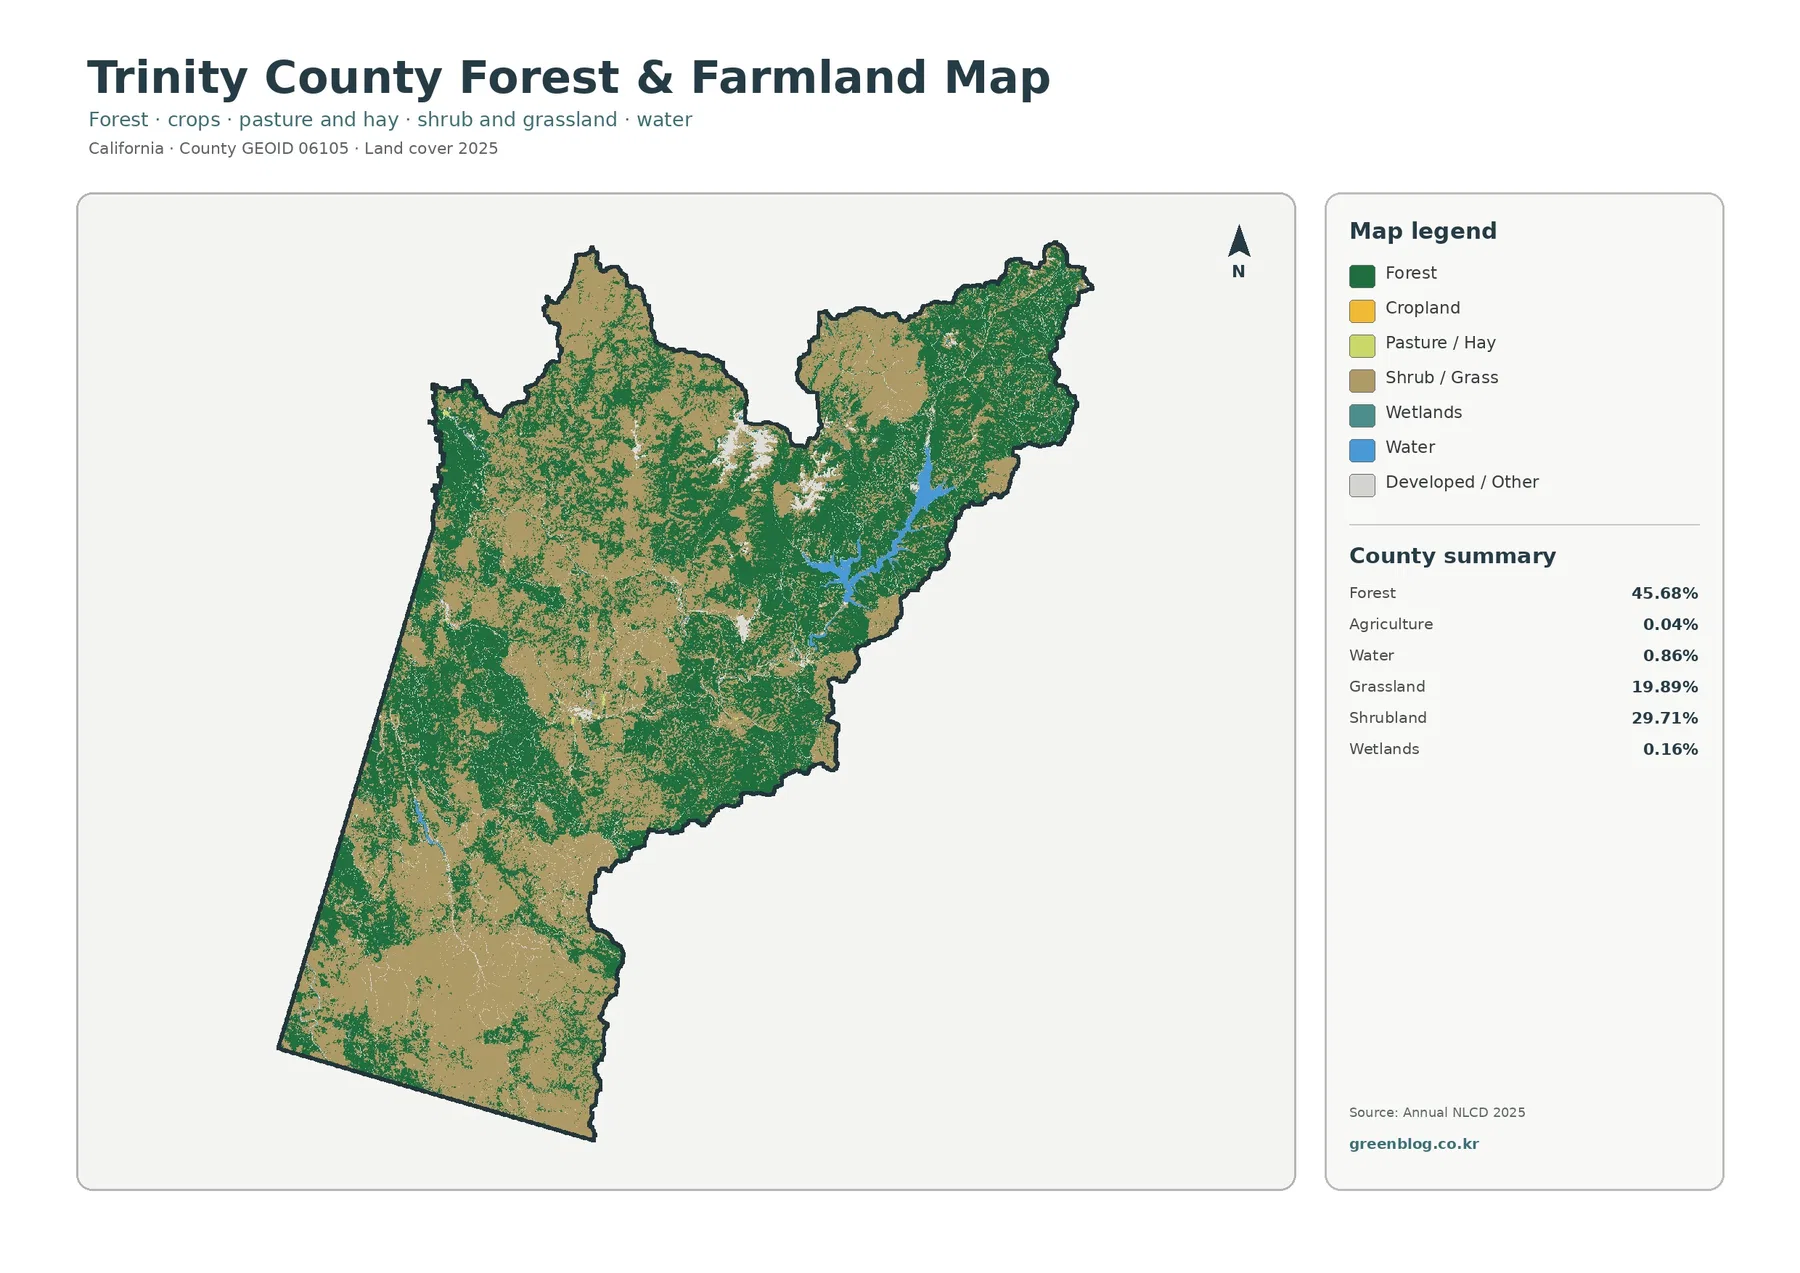
The forest-and-farmland view is valuable in Trinity County precisely because farmland is so scarce. Agriculture accounts for only 0.04% of the mapped area. By comparison, forest is 45.68%, shrubland 29.71%, and grassland 19.89%. The agricultural color appears only in tiny traces, while forest and shrub/grass categories fill nearly the entire county.
Water is 0.86% and wetlands are 0.16% in this summary. Small countywide percentages do not mean that these features are unimportant on the ground. A large mountainous county can contain ecologically important lakes, rivers, and wet places while those features still occupy a small share of total area. For that reason, use the percentages to understand overall composition and use the map colors to locate where the smaller classes occur.
The 1985–2025 change map is a difference map, not a cause map
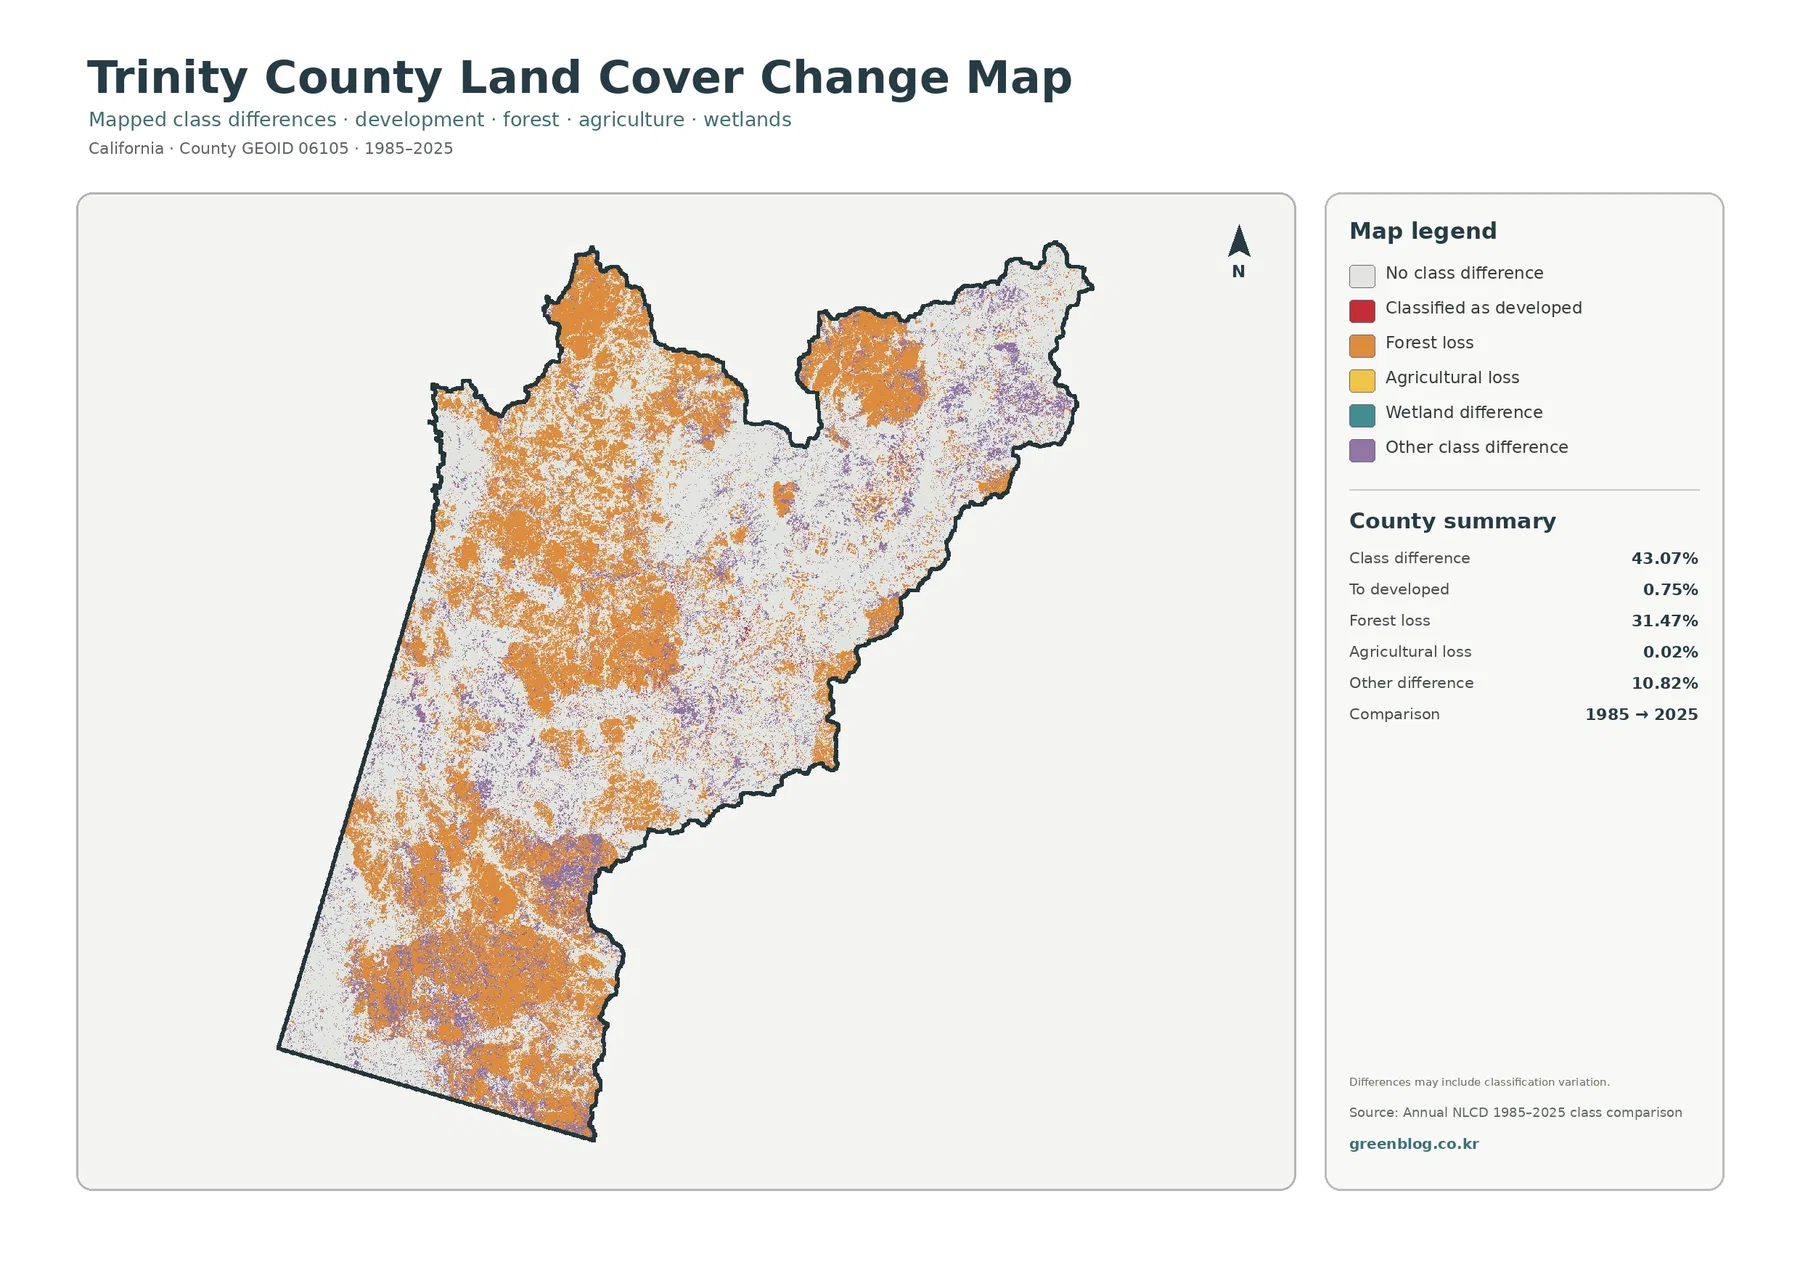
The change view reports that 43.07% of mapped cells fall into a different class in the 1985-to-2025 comparison. “Forest loss” is the largest category at 31.47%. Other class differences account for 10.82%, cells classified as developed account for 0.75%, and agricultural loss is 0.02%. Orange forest-loss areas are widespread, especially across western, northern, and southern parts of the county, while purple other-difference areas appear in several interior and eastern locations.
Those colors should not automatically be labeled wildfire, logging, permanent deforestation, or development. The map includes a note that mapped differences may include classification variation. Satellite observations, vegetation condition, mixed pixels, and classification methods can all affect which class a cell receives in a given year. A specific explanation requires additional evidence such as fire-history layers, forest-management records, aerial imagery, or field observations.
This makes the map best suited to screening rather than proof. It can identify broad areas where the two dates do not match and help a researcher decide where to investigate next. It cannot establish why the class changed, whether a change was temporary, or whether a legal land-use change occurred. The distinction is especially important in Trinity County because the mapped forest-loss category is so large.
A practical way to compare the four views
Start with the general land-cover map when the question is simply where forest, shrubland, grassland, water, barren cover, and developed areas occur. It is the broadest overview and provides the clearest first impression of the county. Move to the forest-and-farmland version when the distinction between forest, agriculture, pasture or hay, and shrub/grass cover matters more than the full legend.
The impervious map is more useful when the question concerns built surfaces. A place can be mapped as developed without being almost completely paved, so the 0.48% mean impervious value adds information that the 2.71% developed-cover figure cannot provide by itself. Finally, use the change map to find where the two comparison years differ. It should be paired with other dated records before any claim is made about a specific disturbance or land-use event.
Reading the maps in this order also prevents categories from being confused. Forest cover is not a national-forest ownership layer. Agricultural cover is not a zoning layer. Developed cover is not a building-permit map. Impervious percentage is not a parcel survey. Keeping those distinctions clear makes the images more useful and reduces the risk of turning a generalized raster classification into a legal or site-specific conclusion.
Useful for education, environmental context, and early planning review
For classroom use, Trinity County offers a strong contrast with heavily farmed or urban counties. Students can compare the 45.68% forest share and 0.04% agriculture share with counties where crops dominate. The impervious map provides another clear comparison because its mean is only 0.48%. These differences make it possible to discuss how countywide land-cover composition changes from one part of California to another without relying on population or economic statistics.
For environmental presentations, the maps can be paired with Forest Service information about the Trinity Alps, Trinity Lake, Lewiston Lake, and the Trinity River. The general map gives surface-cover context, while the official Forest Service material supplies named geographic references. This combination is more informative than presenting either source alone, provided that the two are not mistaken for the same type of map.
For planning or environmental review, the maps work best as a first-look reference. Trinity County’s Planning Division publishes general-plan and environmental-review materials that should be consulted for actual policy, zoning, permitting, or project evaluation. A land-cover image can show that a broad area is forested or sparsely developed, but it cannot determine what is legally permitted on a particular site.
Scale, mixed pixels, and classification limits
Annual NLCD is a raster product, meaning the surface is represented by a grid of cells. Each cell receives a class based on the underlying data and classification process. Near roads, lake edges, forest openings, and settlement boundaries, one cell may contain more than one real-world surface. The resulting class is therefore a generalized representation, not a survey-grade boundary.
That limitation matters for all four maps. A small patch of development can disappear at county scale, a narrow stream can be simplified, and the line between forest and grassland can shift with vegetation condition or classification. The 1985–2025 map adds a second layer of uncertainty because it compares two classifications separated by forty years. Use it to guide questions, not to substitute for current aerial imagery, parcel data, or site inspection.
Download the four Trinity County JPG maps
The download contains one original JPG for each map explained on this page: general land cover, forest and farmland, impervious surface and developed land, and the 1985–2025 land-cover change map. Each source image is 2480 × 1754 pixels. The files are kept at their original supplied resolution rather than being enlarged and presented as higher-resolution artwork.
Frequently Asked Questions
Does the 31.47% forest-loss category mean that 31.47% of Trinity County was permanently deforested?
No. It means those cells changed from a forest class to another mapped class in the 1985–2025 comparison. The map warns that classification variation may be included, so wildfire, logging, vegetation change, and classification effects cannot be separated without additional evidence.
Why does the impervious map look almost blank?
The countywide mean impervious surface is only 0.48%, and just 0.06% of the county reaches 50% impervious cover or higher. Most hard surfaces are therefore limited to small clusters and narrow corridors rather than broad urban areas.
Can these maps be used to check zoning, ownership, or buildable land?
No. Land cover classifies the visible surface and does not show parcel ownership, zoning, legal land use, or development rights. Use Trinity County’s official planning and parcel resources for those questions.
Map File Information
The ZIP contains four original JPG maps covering the main land-cover views used in this Trinity County article.
- File Type: Four JPG files in one ZIP archive
Related Maps
- Alameda County California Land Cover Map
- Alpine County California Land Cover Map
- Amador County California Land Cover Map
Sources and References
- MRLC Annual NLCD Data — annual land-cover data access and supporting products.
- USGS Annual NLCD Land Cover Classification — definitions for forest, shrubland, grassland, developed land, and other classes.
- U.S. Forest Service — Shasta-Trinity National Forest — regional context for Trinity Lake, Lewiston Lake, the Trinity River, and the Trinity Alps.
- Trinity County Planning Environmental Review — official county planning and environmental-review materials.
- U.S. Census Bureau TIGER/Line Shapefiles — county boundary reference data.
Green Map creates custom-edited map images using open geographic data sources such as geoBoundaries, Natural Earth, OpenStreetMap, and government open data.
These maps are edited visual materials, not raw data files, and are provided for education, documents, presentations, and graphic reference.