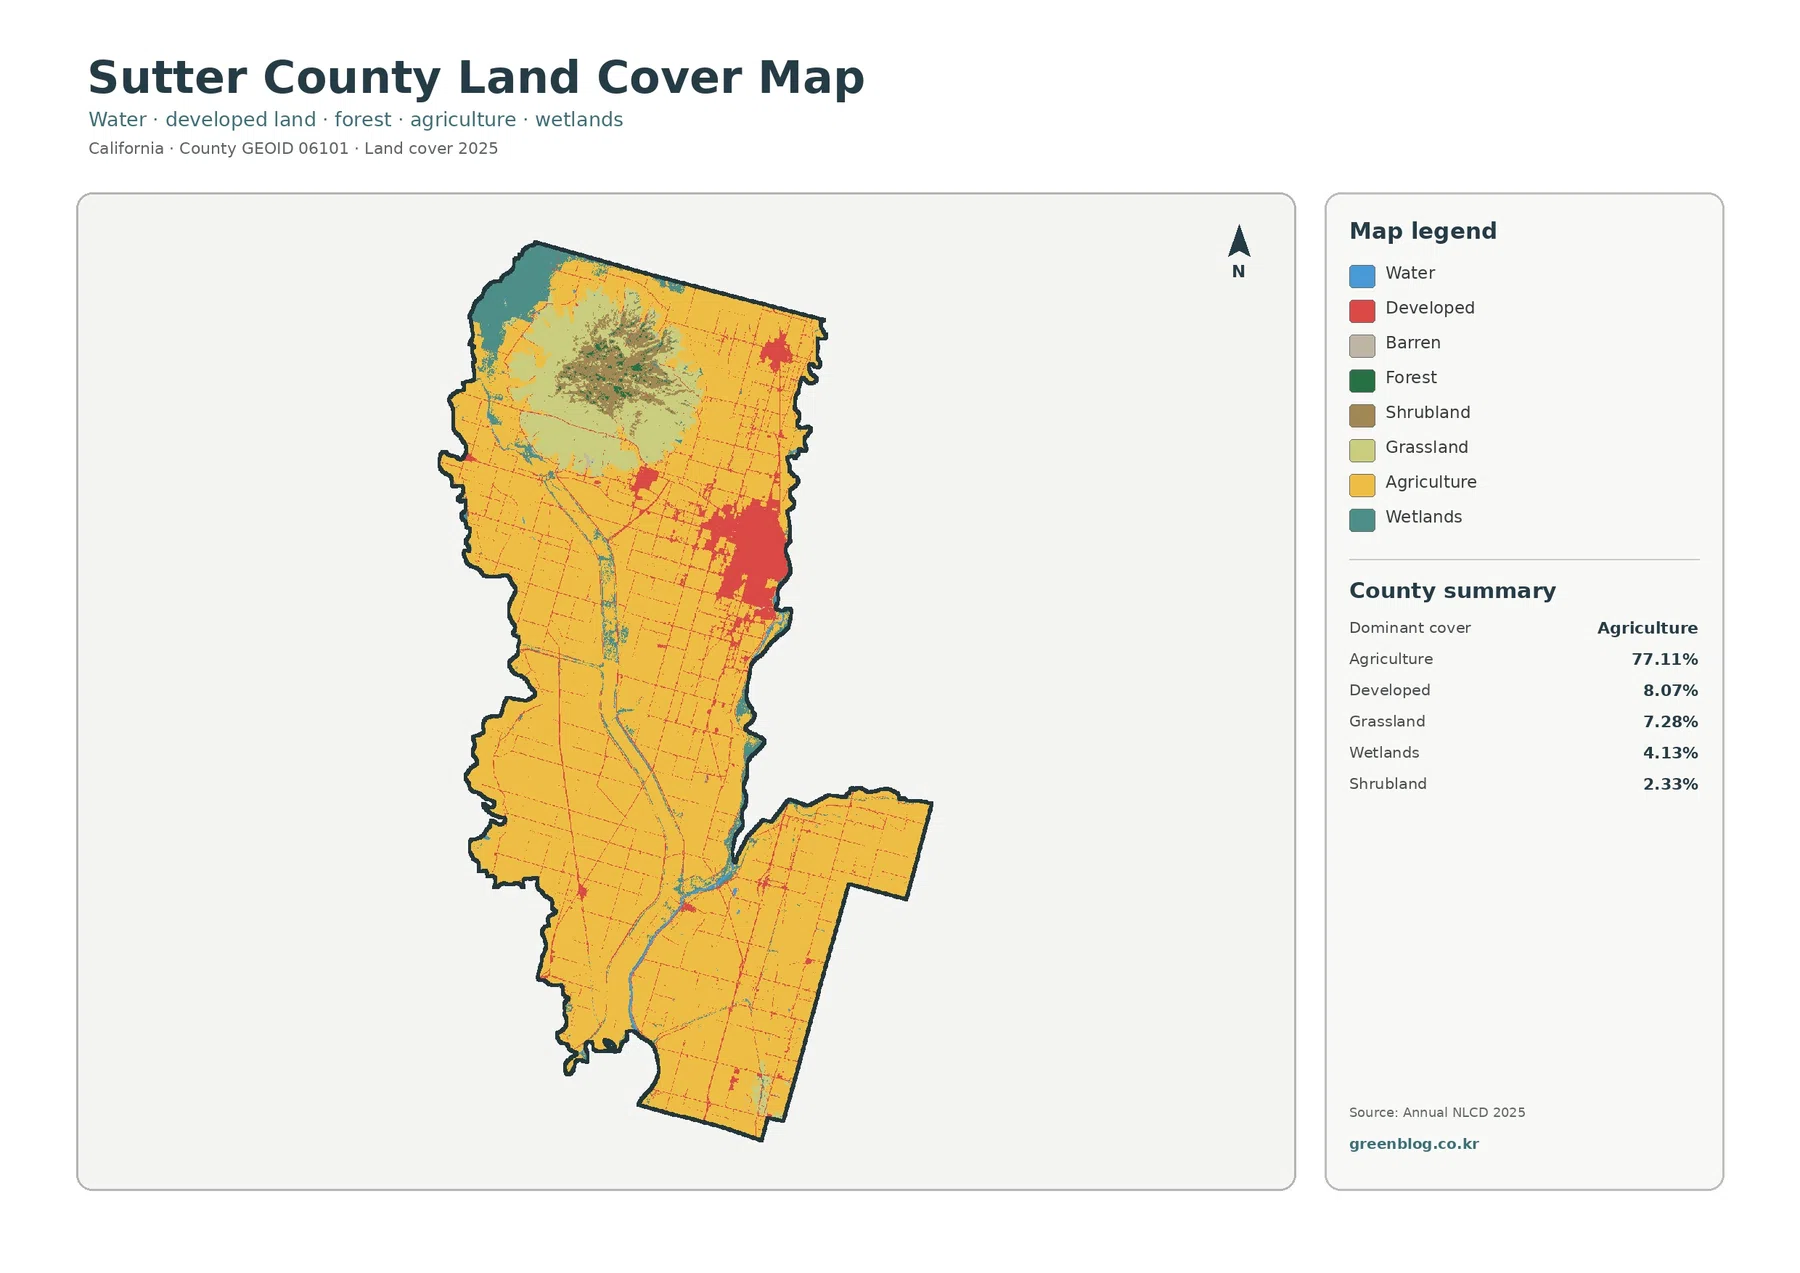
The Sutter County California Land Cover Map is dominated by one unmistakable feature: agriculture. The 2025 summary assigns 77.11% of the county to agricultural cover, while developed land is concentrated on the eastern side and the Sutter Buttes form a contrasting patch of grass, shrub, and other cover within the northern valley. Four coordinated maps on this page separate those patterns so they are easier to compare.
The four original JPG maps are available in one download: general land cover, forest and farmland, impervious surface and developed land, and mapped change from 1985 to 2025. Each original image is 2480 × 1754 pixels. They work well for county overviews, environmental lessons, presentations, and comparisons that need more detail than a single land-cover image can provide.
Table of Contents
A Countywide Pattern Shaped by Farmland
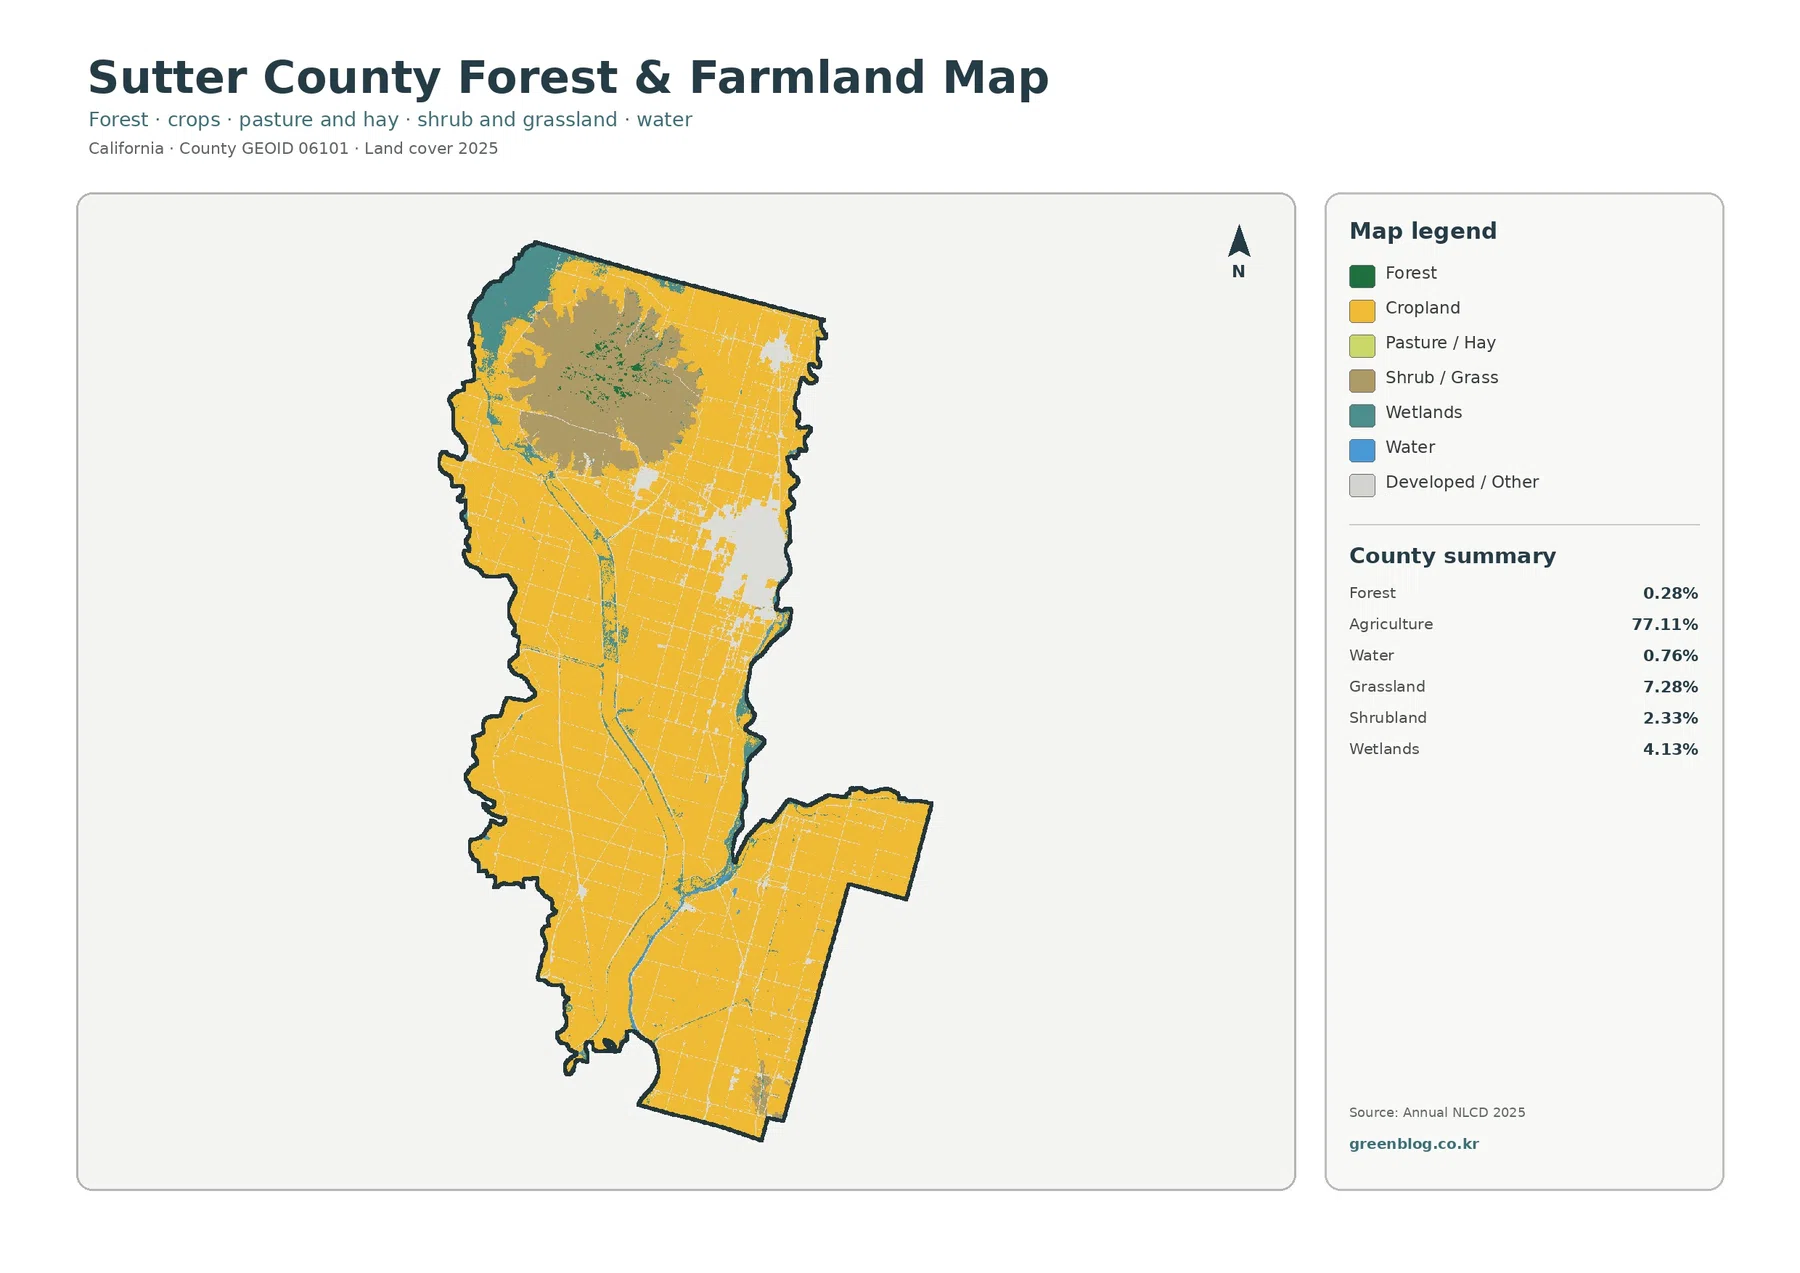
Agriculture accounts for 77.11% of the mapped 2025 cover. Developed land follows at 8.07%, grassland at 7.28%, wetlands at 4.13%, and shrubland at 2.33%. Those numbers match the visual impression: yellow agricultural cells cover most of the broad valley floor, while other classes occupy much smaller areas. Sutter County’s own overview describes a landscape centered on agriculture between the Sacramento and Feather Rivers, with the Sutter Buttes rising above the otherwise flat valley.
The general map is useful because it keeps all of those classes visible at once. A large developed cluster stands out on the eastern side around Yuba City, and a smaller developed area appears farther north near Live Oak. Water and wetland colors trace river and drainage corridors, while the northern interior around the Sutter Buttes breaks the otherwise continuous agricultural pattern with shrubland, grassland, and other cover.
Yuba City and the County’s Concentrated Developed Surface
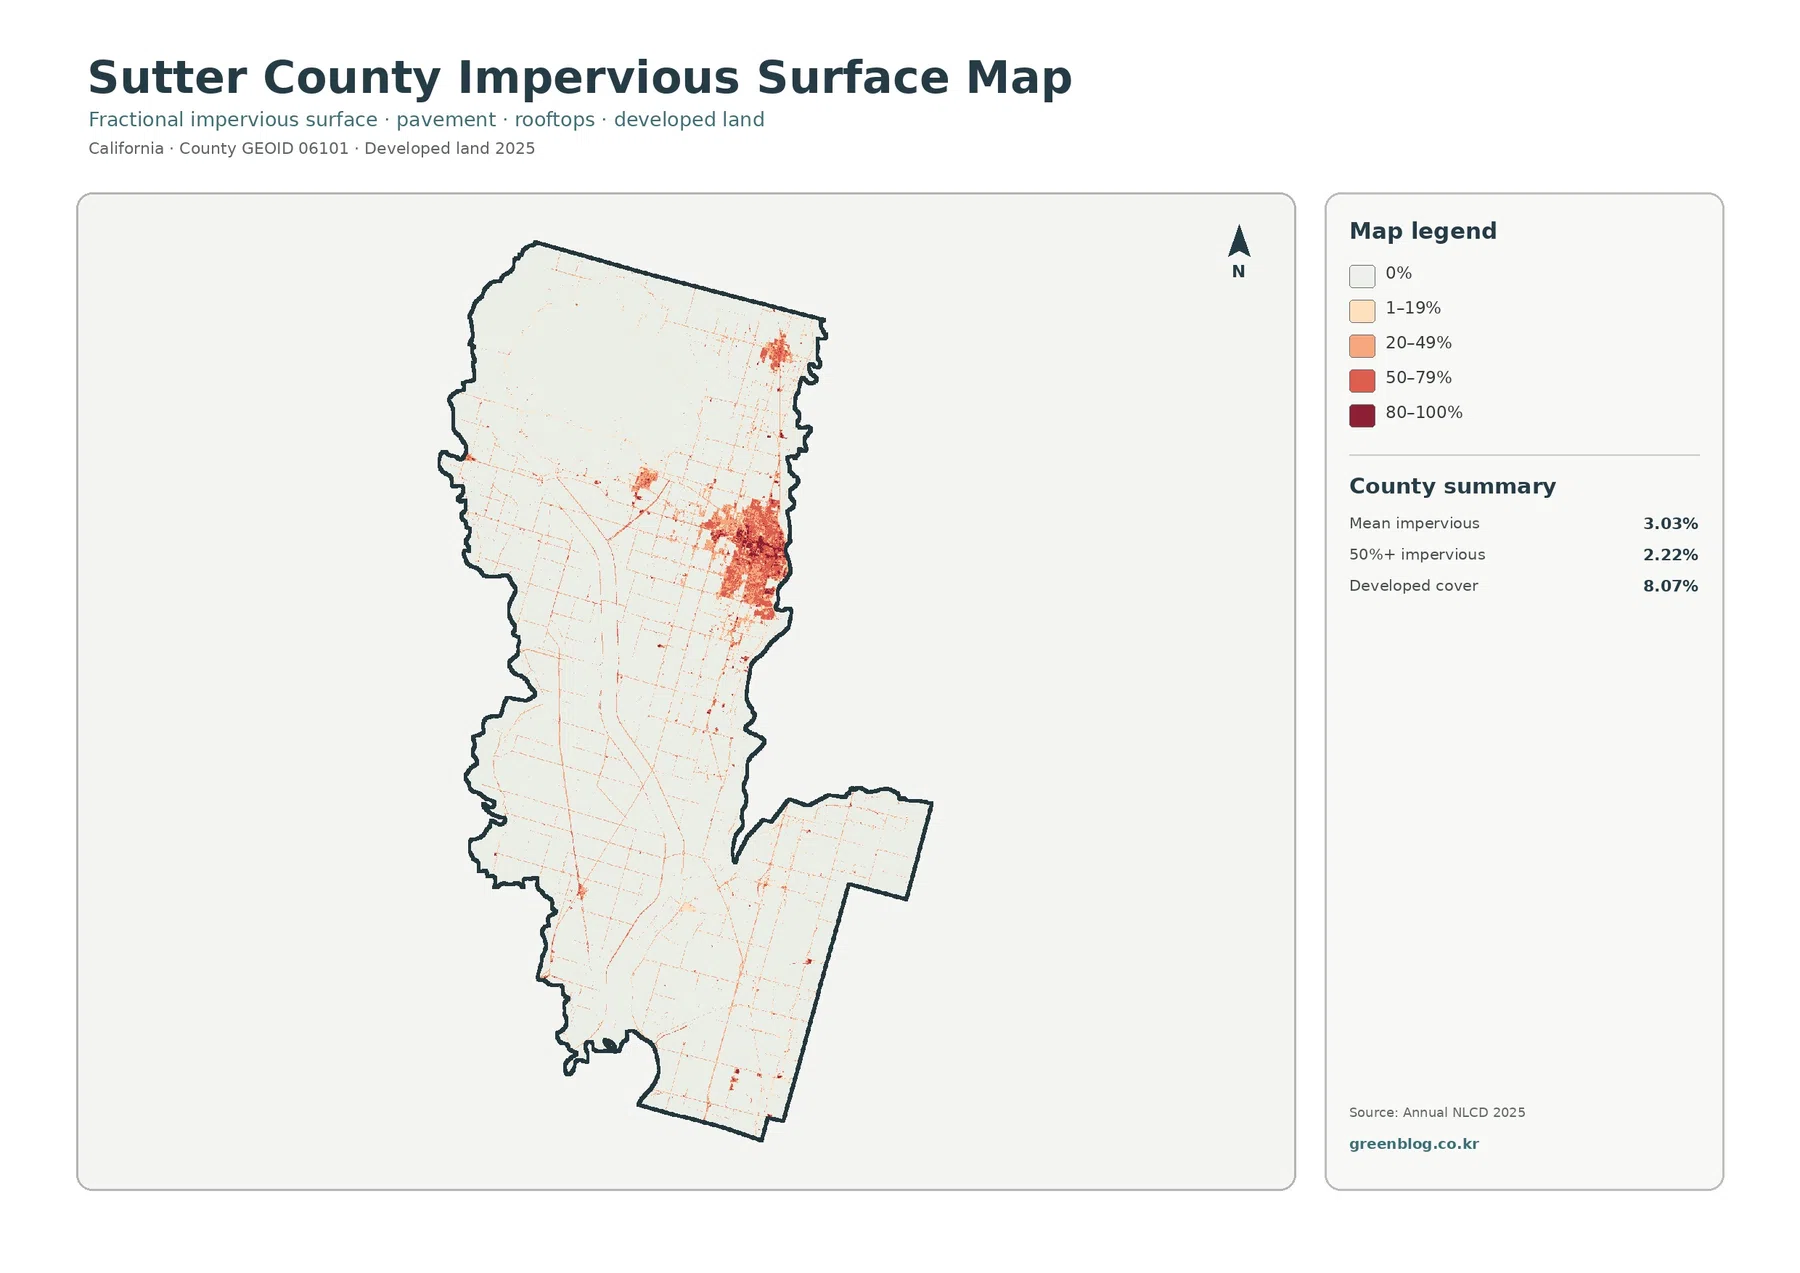
The impervious-surface map makes the urban-rural contrast much clearer than the general land-cover view. Impervious surface means pavement, rooftops, and other surfaces that do not readily absorb water. The countywide mean is 3.03%, and only 2.22% of the county falls in the 50% or higher impervious category. That is consistent with a county where most land is agricultural rather than urban.
Higher impervious values form a dense cluster along the eastern middle of the county around Yuba City. Smaller patches appear around other developed places, while thin lines follow portions of the road network through the agricultural plain. The map does not imply that every developed pixel is fully paved. Developed land covers 8.07% of the county, but that class can include lawns, trees, soil, and low-density spaces between buildings and streets.
The Sutter Buttes Break Up the Agricultural Plain
Sutter County’s official General Plan describes two broad physical settings: the flat valley floor and the Sutter Buttes. That distinction is easy to see in the map set. The Buttes appear in the northern part of the county as a compact area where the agricultural color gives way to grass, shrub, small forest patches, and other classes. Their different surface cover makes them a useful reference point when orienting readers who are unfamiliar with the county.
This is also a good place to separate land cover from legal land use. Land cover classifies what physically covers the ground in the satellite-based dataset. It does not identify zoning, ownership, parcel boundaries, conservation easements, or whether a site can be developed. A grassland or shrubland color around the Buttes therefore describes mapped surface cover, not a legal designation.
Farmland, Wetlands, and Small Natural-Cover Pockets
The forest-and-farmland map simplifies the county into categories that are especially useful for agricultural and habitat comparisons. Agriculture remains 77.11%, while forest is only 0.28%, water 0.76%, grassland 7.28%, shrubland 2.33%, and wetlands 4.13%. Forest is therefore a very small countywide class even though small wooded patches can still matter locally.
Wetland and water cells are more noticeable because they form narrow, connected features beside rivers and drainage corridors. The Sacramento and Feather Rivers help define the county’s geographic setting, and the map shows why a simple description of Sutter County as “farmland” is incomplete. The agricultural plain is extensive, but it is crossed and edged by water-related cover that can be important for habitat, drainage, and regional landscape context.
What the 1985–2025 Change Map Actually Measures
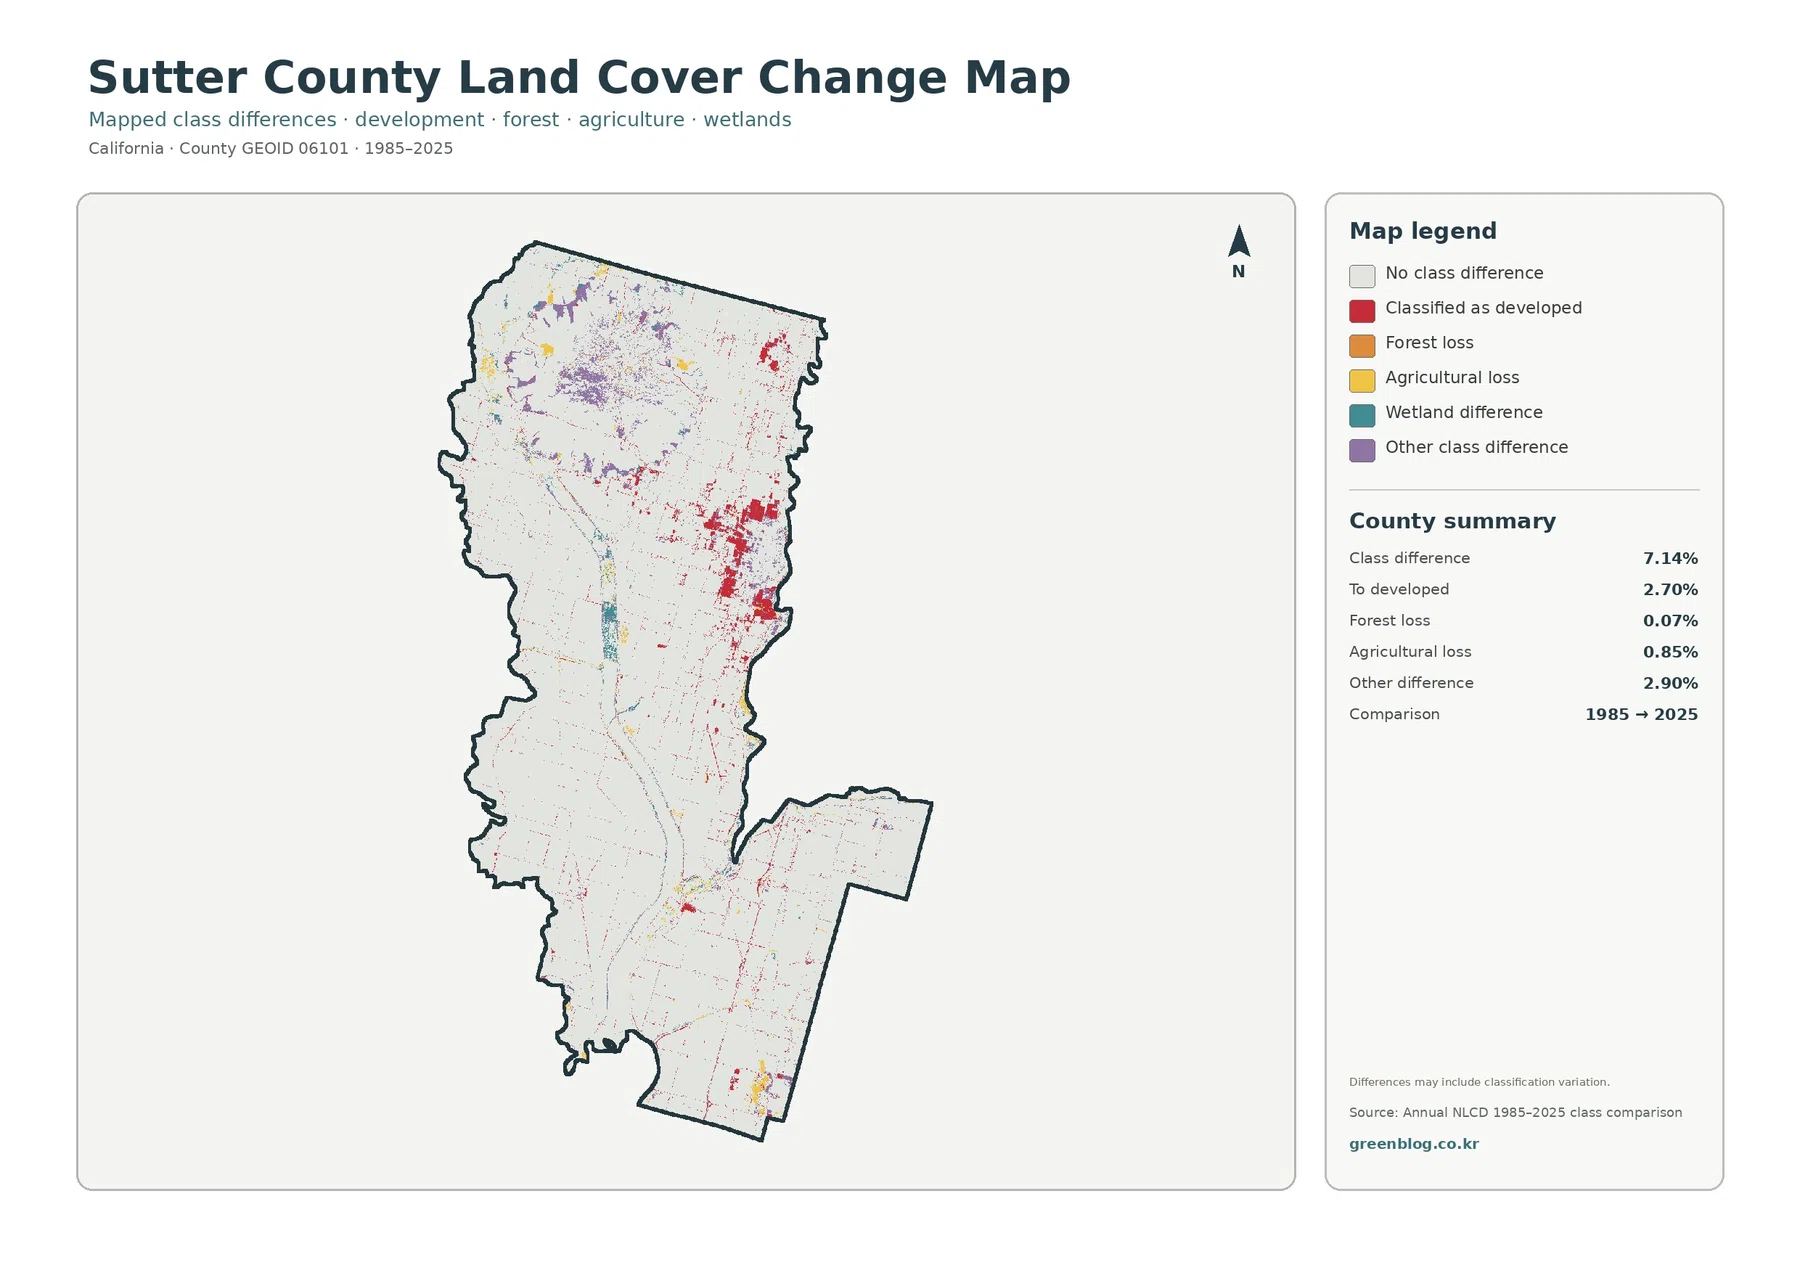
The change map compares mapped classes from 1985 and 2025. Its county summary reports a total class difference of 7.14%. Areas classified as developed account for 2.70%, agricultural loss for 0.85%, forest loss for 0.07%, and other class differences for 2.90%. The red developed-change cells are most visible near the eastern urban area, while other differences are scattered through parts of the north and central county.
Those percentages should not be treated as a parcel-by-parcel history. The map itself warns that class differences may include classification variation. Annual NLCD is a raster dataset made of generalized grid cells, and a 30-meter cell can contain more than one type of surface. Differences in imagery, mixed pixels, classification rules, or the exact location of a class boundary can make a cell change categories even when the ground did not undergo a simple one-step conversion.
For that reason, a red change cell can be used to identify an area worth checking, but it should not by itself be cited as proof that a particular farm became a subdivision. A detailed local study would need aerial photographs, planning records, permits, or other site-specific evidence. The county’s General Plan and GIS resources are better sources for legal land-use questions.
How to Use the Four Maps Together
For a county introduction, start with the general land-cover map. It gives the fastest view of the farm-dominated valley, developed eastern edge, river-related cover, and the Sutter Buttes. If the goal is agriculture or habitat, move next to the forest-and-farmland map because it removes some visual complexity and makes cropland, grassland, wetlands, and other natural-cover classes easier to compare.
For an urban-environment topic, the impervious map adds information that a developed-land class alone cannot provide. It shows where hard surfaces are concentrated and where development remains relatively open. The change map belongs last in most presentations because it requires the most caution: it is useful for locating mapped differences across four decades, but not for assigning a cause to those differences.
All four maps use the same county outline, so they can be placed in sequence in a report or slide deck without changing the geographic frame. They should not be used as parcel surveys, zoning maps, flood-hazard maps, property records, or engineering documents. Small features and class boundaries are generalized, and land cover may have changed after the observation year.
Download the Sutter County Land Cover JPG Set
The downloadable archive contains the four original JPG maps represented by the WebP previews on this page. Each file is 2480 × 1754 pixels. The source package marks these as original-resolution images and does not classify them as A3 high-resolution reference files, so they should be printed only after checking that the legend and small details remain readable at the chosen output size.
Frequently Asked Questions
Does 77.11% agriculture mean that the same share is legally designated farmland?
No. The 77.11% figure is a land-cover classification for 2025. It describes cells mapped as agricultural cover. Legal farmland designations, zoning, parcel ownership, and conservation programs use different records and should be checked through county or state planning sources.
Why is developed cover 8.07% while mean impervious surface is only 3.03%?
Developed land can contain both hard surfaces and permeable areas such as yards, trees, bare soil, and low-density open space. Impervious surface measures the fraction covered by pavement, roofs, and similar hard materials, so the two percentages answer different questions.
Can the change map prove where development occurred between 1985 and 2025?
It can identify cells whose mapped class changed, including cells classified as developed in 2025, but it is not proof of a specific development event. Classification variation and mixed pixels can contribute to the differences, so parcel-level conclusions require additional evidence.
Map File Information
The ZIP contains four original JPG maps for Sutter County: 2025 land cover, forest and farmland, impervious surface and developed land, and the 1985–2025 class-difference map.
- Included Files: Use only the versions confirmed in the article and supplied images
- File Type: Use the confirmed download contents
- Intended Use: Printing, education, presentations, and map-based projects
Related Maps
- Alameda County California Land Cover Map
- Alpine County California Land Cover Map
- Amador County California Land Cover Map
Sources and Further Reading
- MRLC Annual NLCD Data — official access to the land-cover datasets used for annual classification and comparison.
- USGS Annual NLCD Land Cover Classification — class definitions and interpretation guidance for Annual NLCD.
- Sutter County at a Glance — official county background on agriculture, the Sacramento and Feather Rivers, and the Sutter Buttes.
- Sutter County 2030 General Plan — official planning, land-use, conservation, and GIS resources for questions that go beyond land cover.
Green Map creates custom-edited map images using open geographic data sources such as geoBoundaries, Natural Earth, OpenStreetMap, and government open data.
These maps are edited visual materials, not raw data files, and are provided for education, documents, presentations, and graphic reference.