A Kansas Map becomes much more informative when the state’s broad rectangular frame is divided into all 105 counties. Western Kansas presents long rows of mostly regular blocks, but that rhythm changes near the center and becomes noticeably less uniform toward the Missouri border. The three supplied images preserve those differences in a labeled color view, a labeled black-and-white sheet, and an unlabeled outline.
Every version uses the same wide county geometry, allowing readers to switch between reference, review, and annotation without adjusting to a new arrangement. The labeled files identify counties from Cheyenne in the northwest to Cherokee in the southeast. Smaller northeastern counties receive tighter text placement, and Wyandotte uses a callout line because its name cannot sit comfortably inside the narrow shape.
These files are county-boundary graphics rather than general-purpose state atlases. They do not mark Topeka, Wichita, Kansas City, county seats, highways, rivers, terrain, or mileage. Their colored areas are visual separators only, not categories for population, farming, elections, tourism, or land use. Teachers, presentation makers, and designers should add such information only from a dated source with an appropriate legend.
Table of Contents
Kansas Map Overview
Kansas borders Nebraska on the north, Missouri on the east, Oklahoma on the south, and Colorado on the west. The color preview prints Nebraska, Colorado, and Oklahoma around the county grid but leaves Missouri unnamed. In the black-and-white version, the Nebraska label is cropped to “Neba” at the upper edge. The blank outline removes every surrounding-state label, so none of the three should be treated as a complete four-state locator map.
Official Kansas sources identify 105 counties, and both labeled images show all 105 names. The extreme corners provide useful starting points: Cheyenne is at the upper left, Morton at the lower left, Cherokee at the lower right, and the Brown–Doniphan area forms the upper-right end. Doniphan projects beyond the otherwise straight northern line, immediately signaling that the state is not a perfect rectangle.
The interior pattern also has recognizable changes. Long western rows can be followed systematically from one county to the next. Central counties introduce more varied widths and offsets, while Riley, Pottawatomie, Geary, Wabaunsee, Leavenworth, Johnson, and Wyandotte create a denser northeastern arrangement. A curved internal boundary near Riley and Pottawatomie stands out visually, but the underlying waterway is not named on these administrative maps.
Reading the Kansas Map by edges is a practical way to learn the statewide framework before moving inward. The top row begins with Cheyenne, Rawlins, Decatur, Norton, and Phillips and continues east through Smith, Jewell, Republic, Washington, Marshall, Nemaha, and Brown. Along the south, the sequence starts with Morton and continues through counties including Stevens, Seward, Meade, Clark, Comanche, Barber, Harper, Sumner, Cowley, Chautauqua, Montgomery, Labette, and Cherokee.
Included Kansas Map Versions
The archive contains three coordinated JPG images prepared for A3 landscape use. The color map emphasizes separation, the monochrome map keeps every county name while removing decorative fills, and the outline keeps only the state and county lines. A title and location-pin icon remain above the map area in all three published previews.
- Labeled pastel map of all 105 Kansas counties
- Labeled black-and-white map with the same county geometry
- Blank outline retaining the complete county network
- Landscape JPG images arranged for A3 printing and page placement
Because the boundary base does not move between versions, a worksheet created from the blank map can be checked against either labeled image. The Kansas Map set does not include a scale bar, compass, legend, inset, city marker, or county-seat symbol. That limited scope keeps attention on county identification but also defines what the files cannot support.
Color Kansas County Map
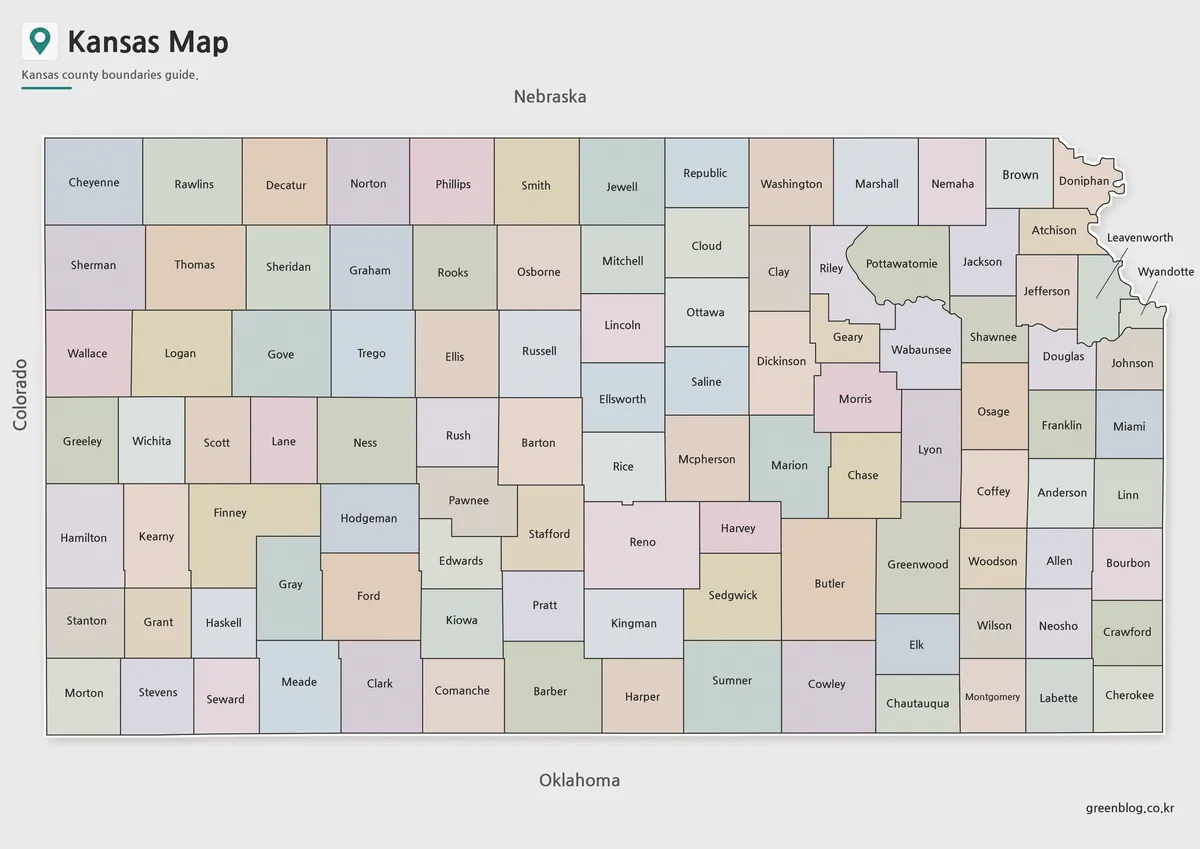
The pastel file alternates muted colors so counties sharing a boundary do not merge visually. This is most helpful across the west, where rectangular shapes of similar height and width could otherwise become one large grid. In the east, color helps separate narrower vertical counties and the irregular group around Riley, Pottawatomie, Geary, and Wabaunsee.
Most names sit near the center of their polygons. Compact northeastern shapes require different treatment: Doniphan, Leavenworth, and Wyandotte are placed close to the outer edge, with leader lines used where direct placement would be crowded. That design allows the color Kansas Map to retain every county name without creating a separate numbered key.
For classroom projection, the alternating fills make it easier to follow a spoken path across adjacent counties. A presenter might compare the top and bottom rows, trace the Colorado border, or isolate the Kansas City–area counties in the northeast. Similar shades have no shared meaning, however, so they should never be cited as evidence of a formal region or statistical class.
If data will be added, use the original color scheme only as a temporary index. Replace or cover it with a deliberate scale, cite the year and source, and place the legend outside the county grid. A limited number of categories will keep names and boundaries readable; too many saturated colors would defeat the restrained separation provided by the base image.
Black and White Kansas Map for Printing
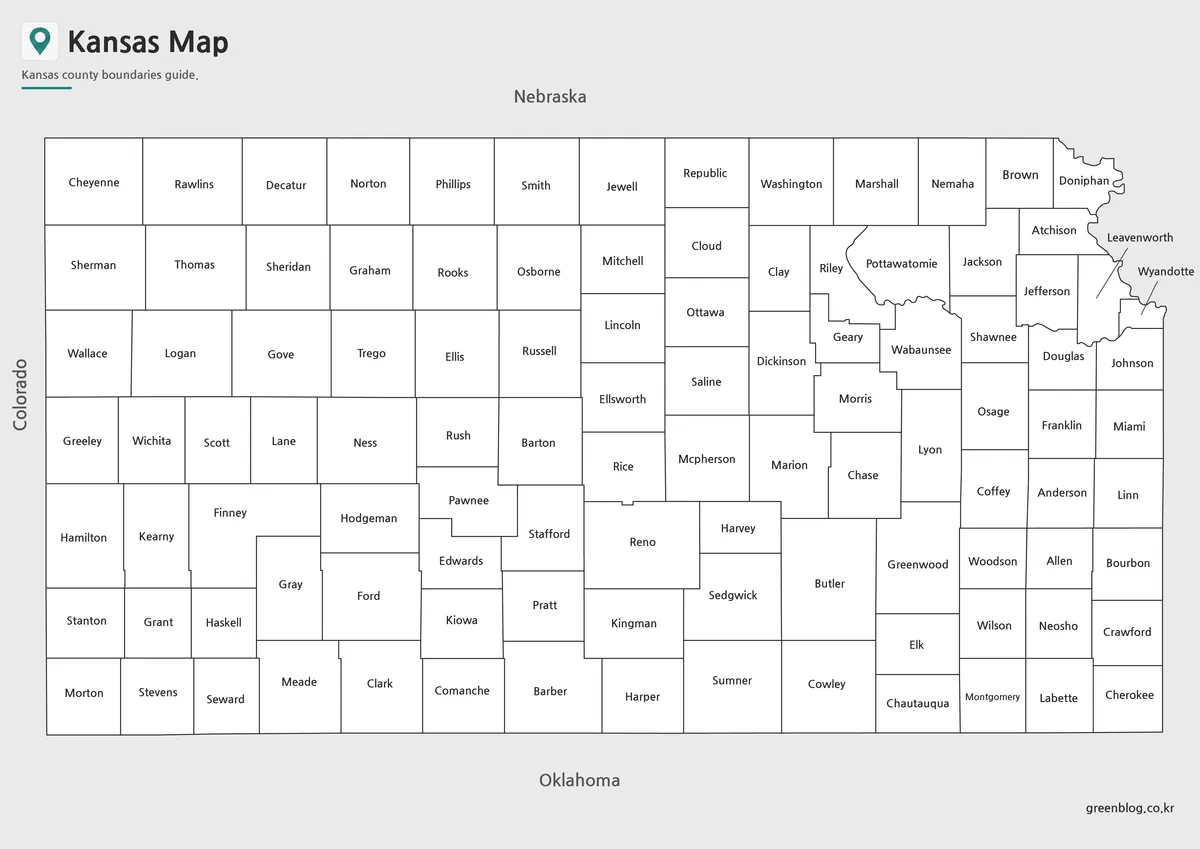
The monochrome edition leaves county interiors white while preserving names, outer borders, and internal divisions. It suits report appendices, reference sheets, answer keys, and packets in which pastel fills would compete with surrounding text. The open interiors also provide room for a small check mark or symbol, although the existing labels mean this is not a blank quiz map.
Label readability should be checked at the final print size. Broad western counties such as Sherman, Thomas, Wallace, Logan, Greeley, Hamilton, and Stanton provide comfortable horizontal space. The northeast is less forgiving: Wyandotte depends on a callout, while Leavenworth, Doniphan, Geary, and several neighboring labels occupy compact areas. A3 landscape placement gives these details more room than a narrow document column.
One visible defect deserves notice before the file is reused. The neighboring label above the map is cut to “Neba” rather than displaying the full word “Nebraska.” Kansas county names remain intact, but the cropped text prevents the black-and-white Kansas Map from serving as a polished neighboring-state reference without editing or careful cropping of the exterior area.
Blank Kansas Outline Map for Editing
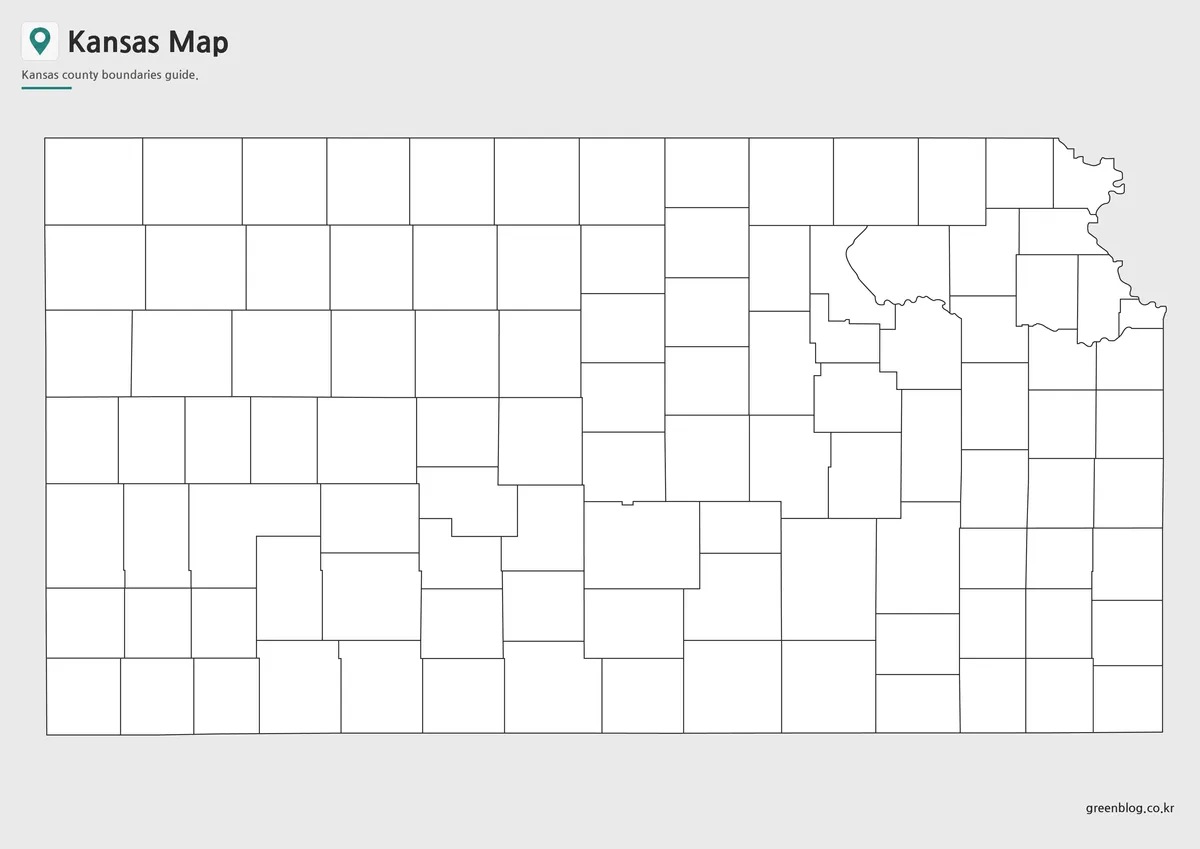
The blank version removes county and neighboring-state names along with all pastel fills. Its state silhouette, internal boundaries, title, and pin icon remain. This makes it appropriate for labeling practice, selected-county highlighting, thematic shading, or a slide that needs only a few custom symbols rather than 105 printed names.
A useful labeling strategy begins with the perimeter. Learners can identify the northwest and southwest corners, complete the north and south rows, and then use distinctive central and northeastern shapes to work inward. Keeping a labeled Kansas Map nearby provides a spelling check for names such as Pottawatomie, Chautauqua, McPherson, Neosho, and Kearny.
The outline can also support a focused comparison. Shade the four border sides differently, identify counties along the Colorado or Oklahoma lines, or mark only a selected route of counties for a classroom task. If statistical data is applied, use pale fills and a clearly labeled legend so the black county network remains the strongest visual structure.
This is a raster JPG, not a file of separately selectable vector polygons. Common graphics or document software can add text, shapes, and transparent overlays, but enlarging the image far beyond its native dimensions may soften the thinnest lines. Preserve an untouched master file and make annotations on a duplicate at the largest practical size.
Built for Classroom and Presentation Use
The three versions can form a simple progression from recognition to recall. Begin with the color map to establish the county pattern, move to the outline for labeling or grouping, and finish with the monochrome sheet as an answer reference. Because every line stays in the same position, learners can compare mistakes without mentally rotating or resizing a different map design.
For slides, reveal only the information needed at each stage. The full color image supports statewide orientation; the outline can isolate a handful of counties with custom highlights; the monochrome map fits a final summary. Avoid covering the compact northeast with a large legend or text box, since that is where the county shapes and callout labels require the most space.
County size should not be treated as a measure of population, economic weight, or importance. The artwork supplies geometry but no demographic evidence. A comparison of western and eastern counties can discuss visible area and shape, but any claim about residents, agriculture, income, or voting requires separate data with units, dates, and sources.
Practical Notes on Map Readability
A wide state with 105 labels needs horizontal room even though its outer outline looks simple. Preserve the landscape proportions and avoid squeezing the map into a sidebar. At smaller sizes, inspect Wyandotte and the Doniphan–Leavenworth area first, followed by compact central counties such as Geary and Edwards. Those names will reach the readability limit before labels centered in large western rectangles.
The missing Missouri label is another limitation shared by the labeled presentation. Missouri does border the entire eastern side shown here, but its name is absent from the artwork. When all four neighboring states matter, pair this county sheet with a broader central United States reference rather than suggesting that the omission reflects Kansas geography.
For annotation, keep legends beyond the county grid, choose fills light enough to preserve black boundaries, and reduce the number of symbols used at one time. These choices protect the set’s primary value: a consistent, readable view of all county divisions across one wide page.
Frequently Asked Questions
What is included in this Kansas Map collection?
The collection includes a color county map, a black and white labeled map, and a blank outline map. Each version is designed for printing, education, presentations, or editing work.
Can I print the Kansas Map in A3 size?
Yes. The files were prepared with A3 high-resolution printing in mind, making them suitable for classroom materials, reports, and presentation handouts.
Which Kansas Map version is best for classroom use?
The black and white map is usually the most practical for worksheets and printed handouts. The color map is better for slides or visual explanations.
Is the outline map editable?
Yes. The blank outline version can be used as a base map for adding colors, labels, county data, travel routes, or infographic elements.
Map File Information
Download three matching Kansas county maps for labeled reference, monochrome printing, or custom annotation.
- Included Versions: Labeled color / Labeled black and white / Blank outline
- Printable Size: A3
- File Type: JPG
- Intended Use: County study · Printing · Presentations · Annotation
Related Maps
Additional Resources
- Kansas Tourism Regions — The official tourism guide explains six travel regions that can be compared separately with the county framework.
Green Map creates custom-edited map images using open geographic data sources such as geoBoundaries, Natural Earth, OpenStreetMap, and government open data.
These maps are edited visual materials, not raw data files, and are provided for education, documents, presentations, and graphic reference.