An Ohio Map makes the state’s 88-county pattern easier to read than a simple state silhouette. This collection presents that pattern in three coordinated designs: a pastel color map with county names, a black-and-white labeled version, and an unlabeled boundary outline. The images also place Lake Erie above the state and identify Indiana, Kentucky, West Virginia, and Pennsylvania around the outer edge, giving readers immediate directional context.
The maps are intended for county reference rather than turn-by-turn navigation. They contain no road network, city markers, county-seat symbols, terrain shading, or scale bar. That narrower scope is valuable for teachers building identification exercises, students comparing neighboring counties, presenters discussing regional patterns, and designers who need a clean administrative base without unrelated detail.
Each Ohio Map uses the same county geometry, so a project can move from labeled reference to monochrome handout or blank activity without changing the underlying layout. The supplied download information identifies JPG and PNG image files in a ZIP archive and an A3 high-resolution layout. Because these are image resources rather than confirmed vector source files, users should choose an appropriate editing application and avoid assuming that every boundary is an independently selectable shape.
Table of Contents
Quick Overview of Included Files
The set separates three common tasks instead of trying to force them into one crowded graphic. The color image is the quickest reference when nearby county shapes must stand apart. The monochrome image keeps all county names while removing the pastel fills, and the blank image removes the names as well, leaving the state outline and internal county boundaries ready for custom marks.
- Pastel color county map with all county names
- Black-and-white county map with the same labels
- Blank state outline with internal county divisions
- A3-oriented, high-resolution image layout
- JPG and PNG files grouped in a ZIP download
The three body previews are all portrait-oriented and share the same framing. Labels outside the state help readers distinguish the Lake Erie shore from the Indiana and Pennsylvania sides, while the bending southern and southeastern edge remains visually different from the straighter western boundary. Keeping that framing consistent is especially helpful when two versions are placed side by side in a lesson or slide deck.
Understanding Ohio’s County Layout
Ohio has 88 counties, and their shapes create several recognizable map-reading zones. The northwest contains many compact, straight-edged units such as Williams, Fulton, Lucas, Defiance, Henry, and Wood. Along Lake Erie, the shoreline changes the upper edge of Lucas, Ottawa, Erie, Lorain, Cuyahoga, Lake, and Ashtabula counties, and the small island shapes near Ottawa County make that part of the outline particularly distinctive.
The center of the Ohio Map is anchored visually by Franklin County, with Delaware to its north, Licking to the east, Fairfield and Pickaway to the south, and Madison and Union to the west and northwest. This is a county-boundary observation, not a city map: Columbus is not marked in the artwork. Similarly, Hamilton appears in the southwest and Cuyahoga on the Lake Erie shore, but the corresponding cities and county seats are not labeled.
Eastern and southeastern counties meet a more irregular state edge. Jefferson, Belmont, Monroe, Washington, Meigs, Gallia, and Lawrence form part of the long border facing West Virginia, while the southern sequence continues toward Kentucky. Readers can therefore practice more than memorizing names: they can compare shoreline counties, interior neighbors, corner counties, and the counties that touch another state.
Color-Coded County Map
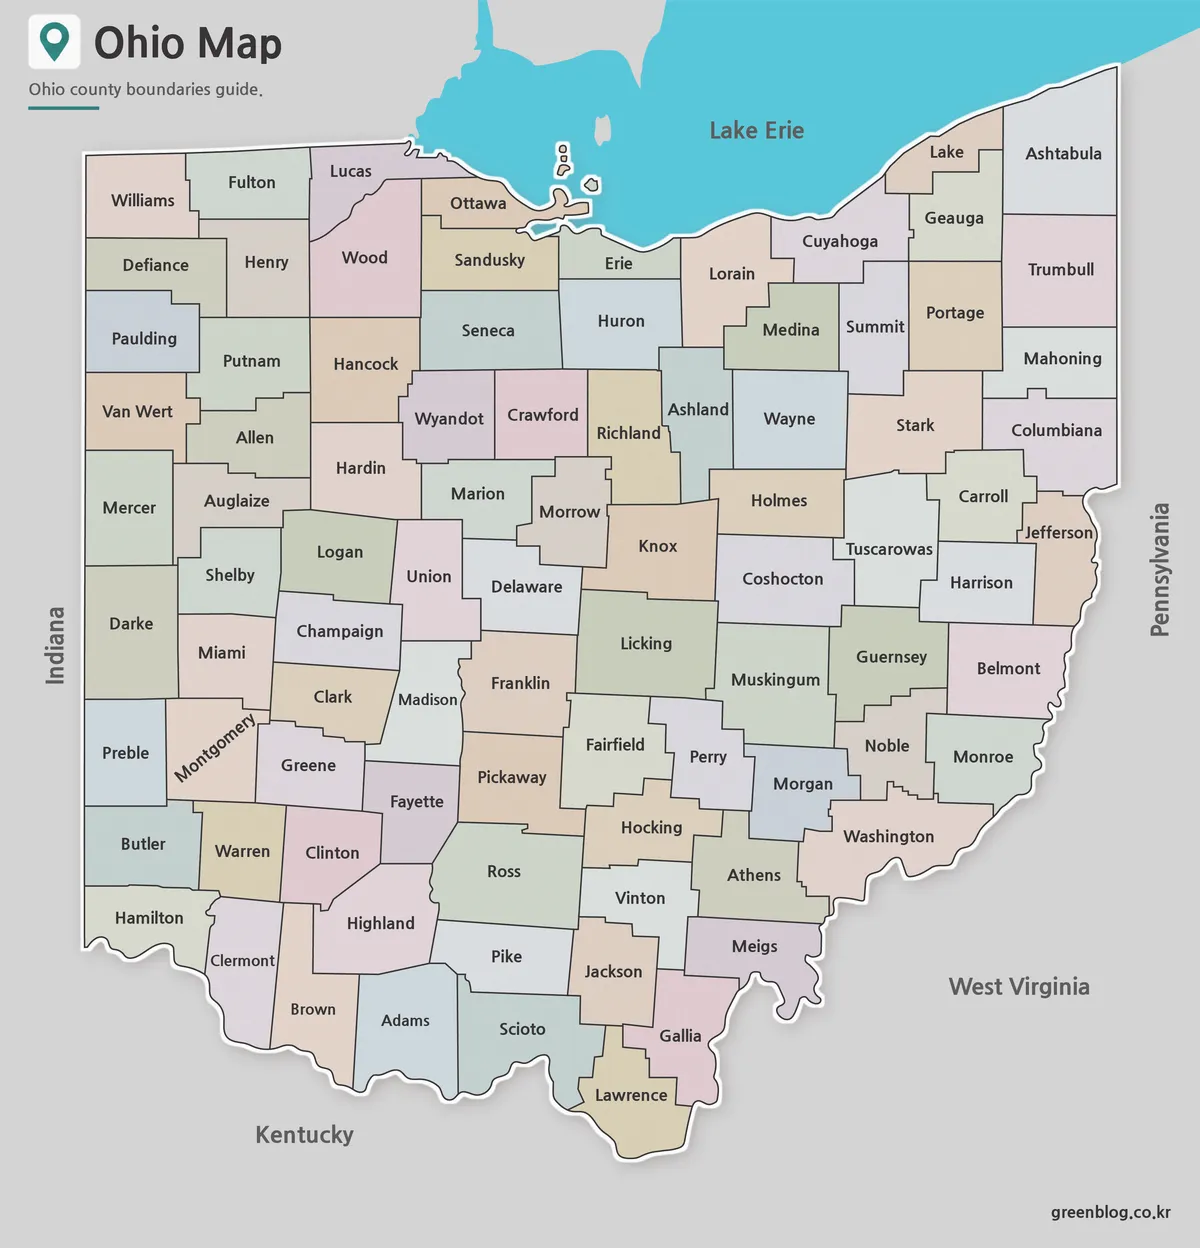
Soft alternating fills help adjacent counties separate without implying that the colors represent population, politics, elevation, or any other dataset. On the Ohio Map, this treatment is particularly effective where many labels cluster between the Lake Erie shore and the central counties. A viewer can trace Cuyahoga through Summit and Stark, or follow the western column from Williams toward Butler, without losing the boundary line in a field of identical white shapes.
Choose the color version when the finished map will be viewed on a screen, projected in a classroom, or used as a visual key beside a table. It also supports simple grouping exercises: a presenter can point to northern shore counties, the central ring around Franklin, or southeastern border counties while the printed names remain available. Since the palette is categorical decoration, readers should add a legend if they overlay any new data.
Black and White Labeled Version
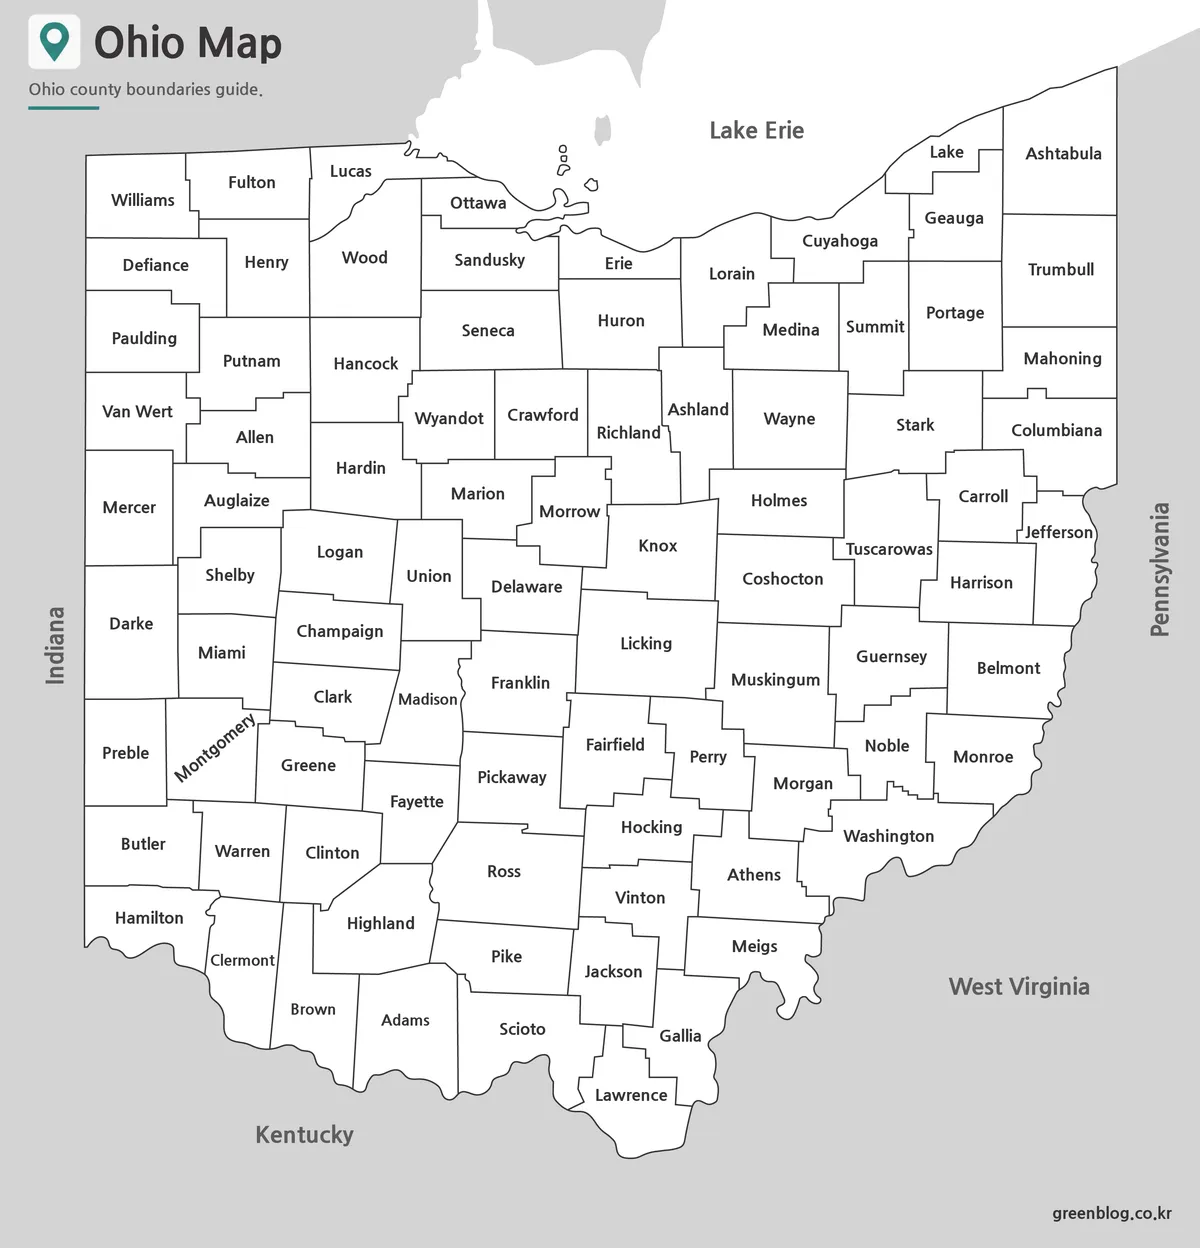
The labeled monochrome design puts typography and boundary lines ahead of visual grouping. Every county name remains present, from larger interior labels such as Franklin and Licking to compact northeastern labels such as Lake, Geauga, and Summit. This makes the black-and-white Ohio Map a practical reference for a report, study sheet, or photocopied handout where color is unnecessary.
Students can use it as an answer key beside the blank version, or annotate it with symbols while retaining the county names underneath. Before printing, check the preview at the intended scale: 88 labels must share one portrait page, so reducing the image far below its planned A3 layout can make the smallest names harder to read. A test page is also sensible if the printer adds wide margins or automatically crops to fill the paper.
Blank Outline Map for Editing
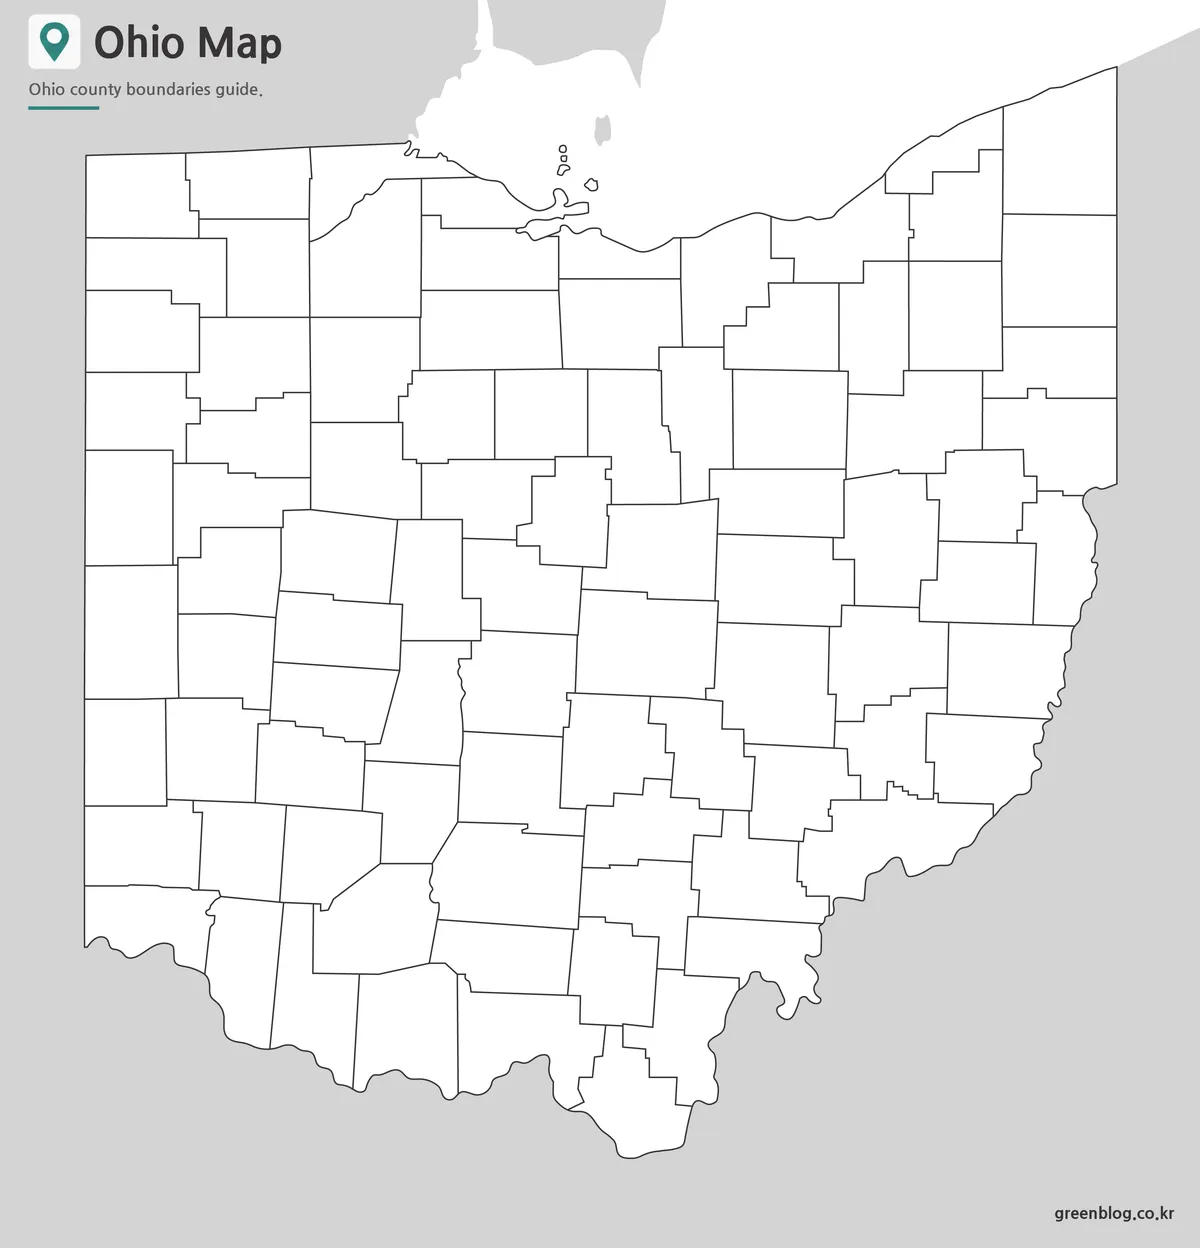
Removing both names and fills turns the county framework into an activity base. A teacher might ask learners to identify the seven shoreline counties named above, label Franklin and its neighbors, or shade counties that touch Indiana, Kentucky, West Virginia, or Pennsylvania. A researcher can instead apply a carefully sourced category scheme, while a trip planner can mark destinations without mistaking the base image for a road map.
The blank Ohio Map is also the better starting point when labels would compete with custom text. Add a legend, date, source note, and clear category definitions whenever the finished graphic presents data. Because the supplied resource is an image, repeated resizing and saving may soften thin lines; keeping an untouched master copy before editing helps preserve the county edges.
Practical Ways to Use This Ohio Map
Start with the reader’s task. Use color for fast visual orientation, monochrome with names for factual reference, and the blank outline for recall practice or custom annotation. When a project needs both an exercise and an answer sheet, print the blank and labeled editions at the same scale so county shapes line up from page to page.
For classroom work, divide the state into manageable prompts rather than asking students to place all 88 names at once. One group can study the Lake Erie edge, another can examine the straight western border, and another can follow the irregular southeastern boundary. Presentation designers can use the same regional sequence across successive slides, highlighting only the counties discussed while leaving the underlying divisions consistent.
For print production, preserve the image’s aspect ratio and use the portrait page orientation. Do not stretch the artwork to fit a landscape box, because that distorts county shapes and makes cross-version comparisons less reliable. If the page will be reduced from A3, prioritize the labeled monochrome map as a reference and use the blank outline only when there is enough room for handwritten or digital additions.
Frequently Asked Questions
Can I print the Ohio Map in A3 size?
Yes. The maps were prepared in high resolution and reviewed for large-format printing.
Does the Ohio Map include county boundaries?
Yes. Both the color and black and white versions display county boundaries.
Is the outline version editable?
Yes. The blank version works well for annotations, graphic editing, and custom map projects.
Which version is best for classroom use?
The color version is often preferred for teaching, while the black and white version works well for worksheets and printed handouts.
Map File Information
Download the color labeled, black-and-white labeled, and blank county-boundary versions for reference, teaching, presentation, or annotation.
- Included Versions: Color labeled, black-and-white labeled, and blank outline maps
- Printable Size: A3 High Resolution
- File Type: JPG / PNG / ZIP
- Intended Use: County reference, worksheets, slides, and custom notes
Related Maps
Additional Resources
- Ohio Secretary of State County Roster – Review Ohio county names, county seats, and official local-government links.
Green Map creates custom-edited map images using open geographic data sources such as geoBoundaries, Natural Earth, OpenStreetMap, and government open data.
These maps are edited visual materials, not raw data files, and are provided for education, documents, presentations, and graphic reference.