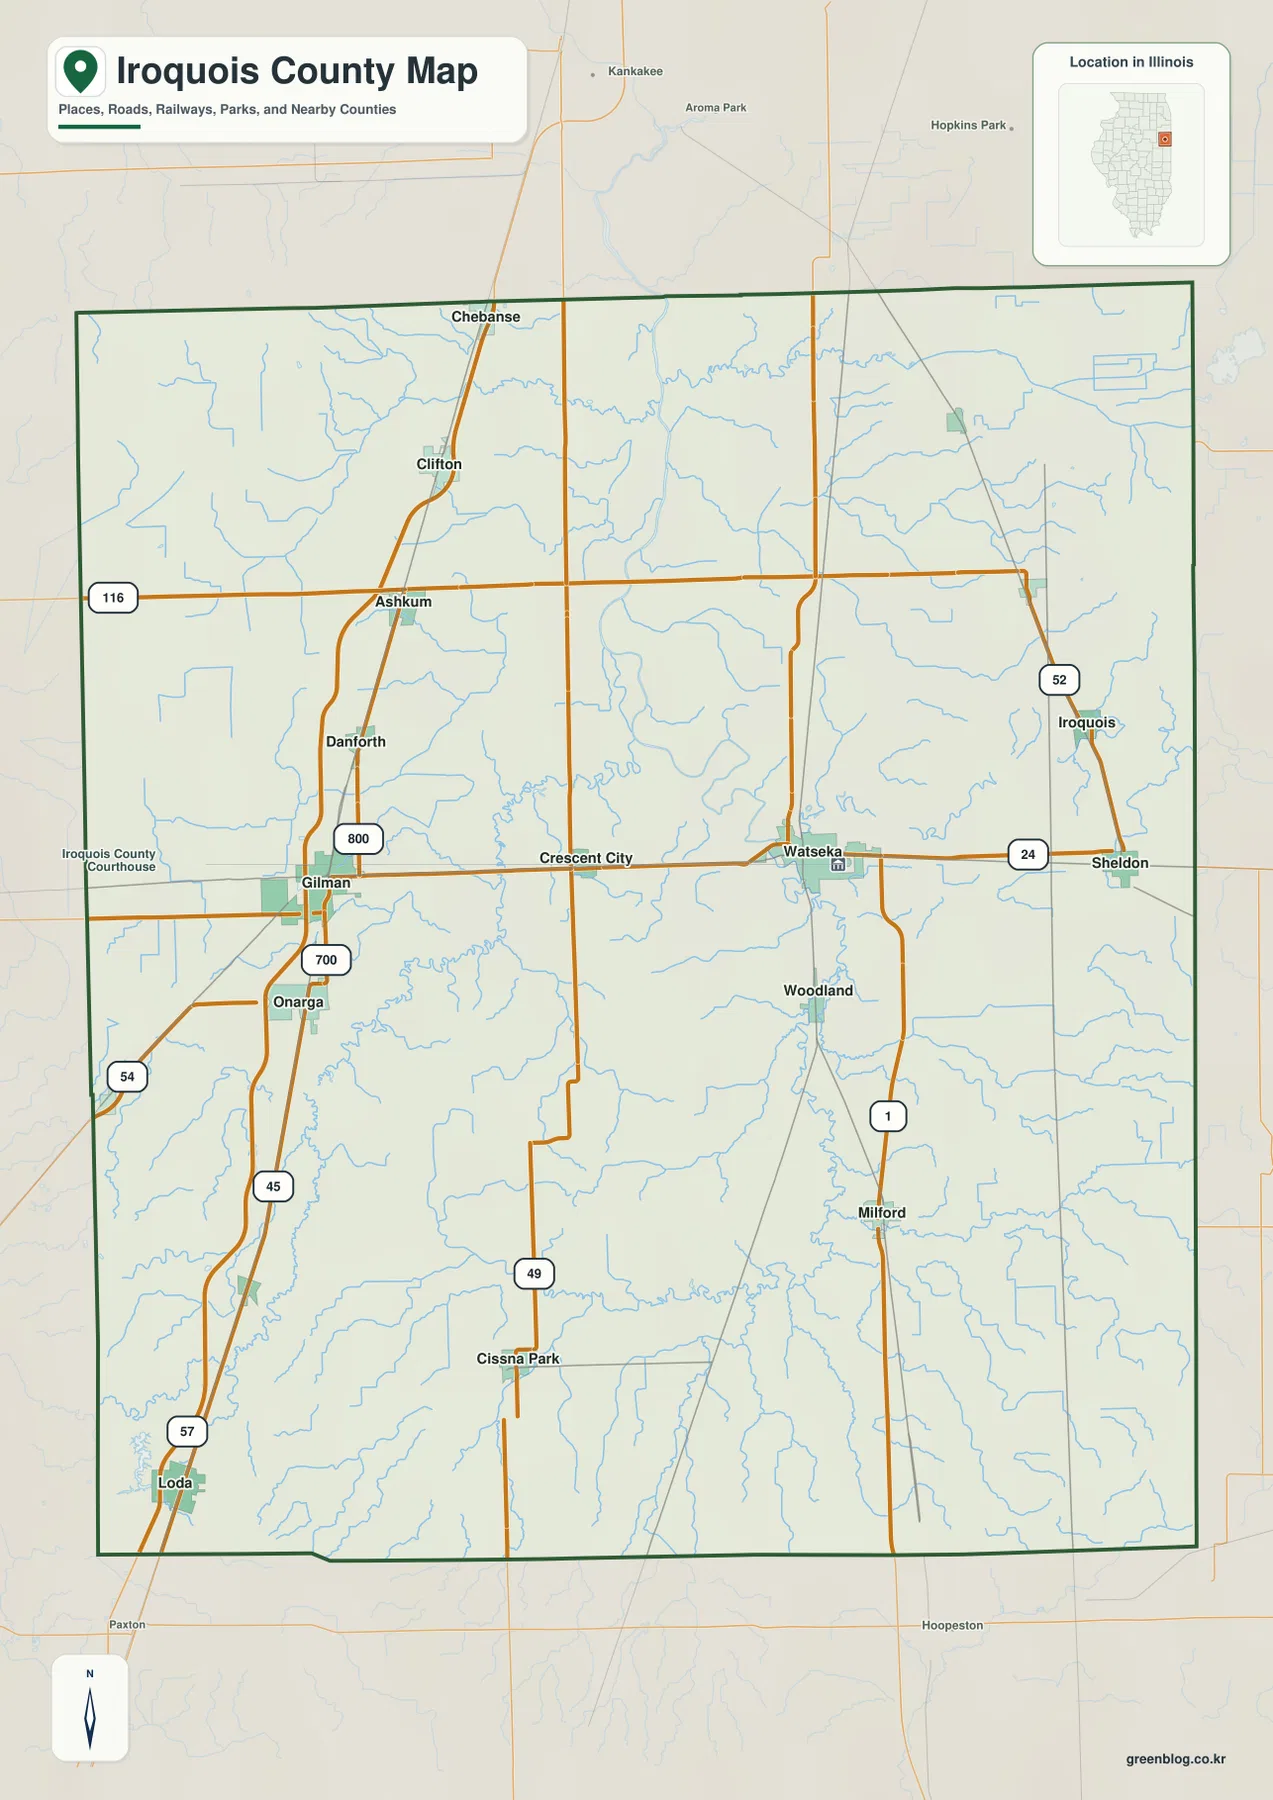
The Iroquois County download package groups the four full-size JPG files used on this page. Route 24 links Watseka and Gilman across the middle, I-57 passes Clifton, Ashkum, Gilman, Onarga, and Loda on the west, and Route 1 continues south from Watseka toward Milford. The companion files add the six-point CITY INDEX, the Iroquois River drainage, and relief labeled from 166 to 249 meters.
North and south are far enough apart here that one reference town is not enough. Clifton and Ashkum mark the upper I-57 corridor, Watseka and Gilman define the middle, and Onarga, Cissna Park, Loda, and Milford help locate the lower half. The drainage and relief files then show why the Watseka–Gilman belt looks lower than several outer margins.
Table of Contents
Watseka and Gilman anchor two different road corridors
Watseka is the clearest reference point on the eastern half of the general map. Route 24 runs west from Sheldon through Watseka and Crescent City toward Gilman, while Route 1 continues south from the Watseka area through Woodland toward Milford. US 52 appears along the eastern side near the community labeled Iroquois. Taken together, these roads establish a strong east–west line through the county center and a separate north–south route near the Indiana side.
The western half is organized around I-57. The interstate passes Clifton, Ashkum, Gilman, Onarga, and Loda, creating a nearly continuous north–south reference through the county. Gilman stands out because the interstate corridor meets the central east–west road system there. Route 49 forms another north–south line farther east of the interstate and continues toward Cissna Park in the southern half.
Route 116 crosses the upper part of the county near Ashkum, and the map shows numerous smaller roads branching into rural areas between the major towns. The northeastern quarter has fewer large settlement labels, but the roads and drainage lines remain dense. The county’s official website places Iroquois County between Kankakee County to the north, Indiana to the east, Vermilion County to the south, and Ford County to the west, with Watseka serving as the county seat.
The same official county page describes Iroquois County as roughly 35 miles long and 32 miles wide, containing about 1,120 square miles. That scale helps explain why the county map needs several reference towns rather than one dominant center. Watseka is useful for the eastern half, Gilman for the I-57 corridor, and Clifton, Onarga, Milford, and Cissna Park help the reader keep track of the long north–south extent.
Six ranked communities from Clifton to Milford
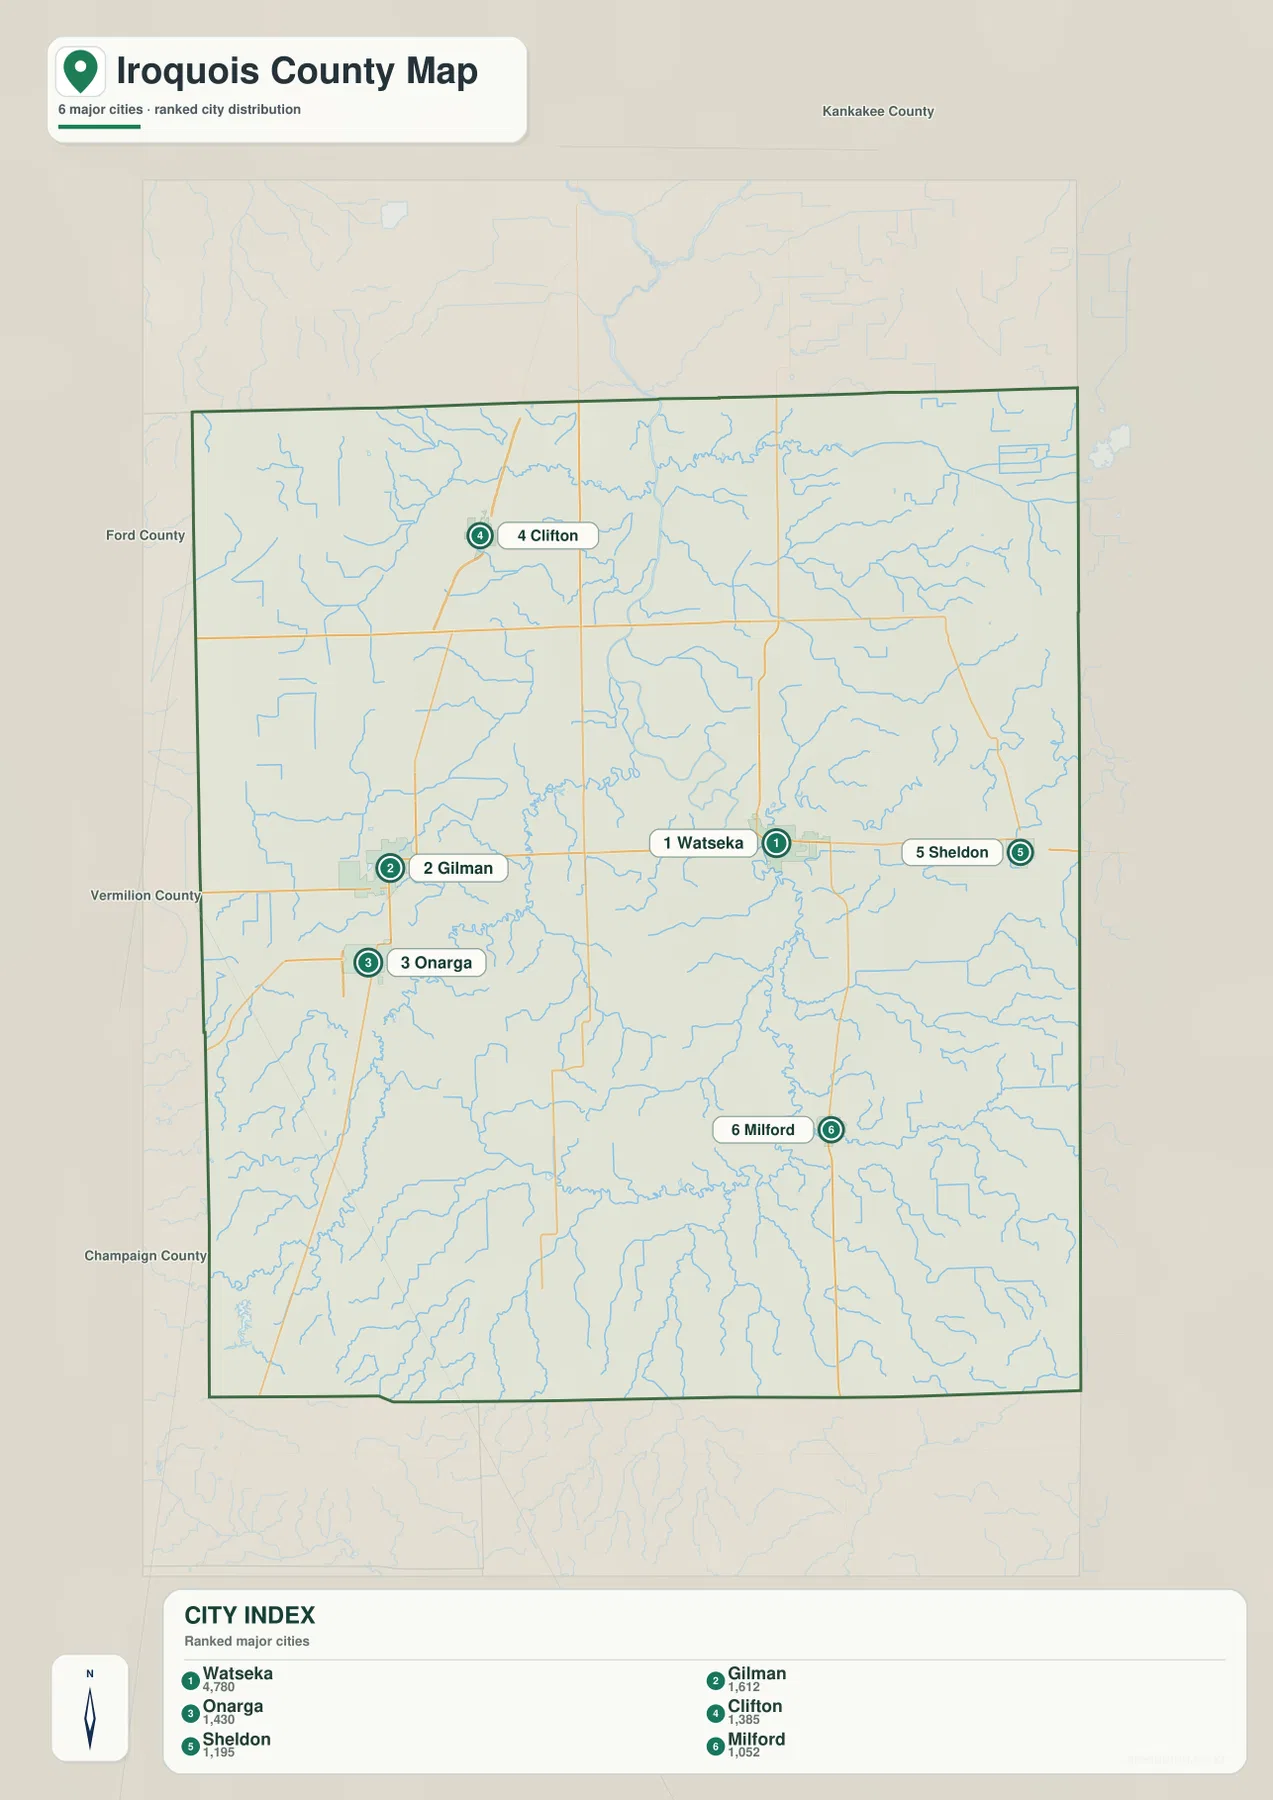
The ranked-city map selects six communities and assigns each one a position in the supplied CITY INDEX. Watseka is first at 4,780, Gilman is second at 1,612, and Onarga is third at 1,430. Clifton follows at 1,385, Sheldon at 1,195, and Milford at 1,052. These are the values printed on the provided map and are used here only to explain that ranking; they should not be presented as current official Census population estimates.
The locations are spread across much of the county. Watseka lies east of center, Gilman and Onarga are on the western side of the middle and lower-middle sections, and Clifton sits well to the north. Sheldon is close to the eastern boundary, while Milford occupies the southeast. Because the six points are not clustered in one corner, the map works well for seeing how the larger selected communities are distributed through the county.
Neighboring county labels add useful orientation. Kankakee County appears to the north, Ford County to the west, and Champaign and Vermilion counties appear along the southwestern and southern surroundings. The eastern boundary is the Indiana state line. Smaller communities such as Ashkum, Crescent City, Woodland, Cissna Park, and Loda are easier to locate on the general county map because the ranked layer intentionally removes many secondary labels.
Watseka’s administrative role should be kept separate from the CITY INDEX ranking. The official county website identifies Watseka as the county seat, while the ranked-city map simply compares the six selected communities using its printed values. That distinction matters when the map is used in a classroom or report: the ranking is a visualization choice, not an administrative hierarchy.
The Iroquois River links central creeks and low ground
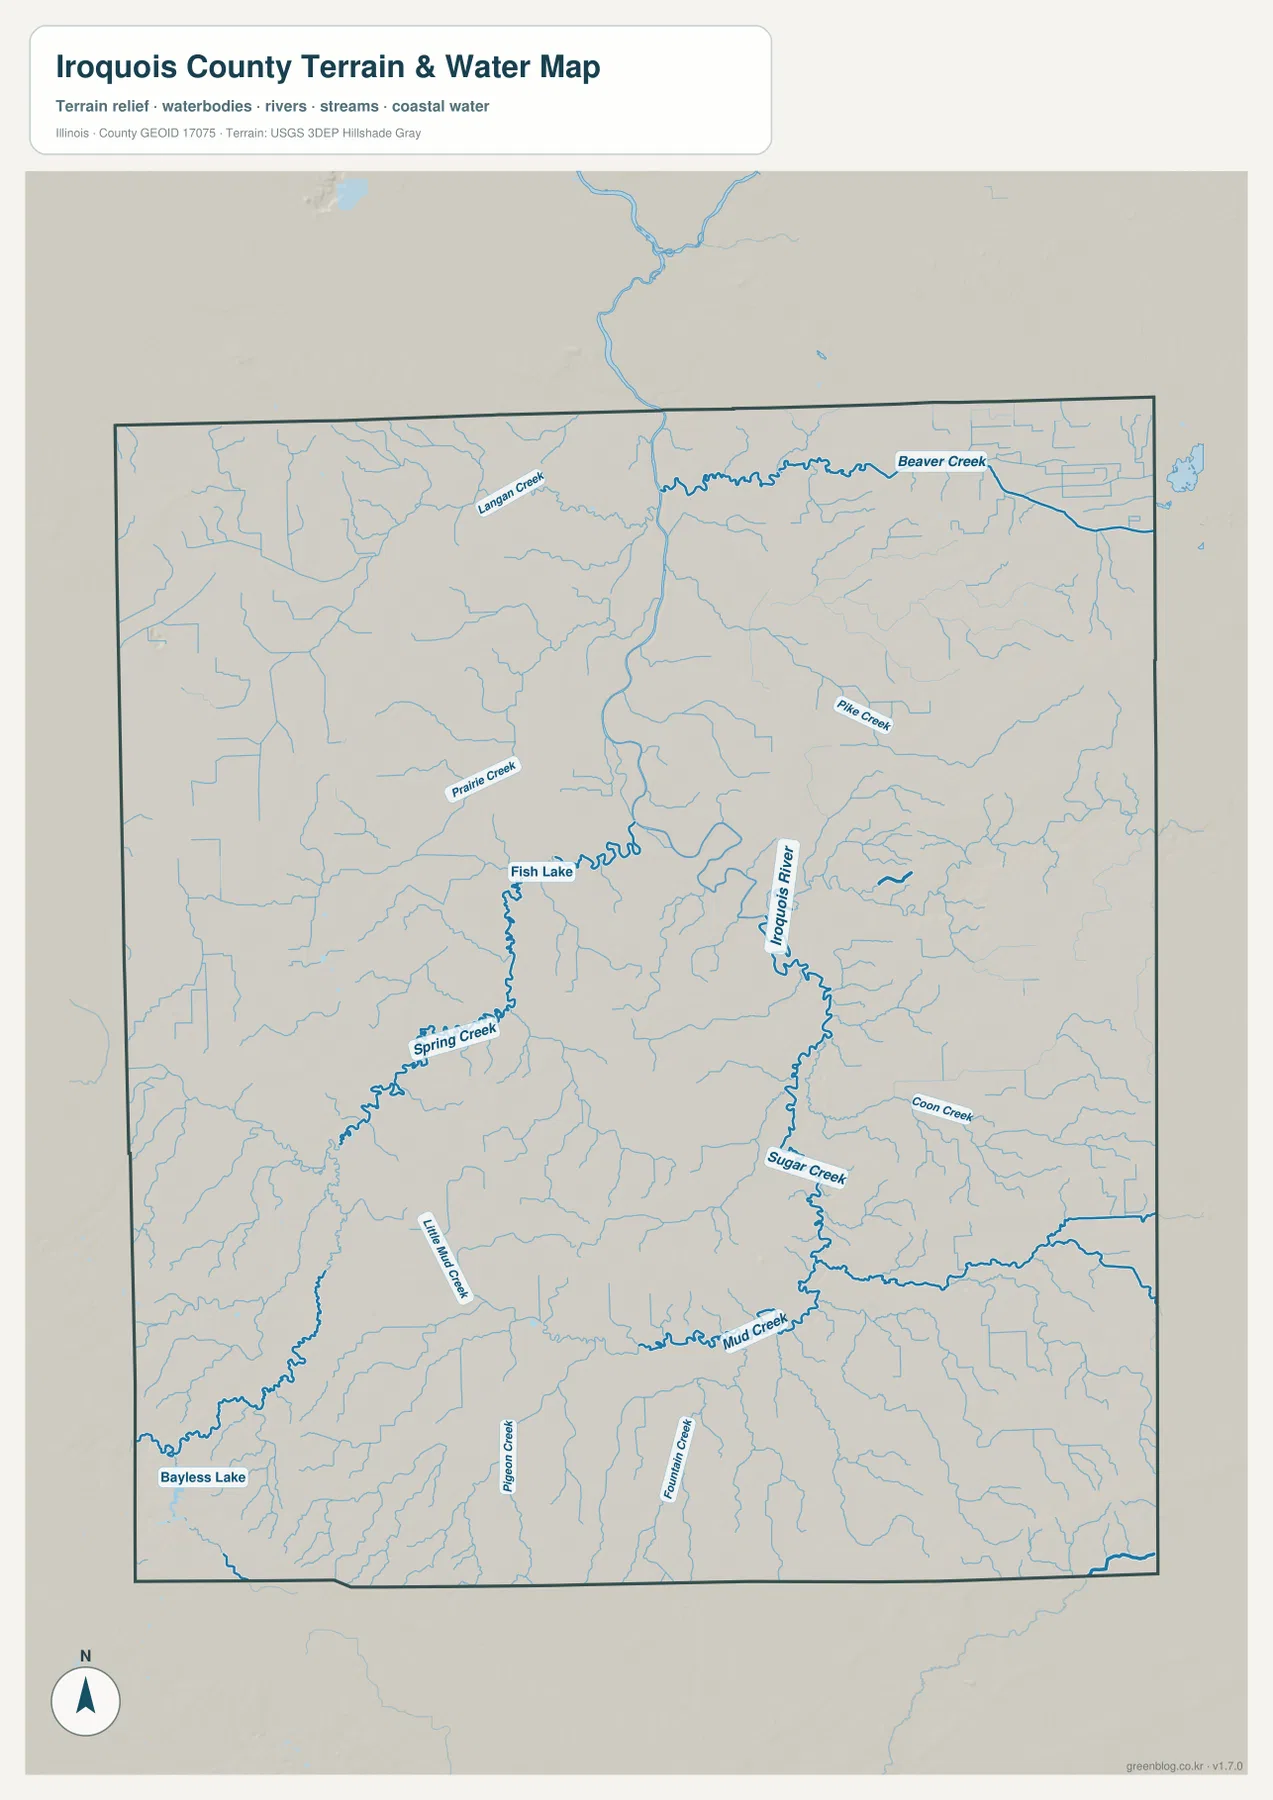
The terrain-and-water map makes the Iroquois River the central hydrologic reference. It enters from the north-central side, continues through the middle and eastern part of the county, and is joined by numerous tributaries. Beaver Creek runs across the northeast, with Pike Creek farther south. These named channels provide an easy way to orient the less densely settled northeastern quarter.
West of the river, Prairie Creek and Fish Lake appear near the central part of the county, while Spring Creek runs southwest from that area. Coon Creek and Sugar Creek approach the Iroquois River from the east, and Mud Creek becomes a strong southern reference. Little Mud Creek and Bayless Lake are labeled in the southwest, with Pigeon Creek and Fountain Creek appearing farther south and southeast.
The Illinois Department of Natural Resources provides additional context for the far northeastern corner of the county. Its Iroquois County State Wildlife Area page describes a low glacial outwash plain associated with the Kankakee River Valley, including marshland, sand ridges, and dunes. The site is near Beaverville in the extreme northeast. That official description is useful background, but the downloadable county maps are not park-boundary or recreation maps and should not be used to infer trails, hunting zones, or access rules.
On the hydrology file, the blue lines should be read as locations rather than live conditions. Iroquois River, Beaver Creek, Sugar Creek, Mud Creek, Fish Lake, and the smaller tributaries are positioned relative to one another, but the file carries no flood probability, current stage, levee condition, water-quality reading, ownership line, or boating-access status. Current USGS and local-agency information is required for safety decisions.
A 166–249 meter county range reveals a low central corridor
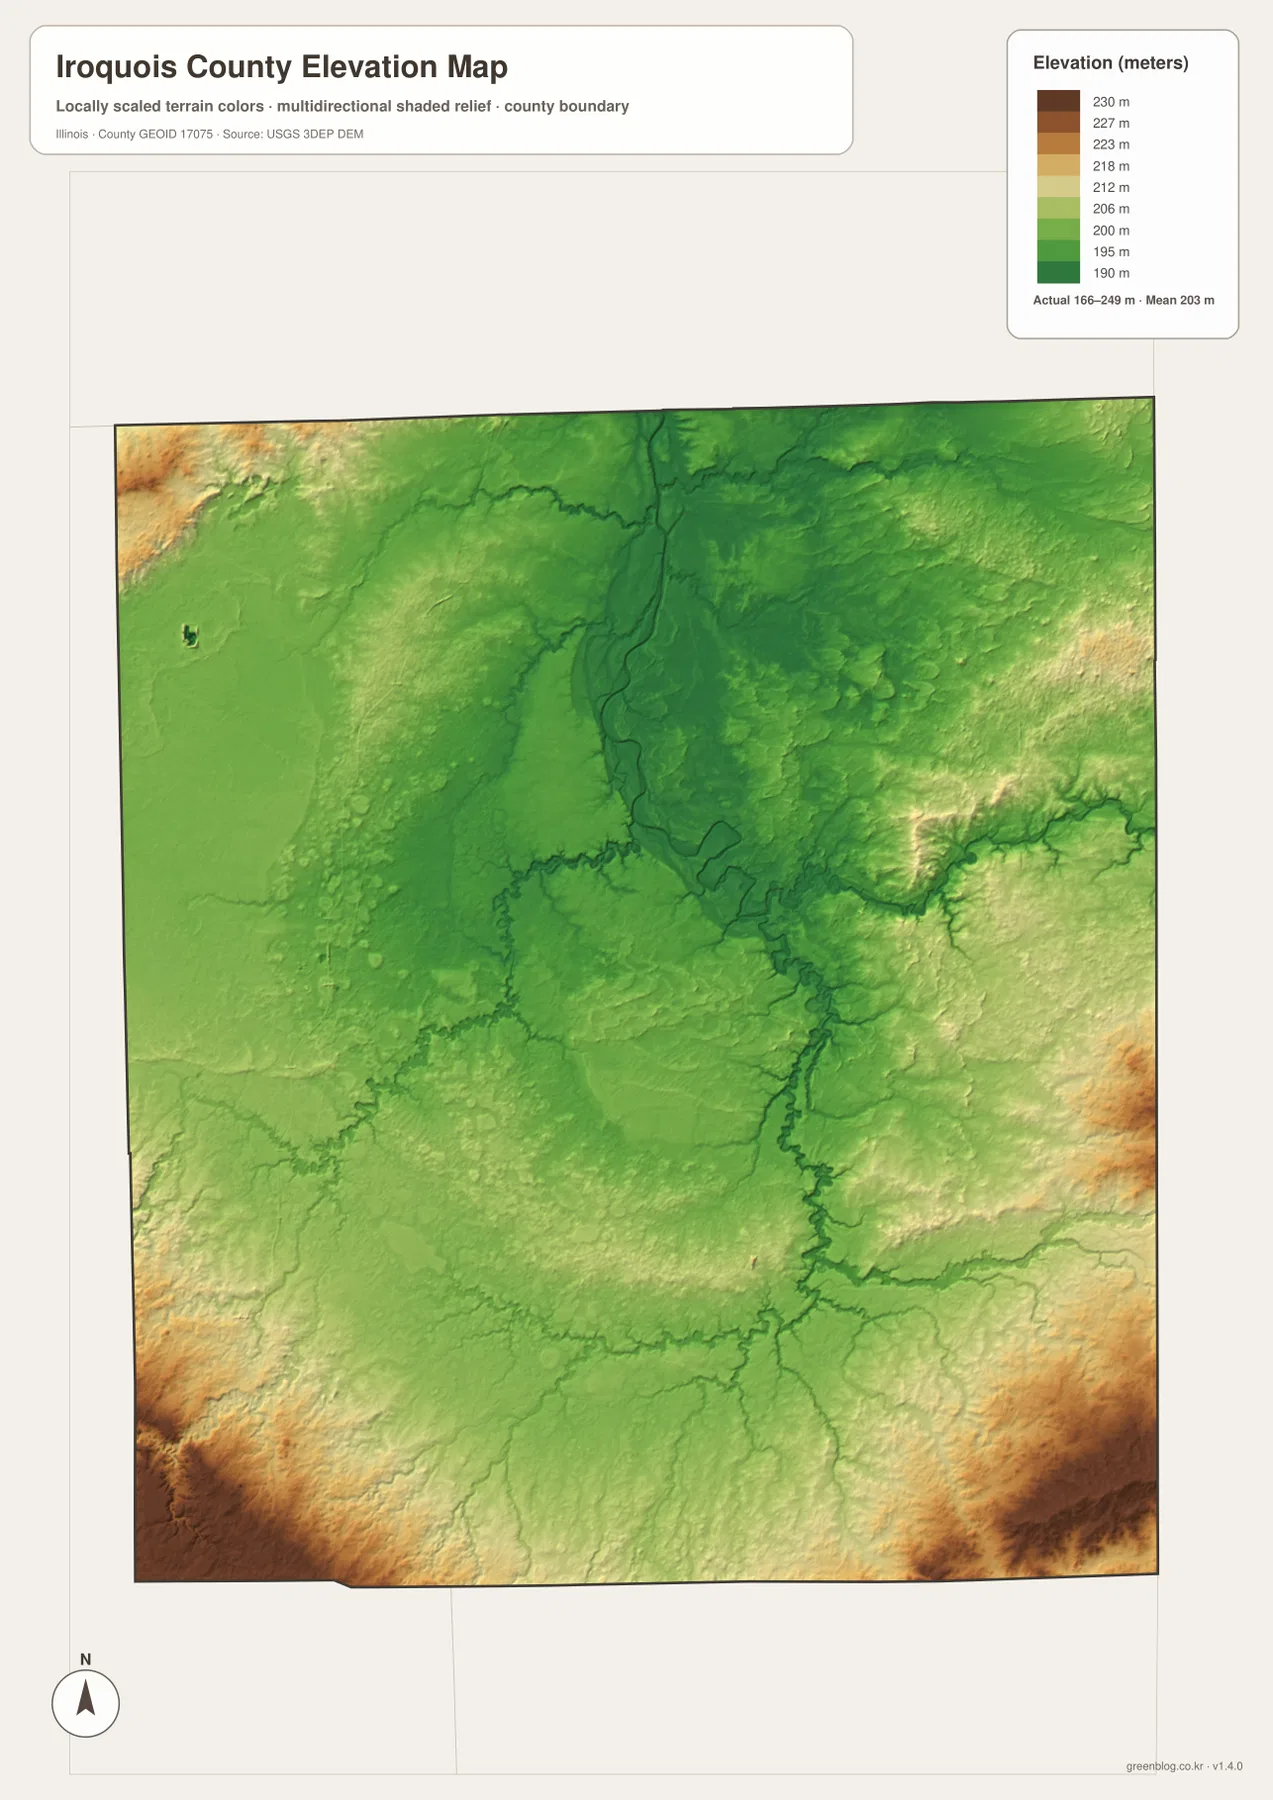
The elevation map prints an actual range of 166 to 249 meters and a mean of 203 meters. Its displayed color scale runs from roughly 190 to 230 meters. The broad central and north-central parts of the county are dominated by darker green tones, and lower green corridors follow the main river valleys. The Iroquois River can be traced indirectly through this lower terrain even when the water labels are removed.
Higher ground is more obvious near several outer edges. Brown and tan colors appear in the northwest corner and again along portions of the southwest and southeast margins. The southeastern section in particular shows strong relief next to lower stream valleys, while the east-central area contains smaller ridges and cuts. This pattern makes the county more varied than a completely flat plain, even though large areas remain gently rolling.
The 166–249 meter relief surface separates broad low ground from higher margins; it does not certify the height of a parcel, road centerline, building pad, or field corner. Road grades, drainage design, and construction work require original elevation data and field measurement, with USGS 3DEP serving as the appropriate source for more precise elevation information.
Watseka and Gilman sit within the broad lower central belt, whereas warmer elevation colors return near the northwest edge and around parts of the southern margin. Milford provides a particularly clear southern example because Route 1 leads into an area where creek valleys cut through higher surrounding ground. Matching the road labels to those colors makes the county’s relief differences concrete.
Watseka connects road, river, and county context
Watseka is the one place that ties all four files together cleanly. Route 24 and Route 1 meet there on the road view, the Iroquois River drainage surrounds the same area on the water file, and the relief surface keeps Watseka within the lower central zone. Holding that town fixed while switching files prevents the county’s long north–south shape from becoming disorienting.
Gilman provides a similar reference on the western side. It sits on the I-57 corridor and the central east–west route system, while nearby water features include the Fish Lake and Prairie Creek area. Milford works well as a southern reference because Route 1 leads directly toward it and the relief map shows stronger differences between stream corridors and higher ground nearby.
IDNR’s Iroquois County State Wildlife Area page gives the northeast corner a specific landscape explanation: marsh, prairie, sand ridges, and dune environments near Beaverville. Those features come from the official wildlife-area source, not from labels on the four downloadable maps, so entrances, property boundaries, trails, and regulations should be checked on current IDNR material.
Road, river, or relief: which Iroquois County file fits the question?
For a road question, begin with Watseka, Gilman, Onarga, Clifton, Milford, I-57, Route 24, and Route 1 on the general file. The CITY INDEX version is cleaner when the task is limited to Watseka, Gilman, Onarga, Clifton, Sheldon, and Milford because it removes many secondary settlement and road labels.
For drainage, trace the Iroquois River first and then branch to Beaver Creek, Spring Creek, Sugar Creek, Mud Creek, Fish Lake, or Bayless Lake. For terrain, the relief file quickly separates the lower central belt from the higher northwest, southwest, and southeast margins. Many stream courses line up with darker green valleys, making the water and elevation files especially useful as a pair.
The embedded WebP images keep the page light, but the original 2572 × 3638 pixel JPGs give small road numbers and creek labels more room. They fit printed handouts, slide decks, county-comparison sheets, or close label reading; keeping the original aspect ratio prevents the county outline and symbols from being stretched.
Legal boundaries, parcels, flood studies, navigation, and engineering require different source products. Census TIGER/Line supplies official geographic reference data, USGS National Hydrography supplies source water information, and USGS 3DEP supplies elevation data. The four files here are designed for orientation and comparison, not regulated or precision work.
Full-size JPG files for Watseka, I-57, waterways, and relief
Inside the ZIP are the general county file, CITY INDEX file, terrain-and-water file, and elevation file at their original JPG dimensions. Opening them separately provides more space for small labels than the WebP copies above, and placing them side by side makes it easier to compare one road, creek, or town against the relief surface.
Frequently Asked Questions
Do the CITY INDEX numbers equal the latest official population estimates?
No. They are the values printed on the supplied ranked layer: Watseka 4,780, Gilman 1,612, Onarga 1,430, Clifton 1,385, Sheldon 1,195, and Milford 1,052. They explain this map’s ordering only. Current official population figures should be taken from the U.S. Census Bureau.
Where is the Iroquois County State Wildlife Area in relation to these maps?
The park name and boundary are not drawn on the four supplied images. IDNR places the wildlife area near Beaverville in the extreme northeast and describes marsh, prairie, sand-ridge, and dune habitat there. Current IDNR maps are needed for entrances, property boundaries, hunting regulations, and other site details.
Is the 166–249 meter relief file accurate enough for a survey?
No. The relief surface shows county-wide high and low areas, not certified point elevations. A parcel survey, road grade, building elevation, or drainage design requires original elevation data and professional measurement rather than a color readout from this JPG.
Map File Information
The archive contains the Iroquois County general map, CITY INDEX map, terrain-and-water map, and elevation map as high-resolution JPG files.
- Included Files: 4 JPG maps
- Printable Size: 2572 × 3638 pixels each
Related Maps
Sources and references
- Iroquois County, Illinois – Official Website: official county information on size, surrounding boundaries, and Watseka as the county seat
- Illinois DNR – Iroquois County State Wildlife Area: official information on the northeastern wildlife area, marshes, sand ridges, dunes, and public site context
- U.S. Census Bureau TIGER/Line Shapefiles: authoritative geographic boundary and feature reference data
- USGS National Hydrography: source data and documentation for rivers, streams, lakes, and related water features
- USGS 3D Elevation Program: source information for higher-precision elevation data
Green Map creates custom-edited map images using open geographic data sources such as geoBoundaries, Natural Earth, OpenStreetMap, and government open data.
These maps are edited visual materials, not raw data files, and are provided for education, documents, presentations, and graphic reference.