You can download four high-resolution JPG maps of Harding County, South Dakota from this page in one ZIP file. The article also provides lighter WebP previews for quick viewing: a road-and-place county map, a simplified city distribution map, a terrain and water map, and an elevation map. Together they make it easier to locate Buffalo and Camp Crook, follow the Little Missouri River and the larger Grand and Moreau drainage branches, and compare a county-wide elevation range of roughly 781 to 1,224 meters.
Harding County occupies the far northwestern corner of South Dakota. The state boundary statute places North Dakota along the north and follows the Montana and Wyoming state lines on the west, giving this county a geographic setting unlike most of the state’s interior counties. Buffalo is the strongest settlement reference on the supplied maps, while the water and elevation views show why roads and named places sit within a landscape broken by long valleys, scattered high ridges, and several major stream systems.
Table of Contents
Buffalo, numbered roads, and the shape of Harding County
The detailed county map places Buffalo slightly west of the center of the county and shows several numbered roads converging near it. Shields labeled 6, 20, 79, 797, and 796 help orient the central and southern parts of the map, while 85, 858, 859, 733, and other numbered routes appear farther north. The map is useful for seeing direction and road density, but it should not be treated as a live navigation service. Road names, closures, surface conditions, and turn-by-turn travel should be checked with a current transportation source.
Several smaller place names add orientation beyond Buffalo. Ralph appears in the northeastern part of the map, while Gustave is shown toward the southwest and Prairie City appears in the eastern background. These labels are useful because Harding County covers a large rural area where a single town name does not explain the whole county. Following the bold county outline first helps distinguish features inside the county from roads and labels that continue into the surrounding background.
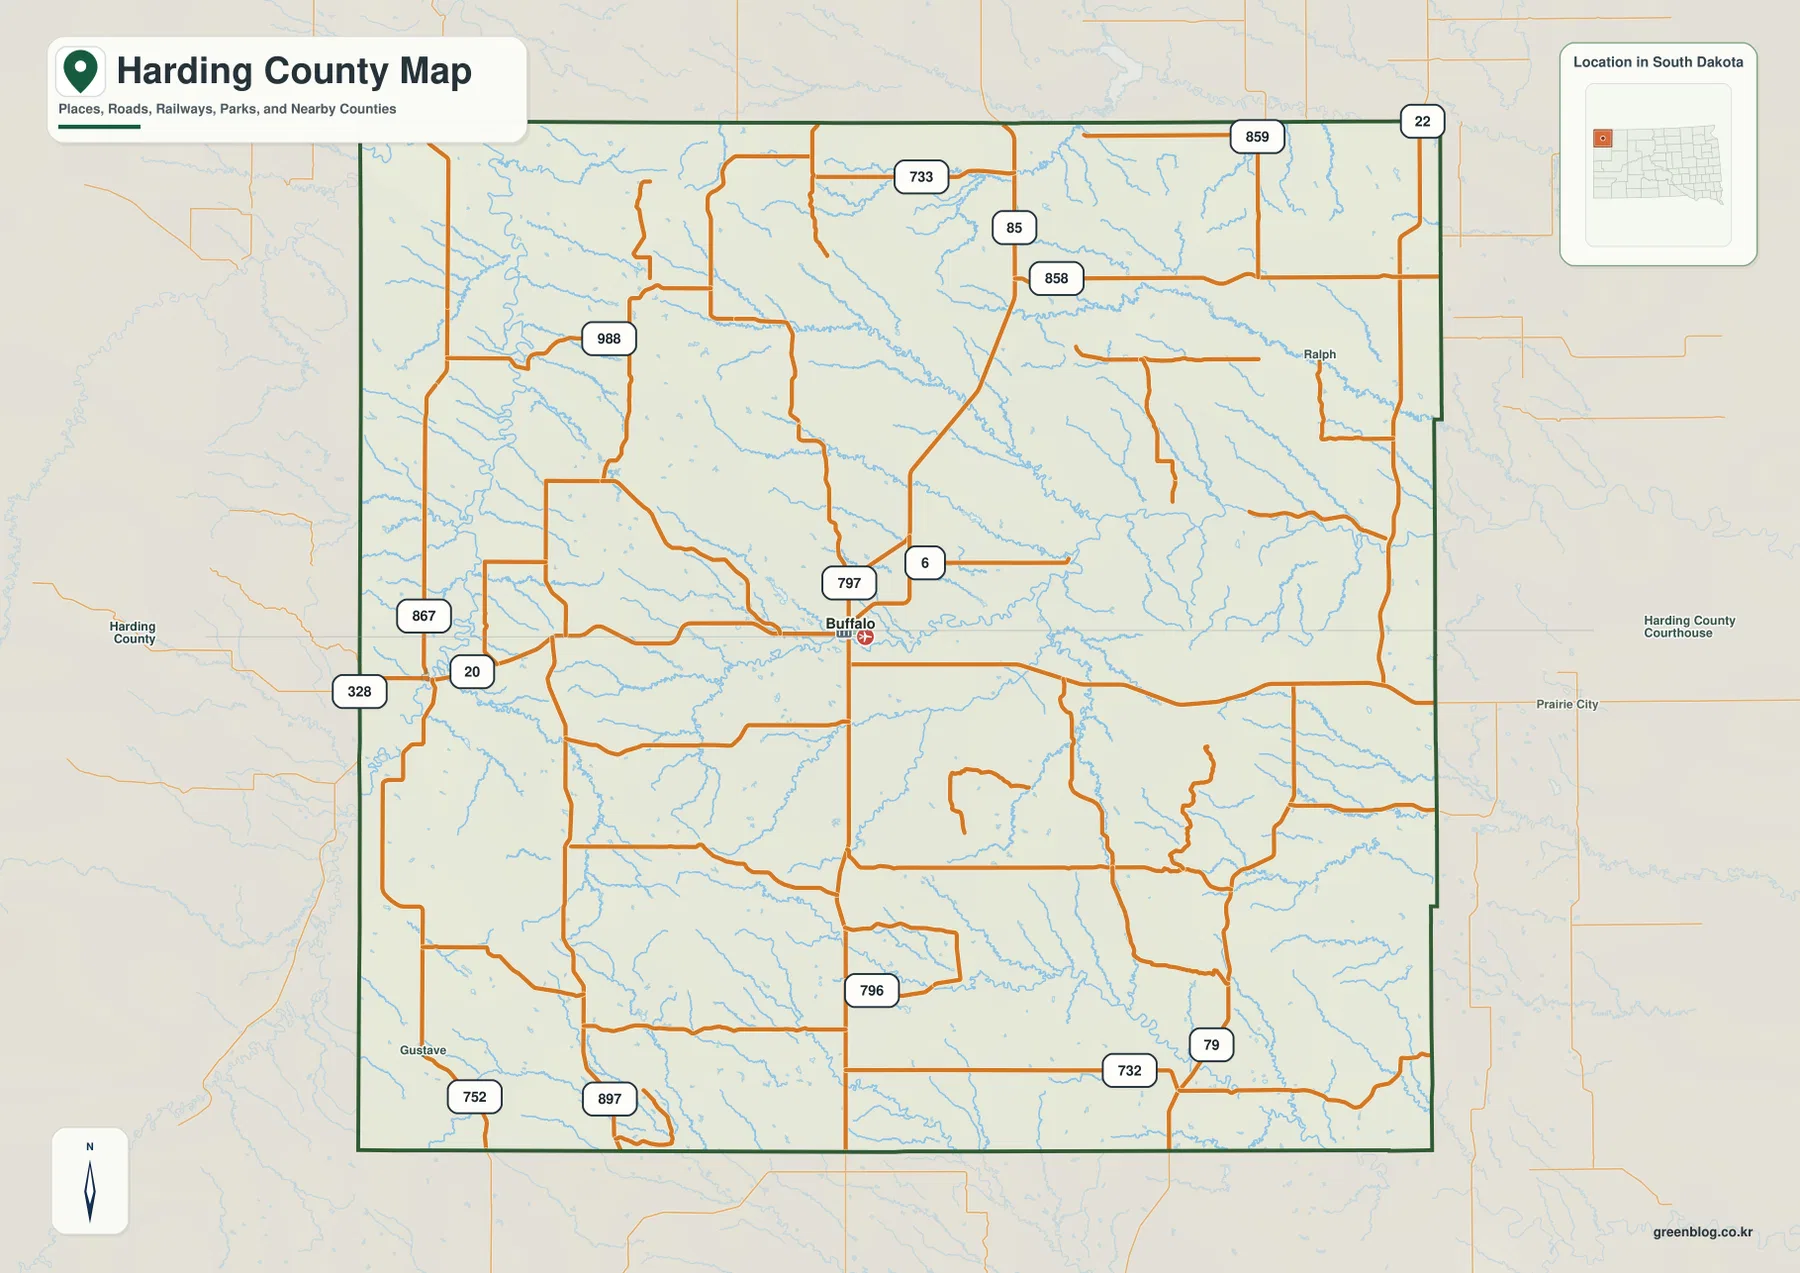
The outside boundary matters more here than on many inland county maps. Harding County sits against state lines, and the South Dakota statute provides the legal framework for that northern and western edge. The supplied image is still a general reference map rather than a legal survey. It is appropriate for geographic orientation, presentations, and learning where roads and communities lie, but property, parcel, and legal-boundary questions require the relevant official records and survey documents.
Buffalo is also a practical anchor for comparing the other three maps. Once its position is familiar on the road map, the viewer can look west toward the Little Missouri River system, south toward the Moreau forks, or north toward the broken drainage and isolated high ground. This approach is more useful than trying to memorize every road number at once.
A two-place city view: Buffalo and Camp Crook
The city distribution map intentionally removes most of the road detail and highlights only two major place references. Buffalo is ranked first and sits near the middle of the county, while Camp Crook is ranked second and lies near the western side. The simplified design is useful when the goal is simply to remember which place is central and which one is farther west before returning to the busier road map.
Unlike some city-connection maps in this county series, this image does not draw connector lines or print mile values between Buffalo and Camp Crook. No straight-line or driving distance should be inferred from it. Use the map for relative position only, and use current road data when actual mileage, travel time, or route choice matters.
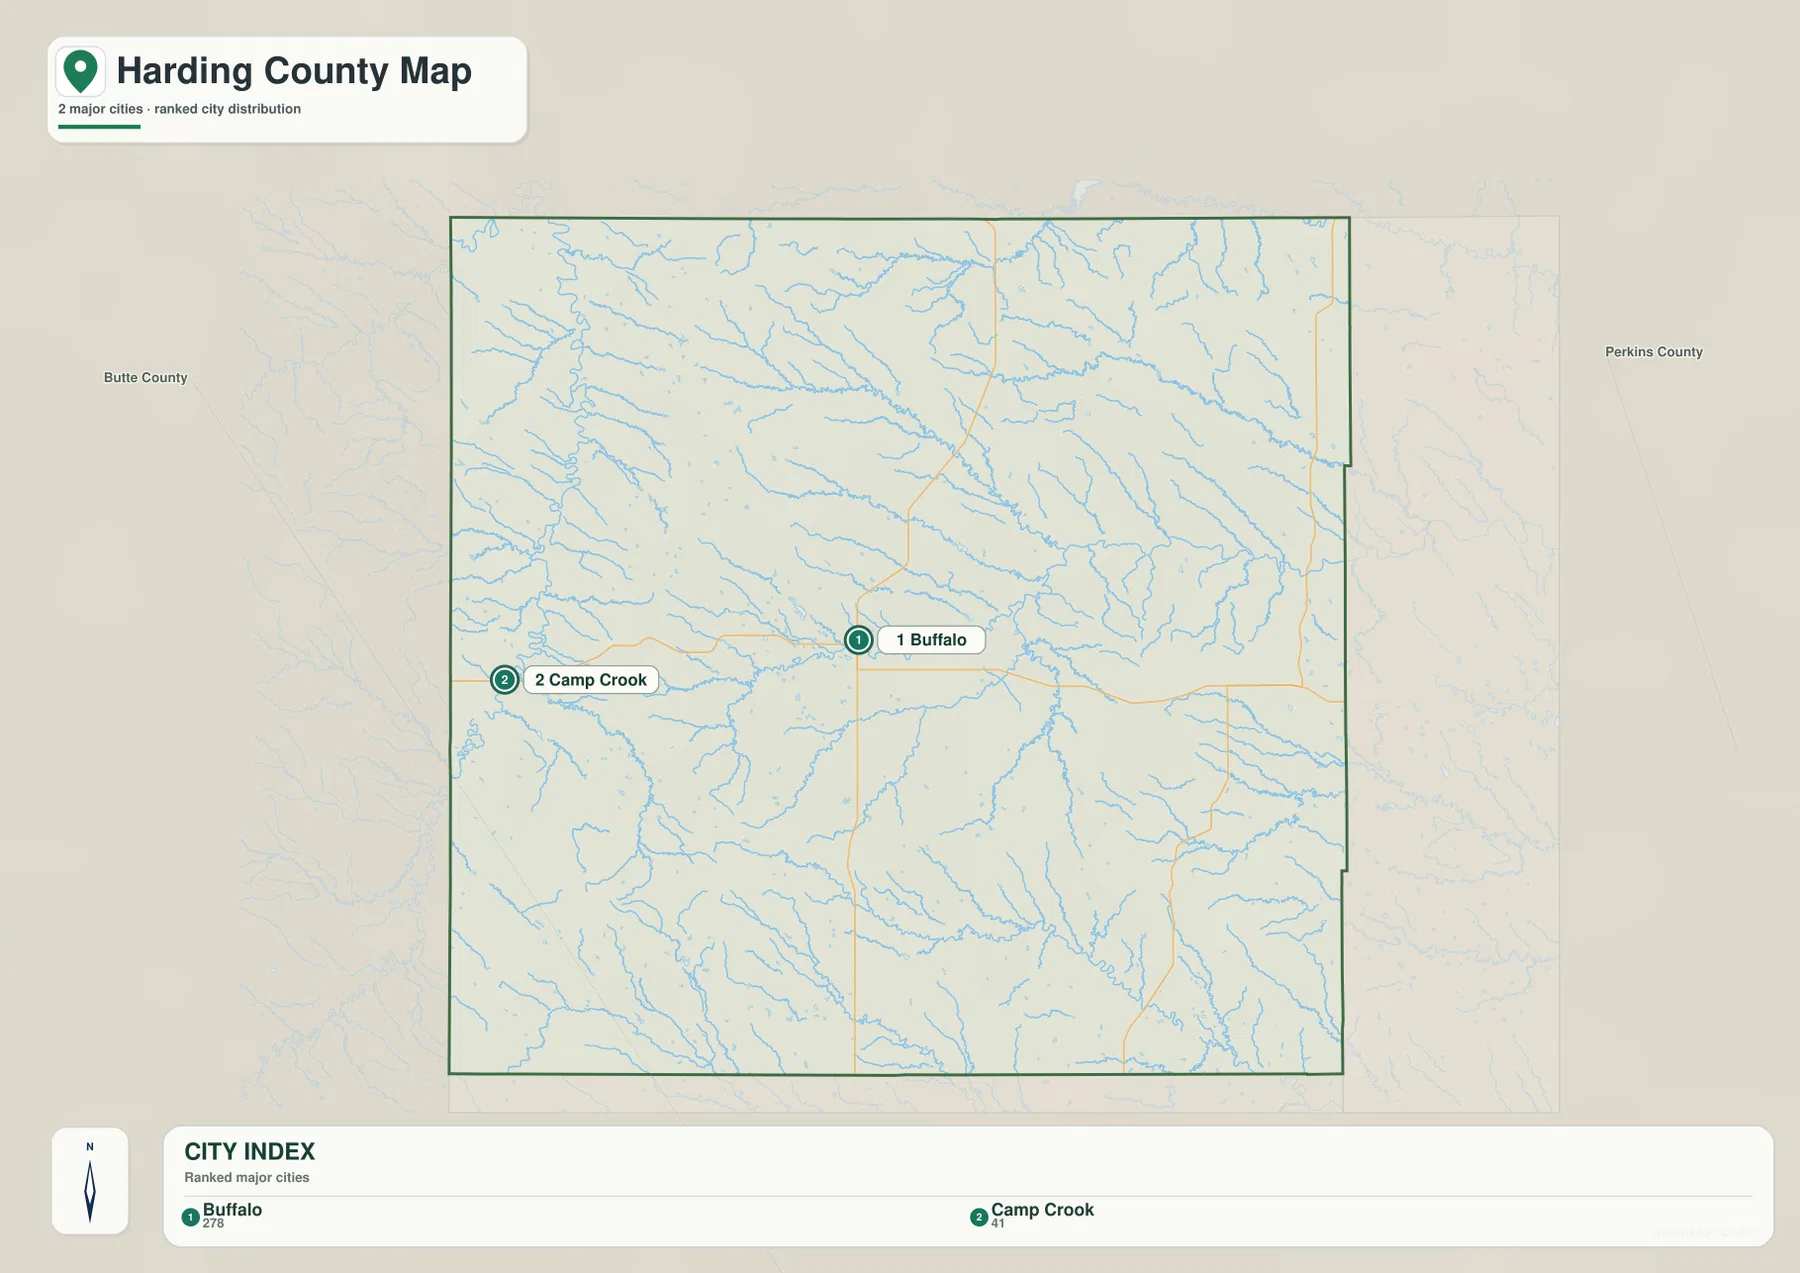
The background also labels neighboring county areas, including Butte County and Perkins County, which helps with broad orientation. Those labels should not replace the county boundary itself when checking whether a feature is inside Harding County. On a large rural map, roads, streams, and place names can continue visually beyond the border, so the bold county outline remains the most reliable visual guide within the supplied image.
After locating Buffalo and Camp Crook, the water map becomes easier to interpret. Camp Crook’s western position puts it closer to the Little Missouri side of the county, while Buffalo provides a reference for the central drainage. The city image does not need to show every small settlement to be useful; its purpose is to establish a simple frame for reading the more detailed maps that follow.
Little Missouri River, South Fork Grand River, and the Moreau forks
The terrain and water map shows a dense network of drainage lines. The Little Missouri River is the clearest western feature, running along the left side of the county outline. Crooked Creek approaches that system in the north. Farther east, Bull Creek and Big Nasty Creek are prominent in the upper half of the county, while the South Fork Grand River crosses the central area and provides another major reference for understanding the drainage.
The southern half has a different set of names. The North Fork Moreau River curves across the lower-central and eastern area, and the South Fork Moreau River appears along the southwestern edge. Smaller labels include Jones Creek, Miller Creek, Sand Creek, and Sheep Creek. The map also marks Beermug Lake and Sarsland Lake in the north and Park Pond Reservoir farther south, so readers can compare named standing water with the longer river and creek systems.
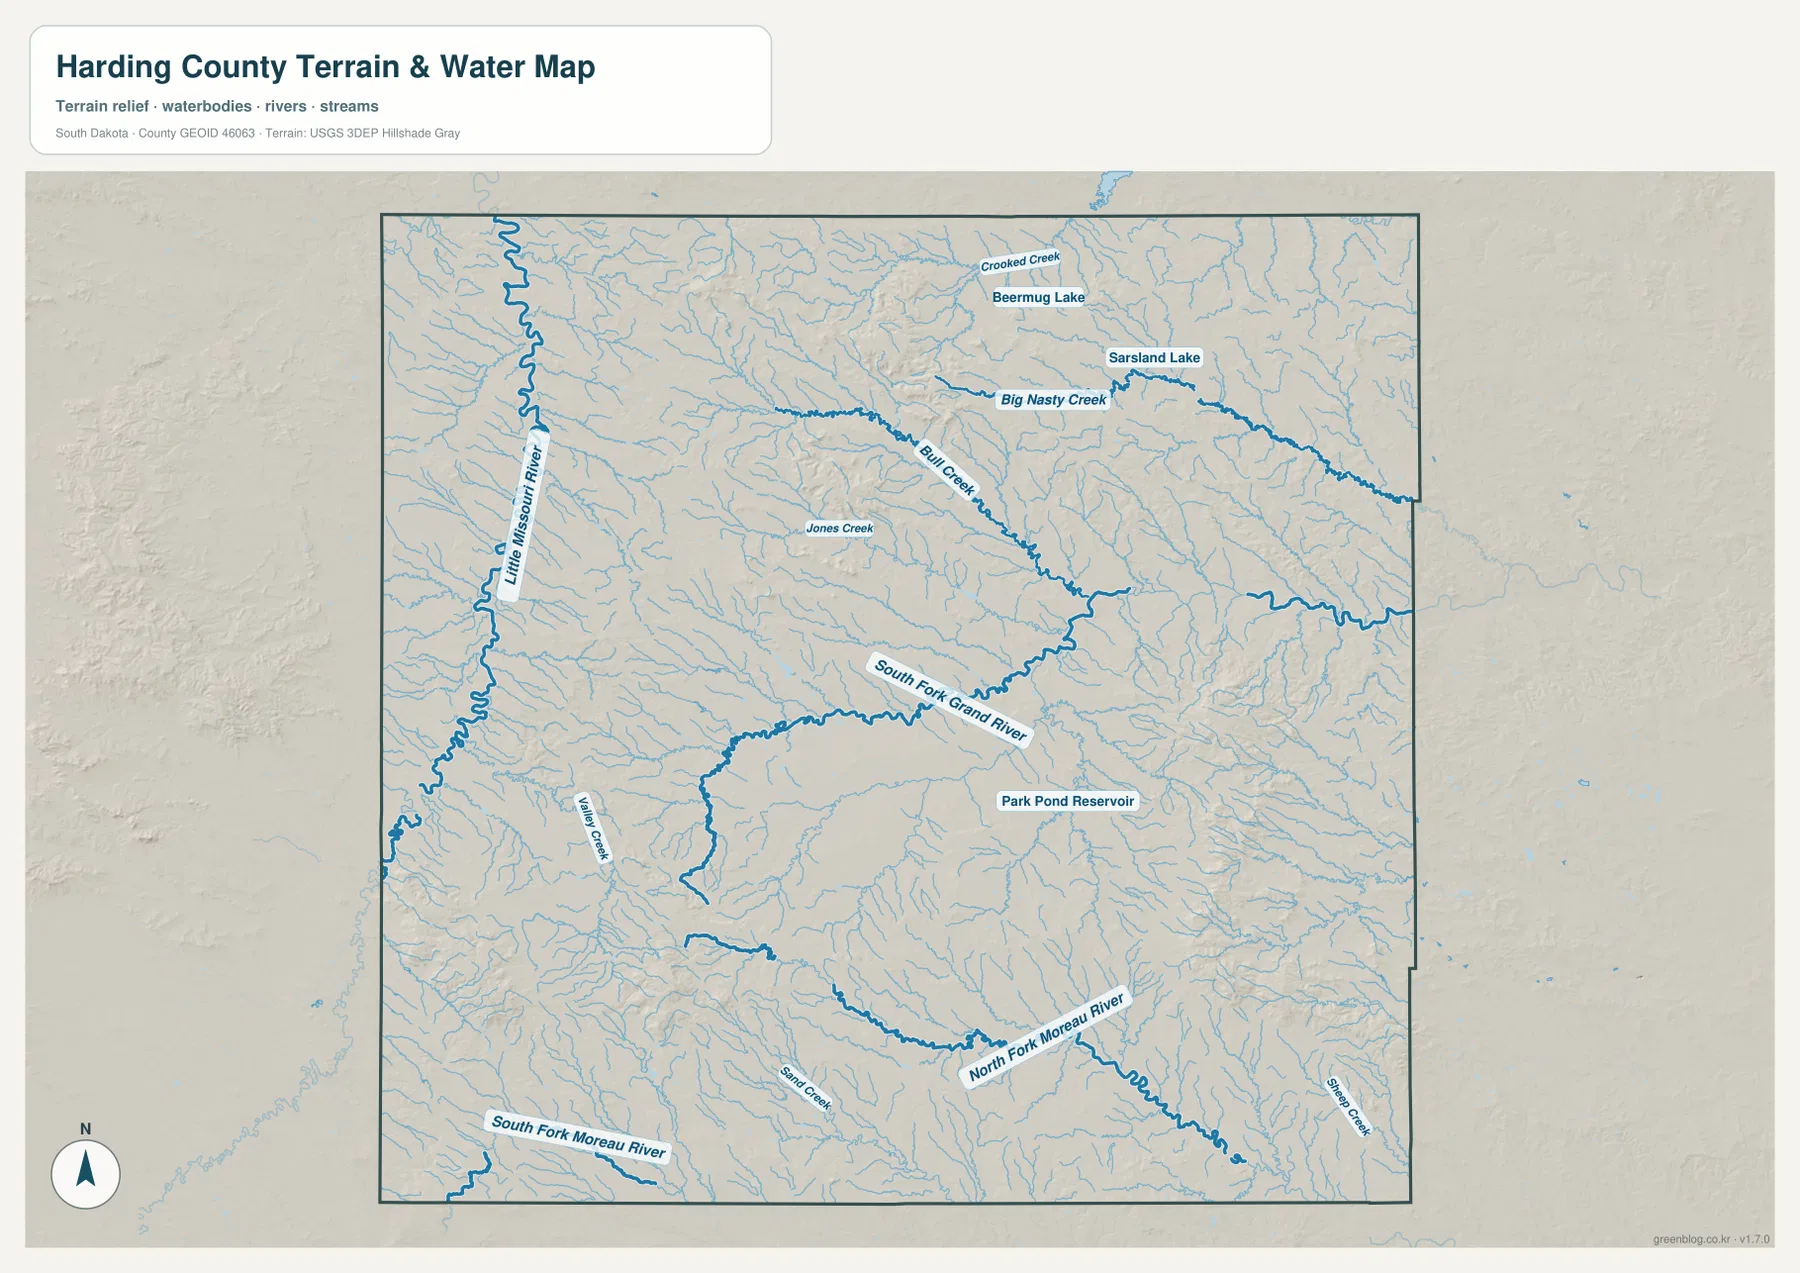
This map is a water-reference and terrain overview, not a flood-hazard map, navigation chart, or parcel product. A blue line does not mean a channel has the same width or flow throughout the year, and the image does not predict inundation. Anyone making decisions about flood exposure, water rights, crossings, or field conditions should use the appropriate current agency data rather than relying on this overview.
The water map is especially useful when compared with the elevation image. Long green low areas on the elevation view often line up with the same valleys occupied by the Little Missouri, the South Fork Grand, and the Moreau branches. At the same time, Harding County contains isolated high ridges that interrupt any simple west-to-east pattern. The combination of water and relief explains the county better than either map on its own.
From 781 to 1,224 meters: broad relief and isolated high ground
The elevation legend reports an actual county range of about 781 to 1,224 meters, with a mean near 933 meters. That span is large enough to produce strong color differences across the image. Broad green areas cover much of the center and east, while tan and brown zones rise in the west and southwest. Distinct darker high areas also appear in the north-central and eastern-to-southeastern parts of the county.
The southwest is the most obvious large block of higher ground, but the county is not a simple tilted surface. Narrow valleys cut through high areas, and isolated ridges stand above lower surroundings. Comparing the map with the water view helps identify why some green corridors branch repeatedly: creeks and rivers occupy lower terrain and divide the surrounding uplands into separate ridges and hills.
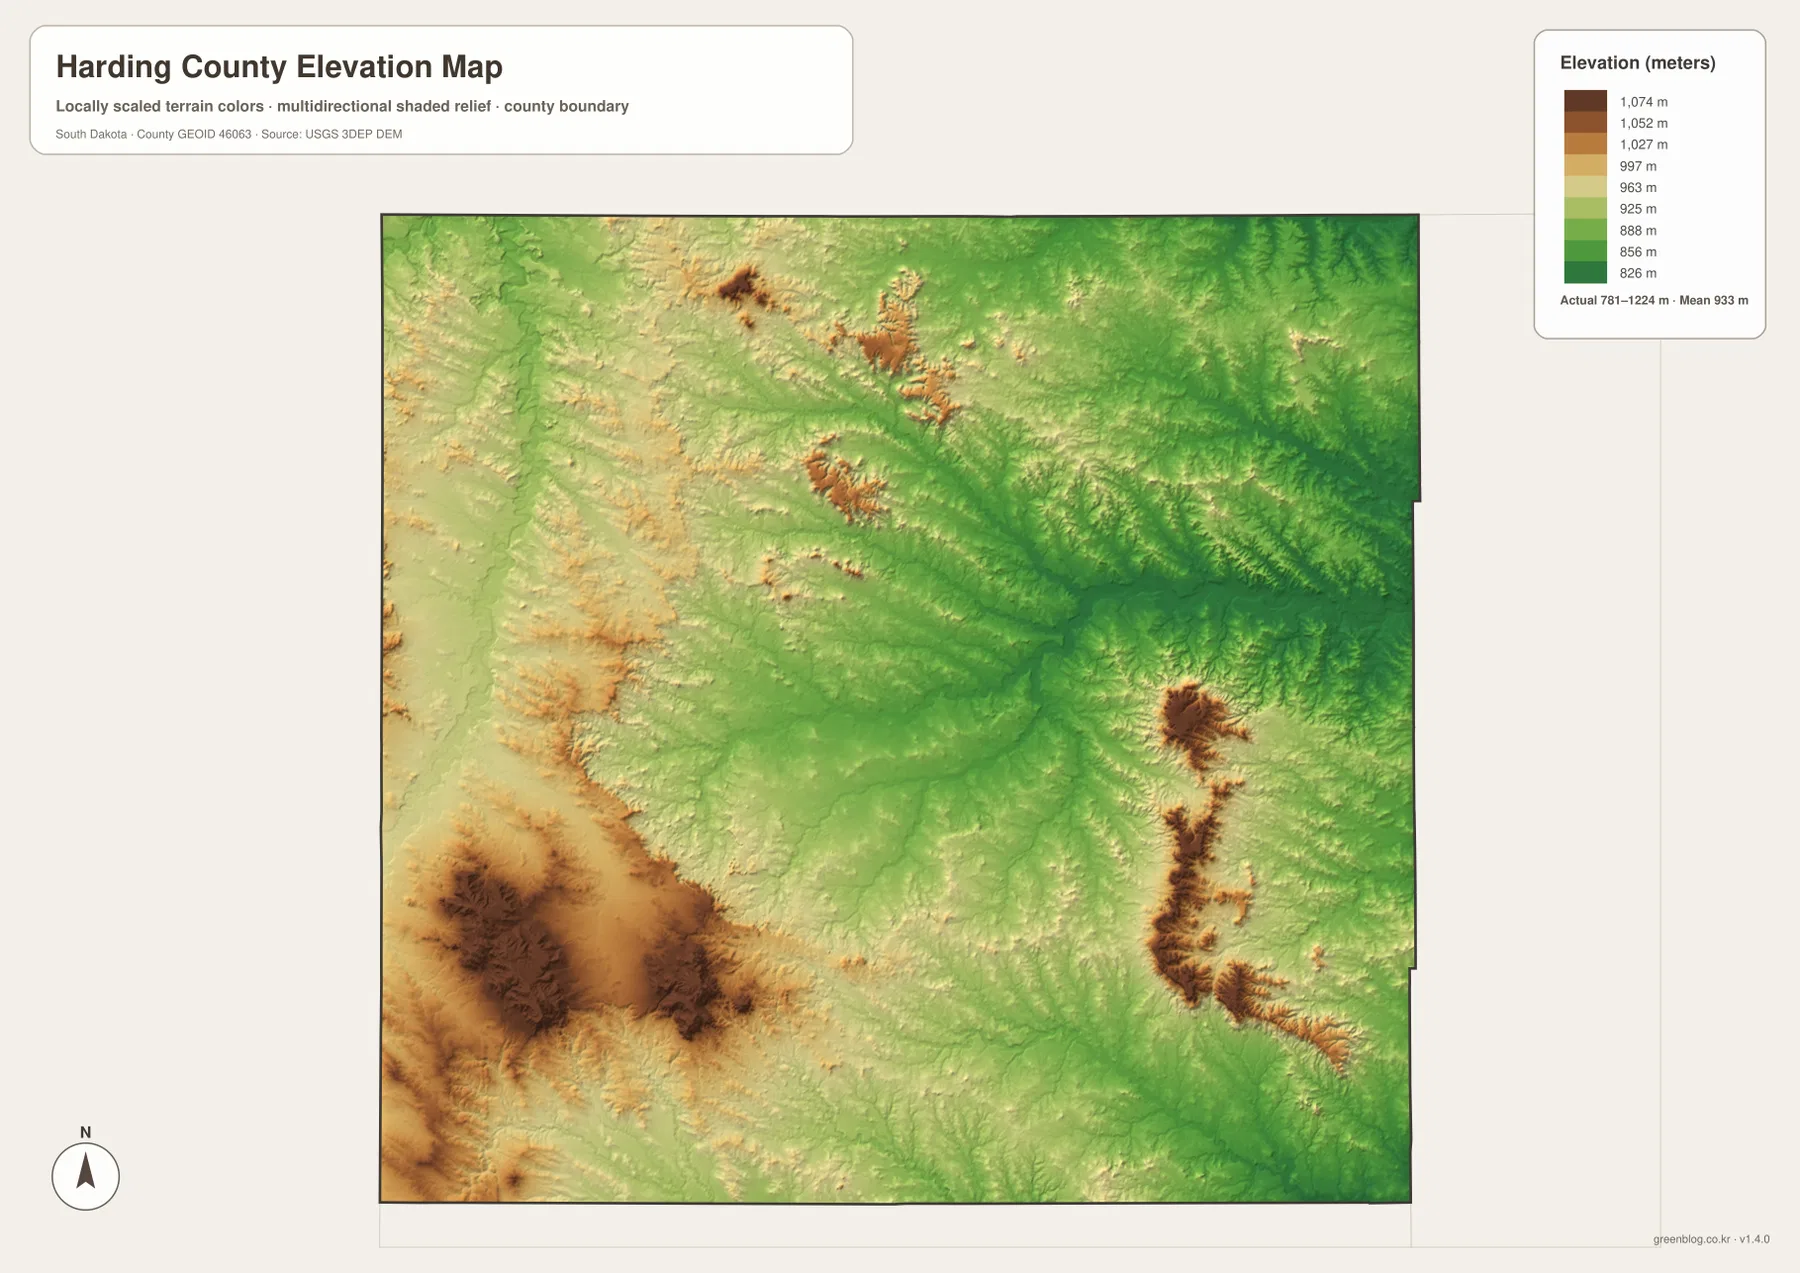
The colors should be read as a county-wide comparison, not as survey-grade elevations for an address, road cut, or property corner. The surface is generalized so that broad landform differences are easy to see at page scale. Engineering, construction, drainage design, and legal surveying require source elevation data and field methods appropriate to the accuracy needed.
For a general reader, the most useful observation is the relationship between high ground and drainage. The Little Missouri valley on the west, the central Grand River drainage, and the Moreau branches in the south create lower corridors between ridges. That relationship also explains why the road map contains bends and irregular segments even though many rural roads otherwise follow a grid.
Choosing the right Harding County map for the task
Start with the county map when you need roads, named places, and the county outline. Use the city distribution map when you only need the broad relationship between Buffalo and Camp Crook. Choose the terrain and water map for the Little Missouri River, South Fork Grand River, Moreau branches, and named creeks or lakes. Use the elevation map when the question is about broad high and low ground rather than road location.
A useful reading sequence is Buffalo first, water second, relief third. Find Buffalo on the road map and note the direction of Camp Crook. Then locate the Little Missouri River and South Fork Grand River on the water map. Finally, compare those areas with the elevation colors and look for the lower valleys that cut between the higher ridges. This sequence lets each map contribute information without repeating the same explanation four times.
The WebP previews in the article are reduced for convenient browser viewing. For zooming into small labels, making an A3 print, preparing a presentation, or keeping an offline reference, use the original JPG files in the ZIP below. The archive contains the county map, city distribution map, terrain and water map, and elevation map as four 3638 × 2572 pixel JPG images.
Frequently Asked Questions
Does the city map give the distance from Buffalo to Camp Crook?
No. This city distribution map highlights Buffalo and Camp Crook but does not draw a connector line or print a mileage value between them. Use it only to see that Buffalo is nearer the central part of the county and Camp Crook is farther west. Check a current road service for actual driving distance and travel time.
Which map is best for the Little Missouri River and South Fork Grand River?
The terrain and water map is the clearest choice. It emphasizes the Little Missouri River along the west, the South Fork Grand River through the central area, the Moreau branches in the south, and many named creeks and water bodies. Compare it with the elevation map if you also want to see how those waterways follow lower terrain.
Can the 781–1,224 meter elevation range be used for surveying or engineering?
No. The range summarizes broad relief across Harding County and is not a survey-grade value for a specific parcel, road, or building site. Engineering, construction, drainage, and legal survey work should use source elevation data and appropriate field measurements.
Map File Information
The ZIP below contains the original Harding County road and place map, city distribution map, terrain and water map, and elevation map as four high-resolution JPG files.
- Included Files: 4 JPG maps
- Printable Size: 3638 × 2572 px each
Related Maps
Sources and references
- South Dakota Legislature – Harding County boundaries – Official statutory description of the Harding County boundary and state-line segments.
- South Dakota State Historical Society – Harding and Perkins Counties Survey – State historical survey with Harding County background and regional context.
- U.S. Census Bureau QuickFacts – Harding County, South Dakota – Official county population and demographic reference.
- U.S. Census Bureau TIGER/Line Shapefiles – Official geographic reference data for county boundaries, roads, and related features.
- USGS National Hydrography – Official U.S. hydrography resources for rivers, streams, and water bodies.
- USGS 3D Elevation Program – Official USGS information on national elevation data and 3DEP.
Green Map creates custom-edited map images using open geographic data sources such as geoBoundaries, Natural Earth, OpenStreetMap, and government open data.
These maps are edited visual materials, not raw data files, and are provided for education, documents, presentations, and graphic reference.