Wheeler County is a small south-central Georgia county whose geography becomes much clearer when Alamo, Glenwood, the road network, the creek system, and the low-relief terrain are viewed together. Alamo sits near the middle of the county and functions as the county seat, while Glenwood forms a second settlement point farther east. The county stretches well to the southeast, so the places where people travel most often and the areas where water drains are not distributed evenly across its long outline.
The maps on this page separate those patterns rather than forcing everything onto one crowded image. You can compare the county boundary and major routes, the two principal city locations, named creeks and the Little Ocmulgee River, and an elevation surface ranging from about 27 to 95 meters. You can download all four Wheeler County maps together as high-resolution JPGs in one ZIP archive, making it easy to move from a quick web preview to a printable reference.
Table of Contents
Alamo is the road hub inside a long county outline
The general county map gives Alamo a clear organizing role. Several numbered roads approach or leave the community in different directions rather than following a single north-south corridor. U.S. 280 and routes 30, 31, and 319 appear near the southwestern side of the Alamo area, Route 126 runs northwest, and Route 149 heads south. East of Alamo, Glenwood sits close to the north-south Route 19 corridor, while Route 46 crosses the northern part of the county. That pattern makes the map useful for understanding movement between the two local centers and the surrounding counties.
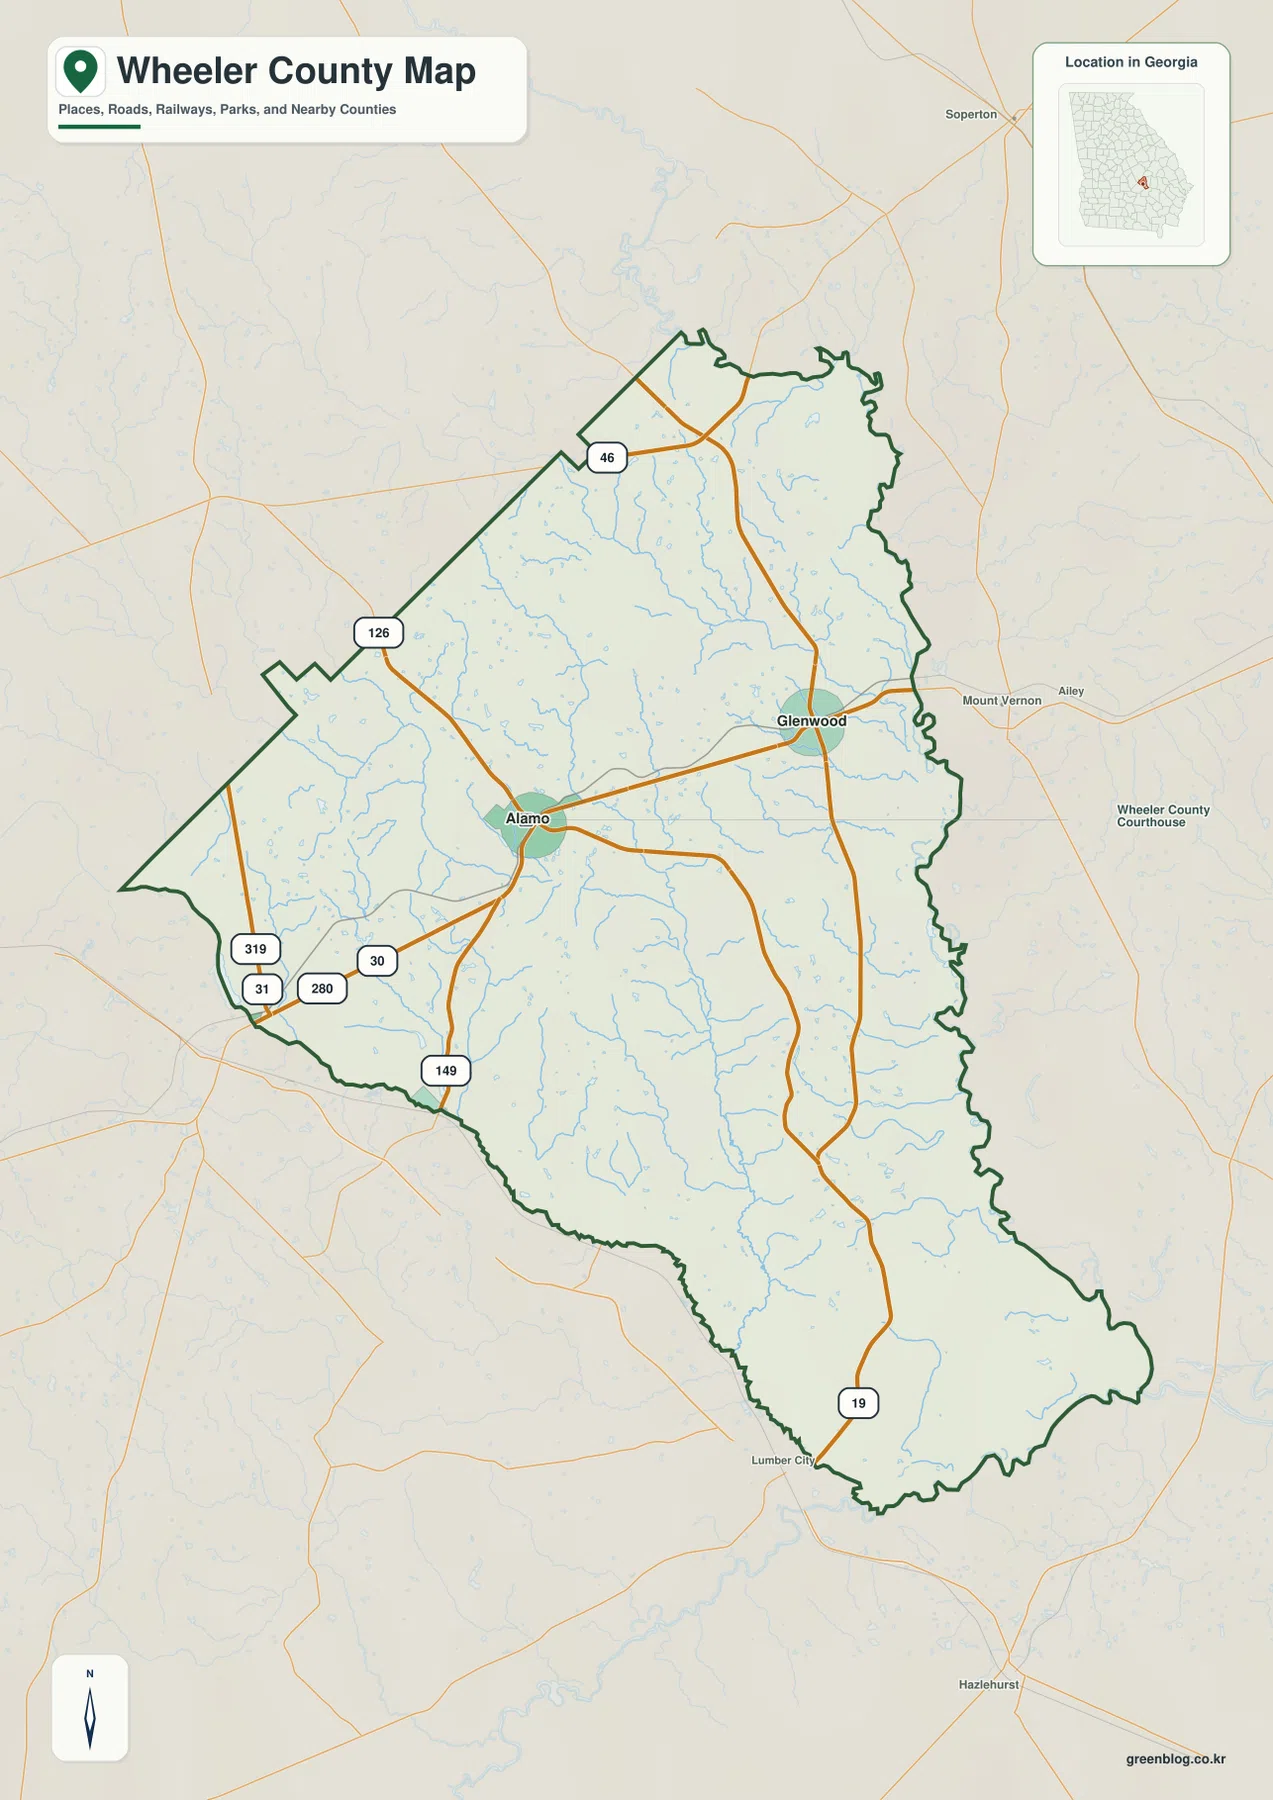
The outline itself is distinctive. The northern end is narrower, the western side includes a sharp outward projection, and the county continues a considerable distance toward the southeast. The eastern edge is more irregular than the straighter western segments. Nearby labels such as Soperton to the north, Mount Vernon and Ailey to the east, Lumber City near the south, and Hazlehurst farther south help place Wheeler County in a broader regional setting without turning the page into a road atlas.
The supplied county information identifies Alamo as the county seat and notes that Wheeler County was established in 1912. The reference map is appropriate for county-scale orientation, but it should not be treated as a parcel map, municipal-limit survey, or complete local street inventory. Small roads and unincorporated communities may be absent even when they are important on the ground.
| State | Georgia |
|---|---|
| County | Wheeler County |
| County seat | Alamo |
| Established | 1912 |
| Major city labels | Alamo and Glenwood |
| Elevation shown | About 27–95 m; mean about 58 m |
Two city anchors leave most of the county visually rural
The city-distribution map strips away much of the route detail and makes the settlement pattern easier to see. Alamo appears near the center-west and ranks first among the two labeled city points, while Glenwood lies to the east and ranks second. There is no chain of equally prominent towns running through the southern half of the county. Instead, the map suggests a county with a small number of incorporated centers surrounded by a much larger rural landscape.
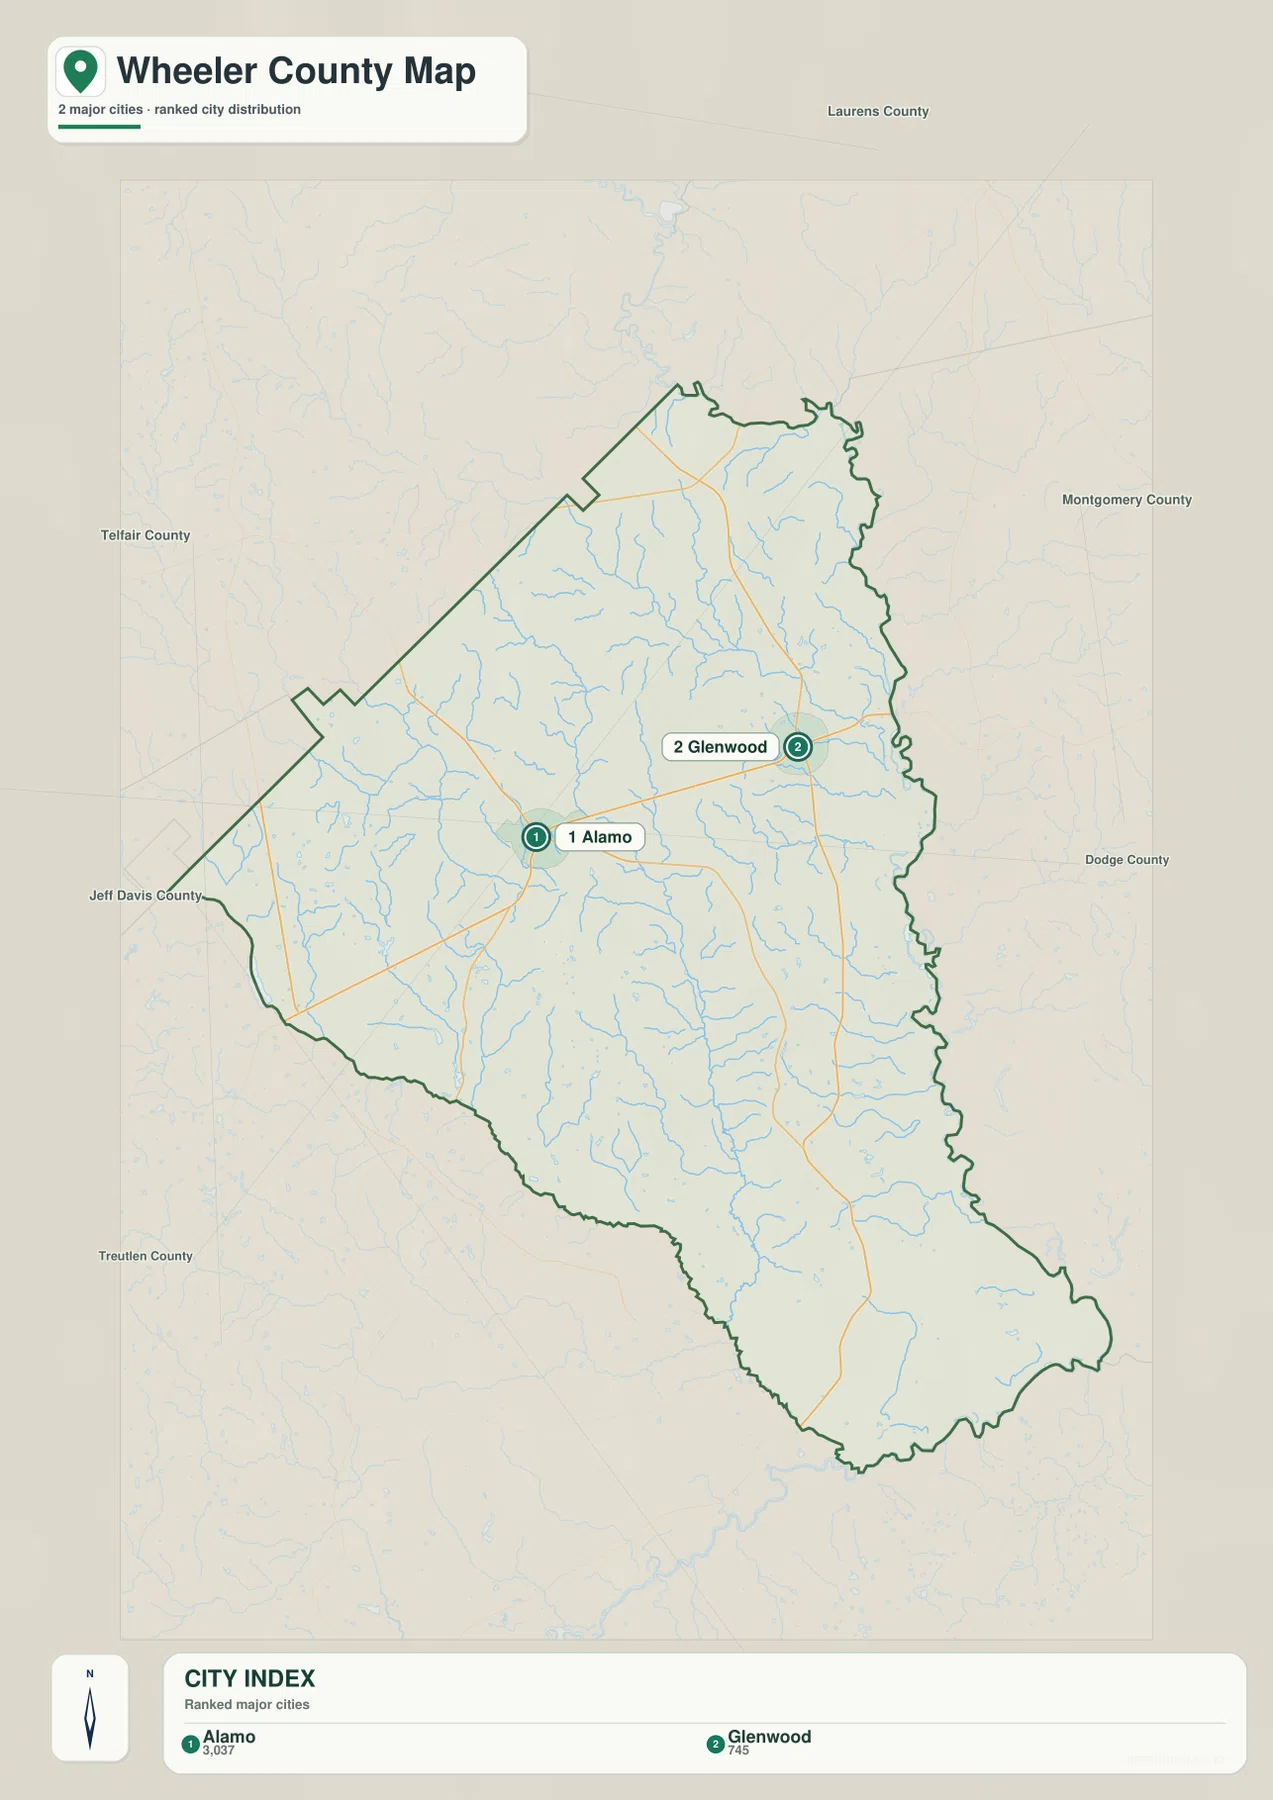
The neighboring-county labels reinforce that orientation. Laurens County is shown to the north, Montgomery and Dodge counties lie to the east, and Telfair, Jeff Davis, and Treutlen appear along the western and southwestern sides. A trip leaving Alamo toward the northwest therefore points into a different regional connection than a trip leaving Glenwood toward the east. The city map is useful when that relative direction matters more than individual road numbers.
Comparing the city and county maps also shows why Alamo works as the best starting point for reading the county. More route lines converge close to Alamo, then spread toward the northwest, southwest, south, and east. Glenwood supports the eastern side of the network, especially along the Route 19 corridor. South of those communities, the county continues for a long distance without another city label of similar prominence.
A dense creek network replaces the idea of one dominant water feature
The water-and-terrain map changes the visual emphasis again. Wheeler County is crossed by many small channels rather than being organized around a single large lake. Big Branch and Ochwalkee Creek are labeled in the northern portion, Peterson Creek and Larry Creek appear toward the east, and Little Creek, Bear Creek, and Alligator Creek run through the central part of the county. White Creek and Mill Creek add more drainage lines on the western side.
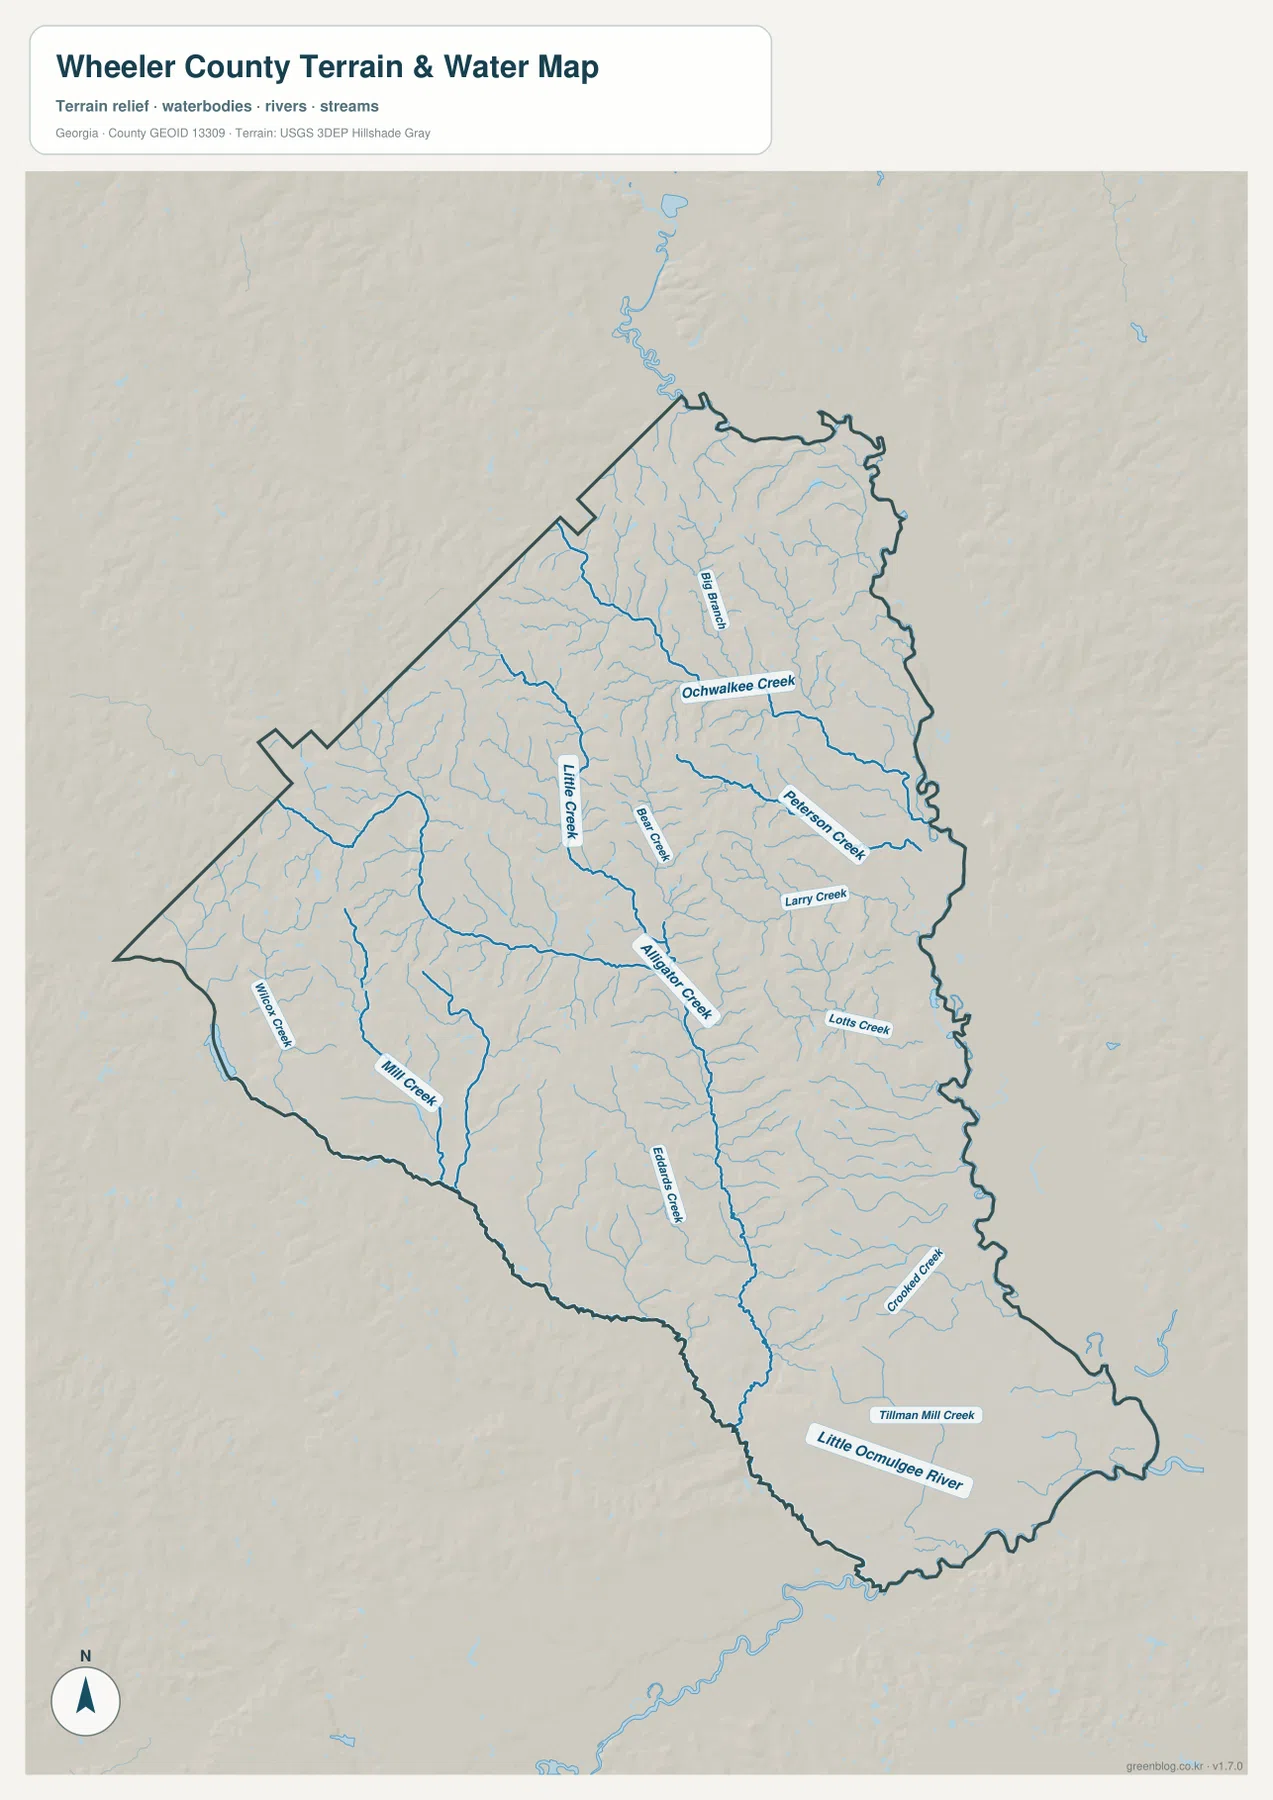
Farther south, the pattern continues with Lotts Creek, Crooked Creek, Tillman Mill Creek, and other short tributaries. The Little Ocmulgee River is labeled near the county’s southern end and provides a larger receiving channel than most of the blue lines upstream. The result is a branching drainage pattern in which numerous small valleys connect to larger waterways as they move through the long southern part of the county.
This map is best used as a water-reference layer, not as a flood-risk or navigation product. A blue line identifies the mapped position of a stream or river, but it does not show current water depth, seasonal width, legal access, wetland regulation, or the extent of a floodplain. Those questions require current specialized sources. For county-scale geography, however, the map makes it easy to see that water is distributed through many narrow channels rather than concentrated in a few large water bodies.
The difference between roads and streams is especially noticeable around the middle of Wheeler County. Roads form longer connections between Alamo, Glenwood, and county exits, while the creeks branch repeatedly into smaller tributaries. Looking at both layers explains why a road map can appear relatively open even though the same part of the county contains a dense natural drainage network.
Low overall relief still produces visible ridges and drainage valleys
The elevation map lists an actual range of roughly 27 to 95 meters and a mean near 58 meters. Those numbers describe a low-elevation county, but the shaded surface is not featureless. Brown and tan colors mark higher ground across much of the northwest and central-west, while greener low areas become broader near the eastern boundary and toward the southeast and southern tip.
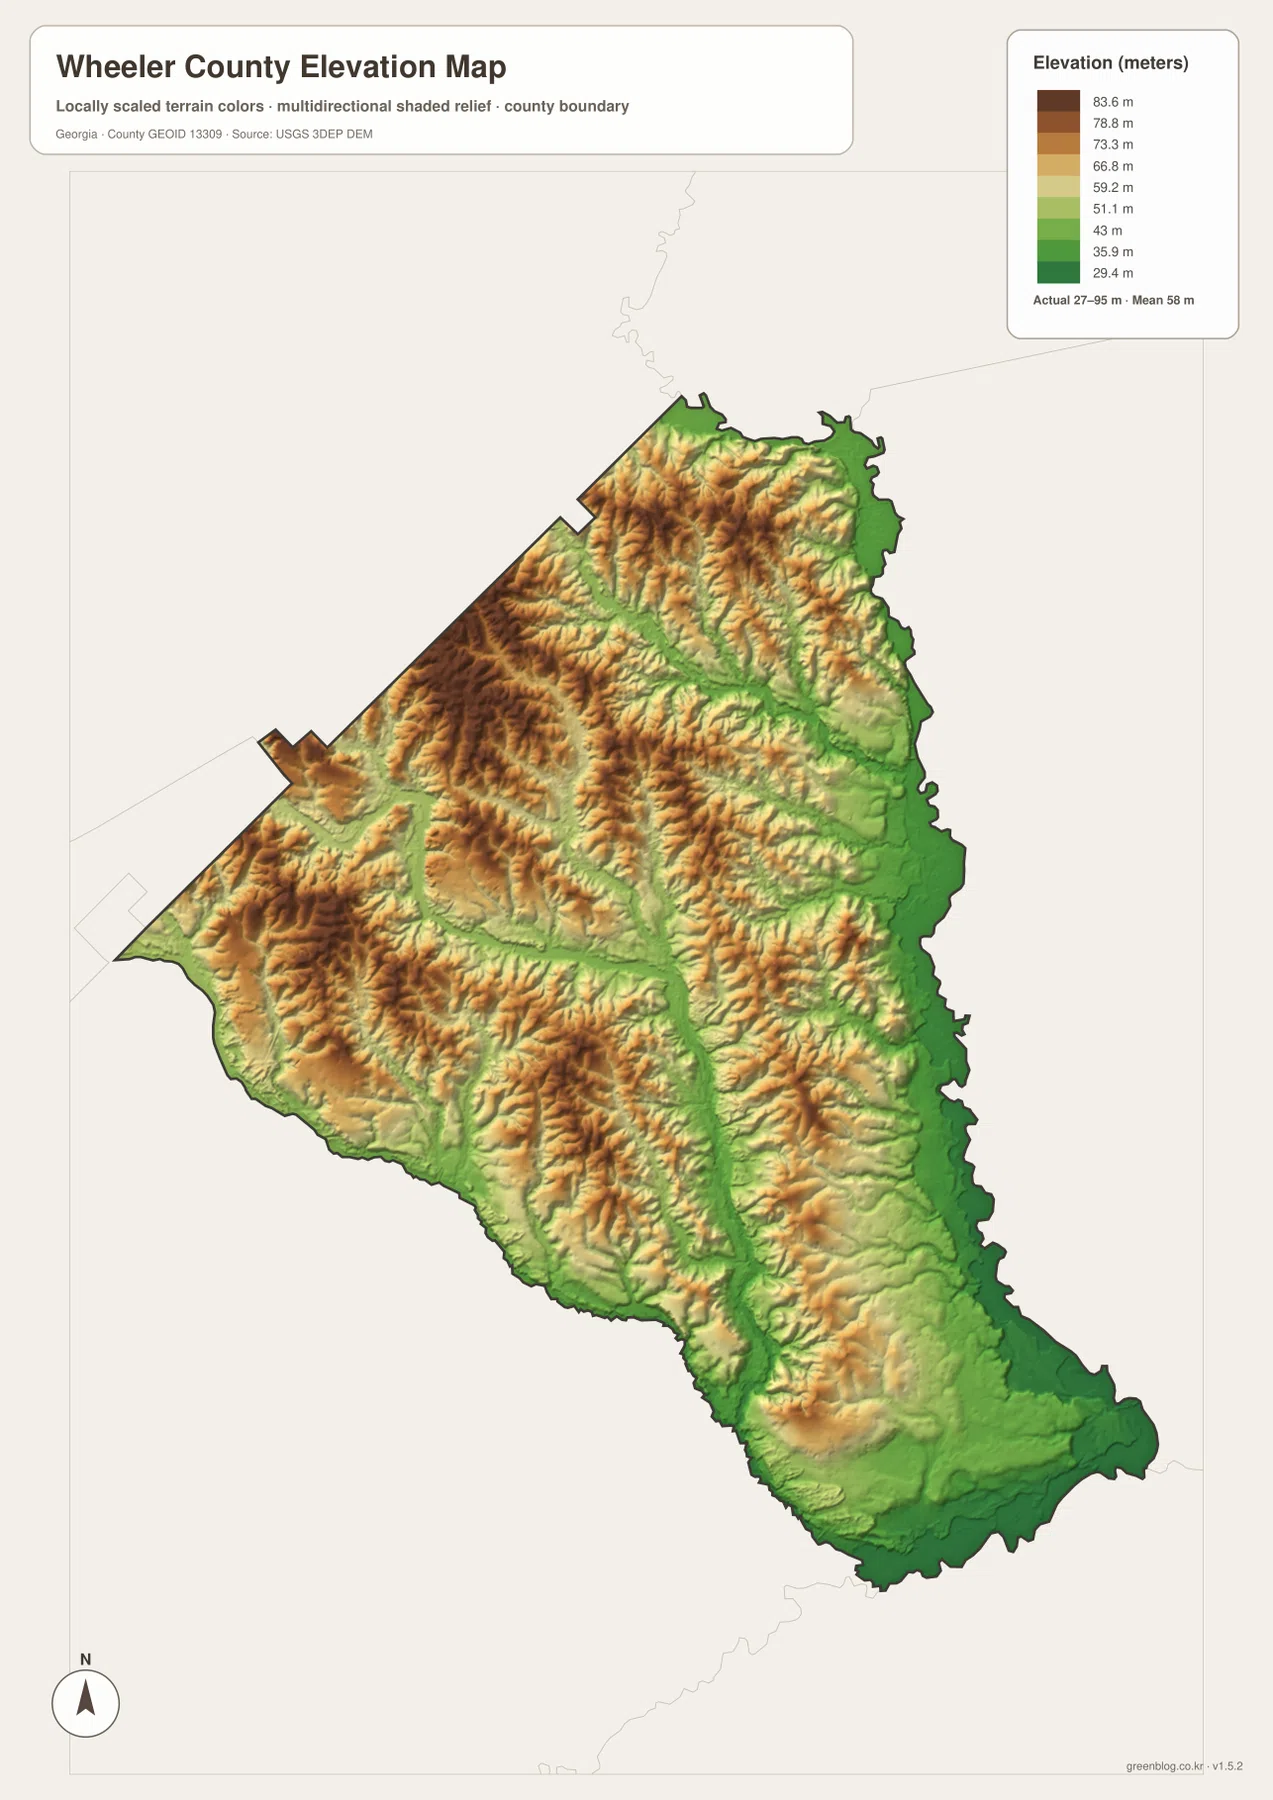
Narrow green bands cut into some of the tan uplands, creating a pattern that matches the branching stream system on the water map. The higher areas are not mountain ridges in the northern Georgia sense; they are modest uplands separated by lower creek valleys. That distinction matters because the relief is visible locally even though the absolute elevation remains low across the county.
The southeast provides the clearest contrast. Lower colors spread across the long end of the county, close to the area where the water map shows the Little Ocmulgee River and several tributaries. In the central and northwestern interior, the terrain is more broken, with repeated short ridges and valleys. These patterns are useful for general geographic explanation, but the color breaks should not be interpreted as exact contour lines.
This elevation product is a generalized county-scale surface, not a survey-grade measurement tool. It can help identify relative highs, lows, ridges, and drainage corridors, but it is not suitable for engineering design, site grading, property surveys, or construction decisions. A project requiring precise elevations should use authoritative site-specific data.
Reading roads, settlements, water, and relief as one county
Wheeler County becomes more informative when the four maps are read in sequence rather than as isolated graphics. Start with Alamo on the county map to establish direction. The city layer then shows how Glenwood forms the second major settlement point to the east. Switching to the water map reveals the dense creek network that occupies the spaces between those road connections, and the elevation layer explains why many of those streams follow narrow lower corridors through otherwise rolling terrain.
The central part of the county is a good example. Route 149 leaves the Alamo area toward the south, but the water and elevation layers show that the surrounding landscape is crossed by multiple drainage lines and alternating low valleys and higher ground. On the east side, Glenwood and Route 19 provide an easy positional reference before the creek and elevation maps add Peterson Creek, Larry Creek, and the broader low terrain near the boundary.
This approach also helps avoid using the wrong map for a question. The county map is the fastest choice for boundaries and major routes. The city view is cleaner for comparing Alamo and Glenwood. The water layer is better for named streams, and the elevation layer is best for distinguishing uplands from valley floors. The information overlaps, but each map has a different strength.
Choosing a file for print, classwork, or local research
The WEBP images in the article are convenient for on-screen viewing, while the downloadable archive contains the four original high-resolution JPG files. A teacher may pair the general map with the water map to compare human routes and natural drainage. A local-history or genealogy project may begin with Alamo and Glenwood on the city layer, then use the county map to relate those places to neighboring areas. The elevation file is useful when a report needs to explain why some stream corridors appear lower than the surrounding rolling ground.
- Boundary and major-route reference: use the county map.
- Alamo–Glenwood settlement comparison: use the city-distribution map.
- Named creeks and the southern river connection: use the water map.
- Relative high ground and drainage valleys: use the elevation map.
For publication or analysis, keep the limitations attached to each layer. None of these maps replaces parcel records, a flood-insurance map, a navigation chart, or a field survey. Their strength is county-scale orientation: they make it easier to explain where places, routes, streams, and low or high terrain sit in relation to one another.
Frequently Asked Questions
Why does southeastern Wheeler County look lower on the elevation map?
The elevation layer shows broader green low areas toward the southeast and southern end. The water map places the Little Ocmulgee River and several tributaries in the same general part of the county, so the lower colors are consistent with drainage valleys and river lowlands.
Which map is best for comparing Alamo and Glenwood?
The city-distribution map gives the cleanest view of their relative positions. Use the general county map alongside it when you also need the major routes connecting the two places and the roads leaving the county.
Can the water map be used to identify flood-prone property?
No. It is a county-scale hydrographic reference showing mapped streams and rivers. Flood zones, property boundaries, regulatory wetlands, and site-level drainage conditions require separate current official sources.
Map File Information
The ZIP contains four original high-resolution JPG maps of Wheeler County covering the county reference, city distribution, water system, and elevation.
- Included Files: county map, city map, water map, elevation map
- File Type: four JPG files in one ZIP archive
Related Maps
Sources and map references
These sources provide county background and authoritative context for the boundary, hydrography, and elevation information represented in the maps.
- New Georgia Encyclopedia – Wheeler County
- U.S. Census Bureau TIGER/Line Shapefiles
- USGS National Hydrography
- USGS 3D Elevation Program
Green Map creates custom-edited map images using open geographic data sources such as geoBoundaries, Natural Earth, OpenStreetMap, and government open data. These maps are edited visual materials, not raw data files, and are provided for education, documents, presentations, and graphic reference.