Kaufman County sits immediately east of the Dallas area, but the county is not organized around a single town or a single highway. Forney and Terrell form two prominent northern reference points, Kaufman lies farther south near the middle of the county, and Mabank appears near the southeastern edge. This Kaufman County Map page brings together a general road-and-place map, a simplified city index, a water map, and an elevation map. After reviewing the web maps, you can download the matching high-resolution A3 JPG files together in one ZIP for printing or offline reference.
The supplied maps make several local patterns easy to see. Interstate 20 runs through the northern part of the county, passing Forney and Terrell, while U.S. 175 follows a different route through Crandall and Kaufman toward the southeast. Along the western side, the East Fork Trinity River forms a major water reference, and Big Brushy Creek, Kings Creek, and Rocky Cedar Creek cross other parts of the county. The elevation map adds another layer: it reports an actual range of about 89 to 186 meters, with higher ridges concentrated in much of the north and northeast and lower terrain along western and stream-cut corridors.
Table of Contents
Forney and Terrell anchor the north, while Kaufman gives the county a second center
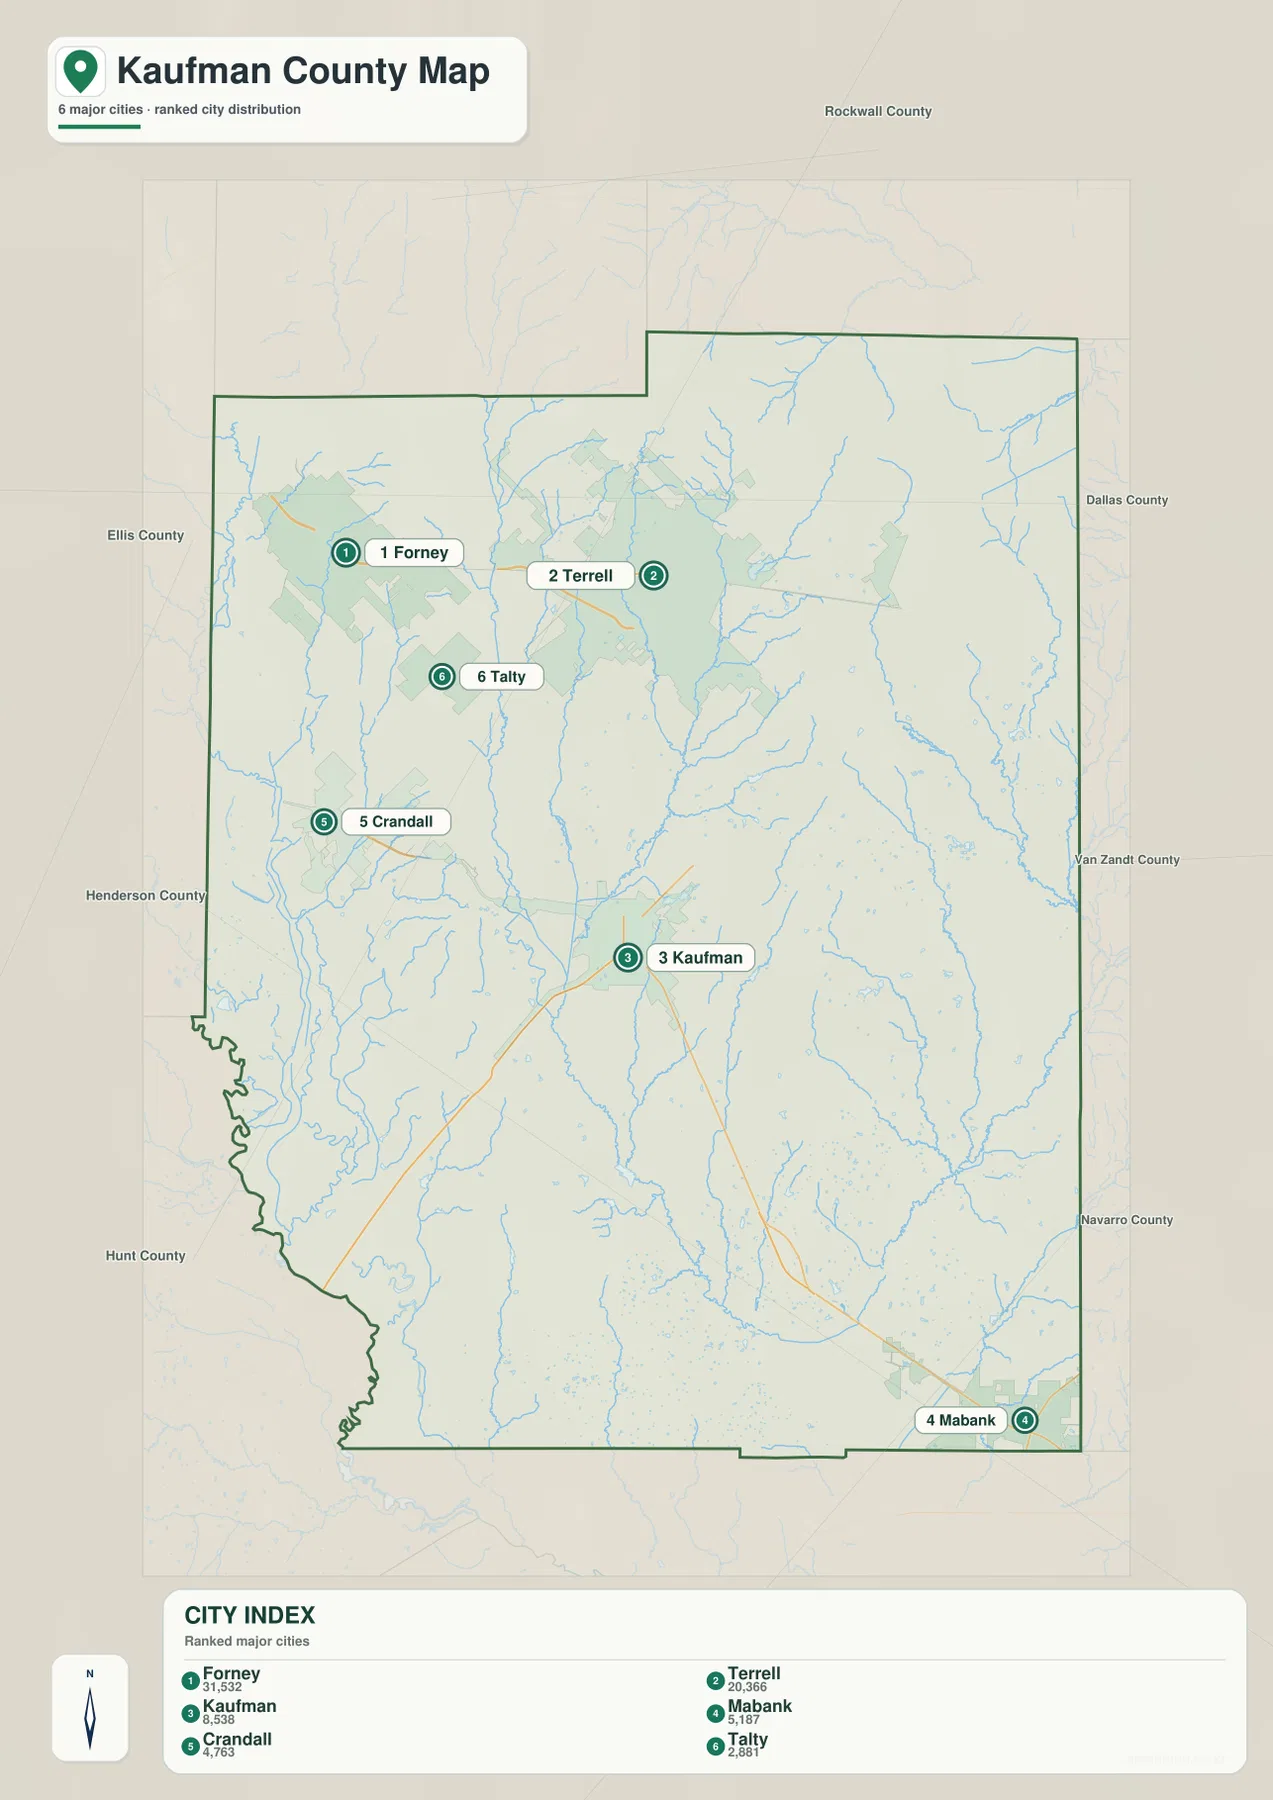
The general county map is a good place to begin because the northern road pattern stands out immediately. Forney is close to the western side of the county, and Terrell lies farther east on the same broad east-west corridor. Interstate 20 is labeled across this northern zone, making the relationship between the two cities easy to follow. The background map also shows Dallas, Mesquite, and Seagoville outside the county, so a reader can quickly place Kaufman County on the eastern side of the larger Dallas urban area rather than treating it as an isolated shape.
Kaufman, the county seat, appears well south of the Forney-Terrell line. The courthouse symbol is visible near the city, and several routes meet in the central area. U.S. 175 approaches from the west and continues southeast, while the 243 marker is shown on an east-west route through Kaufman. Route 34 also reaches the city from the southwest and continues north. Farther south, Kemp sits near another road junction, and Mabank is shown near the southeastern corner. This north-to-southeast sequence is important because the county extends considerably farther south than a quick look at Interstate 20 might suggest.
The city index highlights a split between the northern growth centers and the county seat
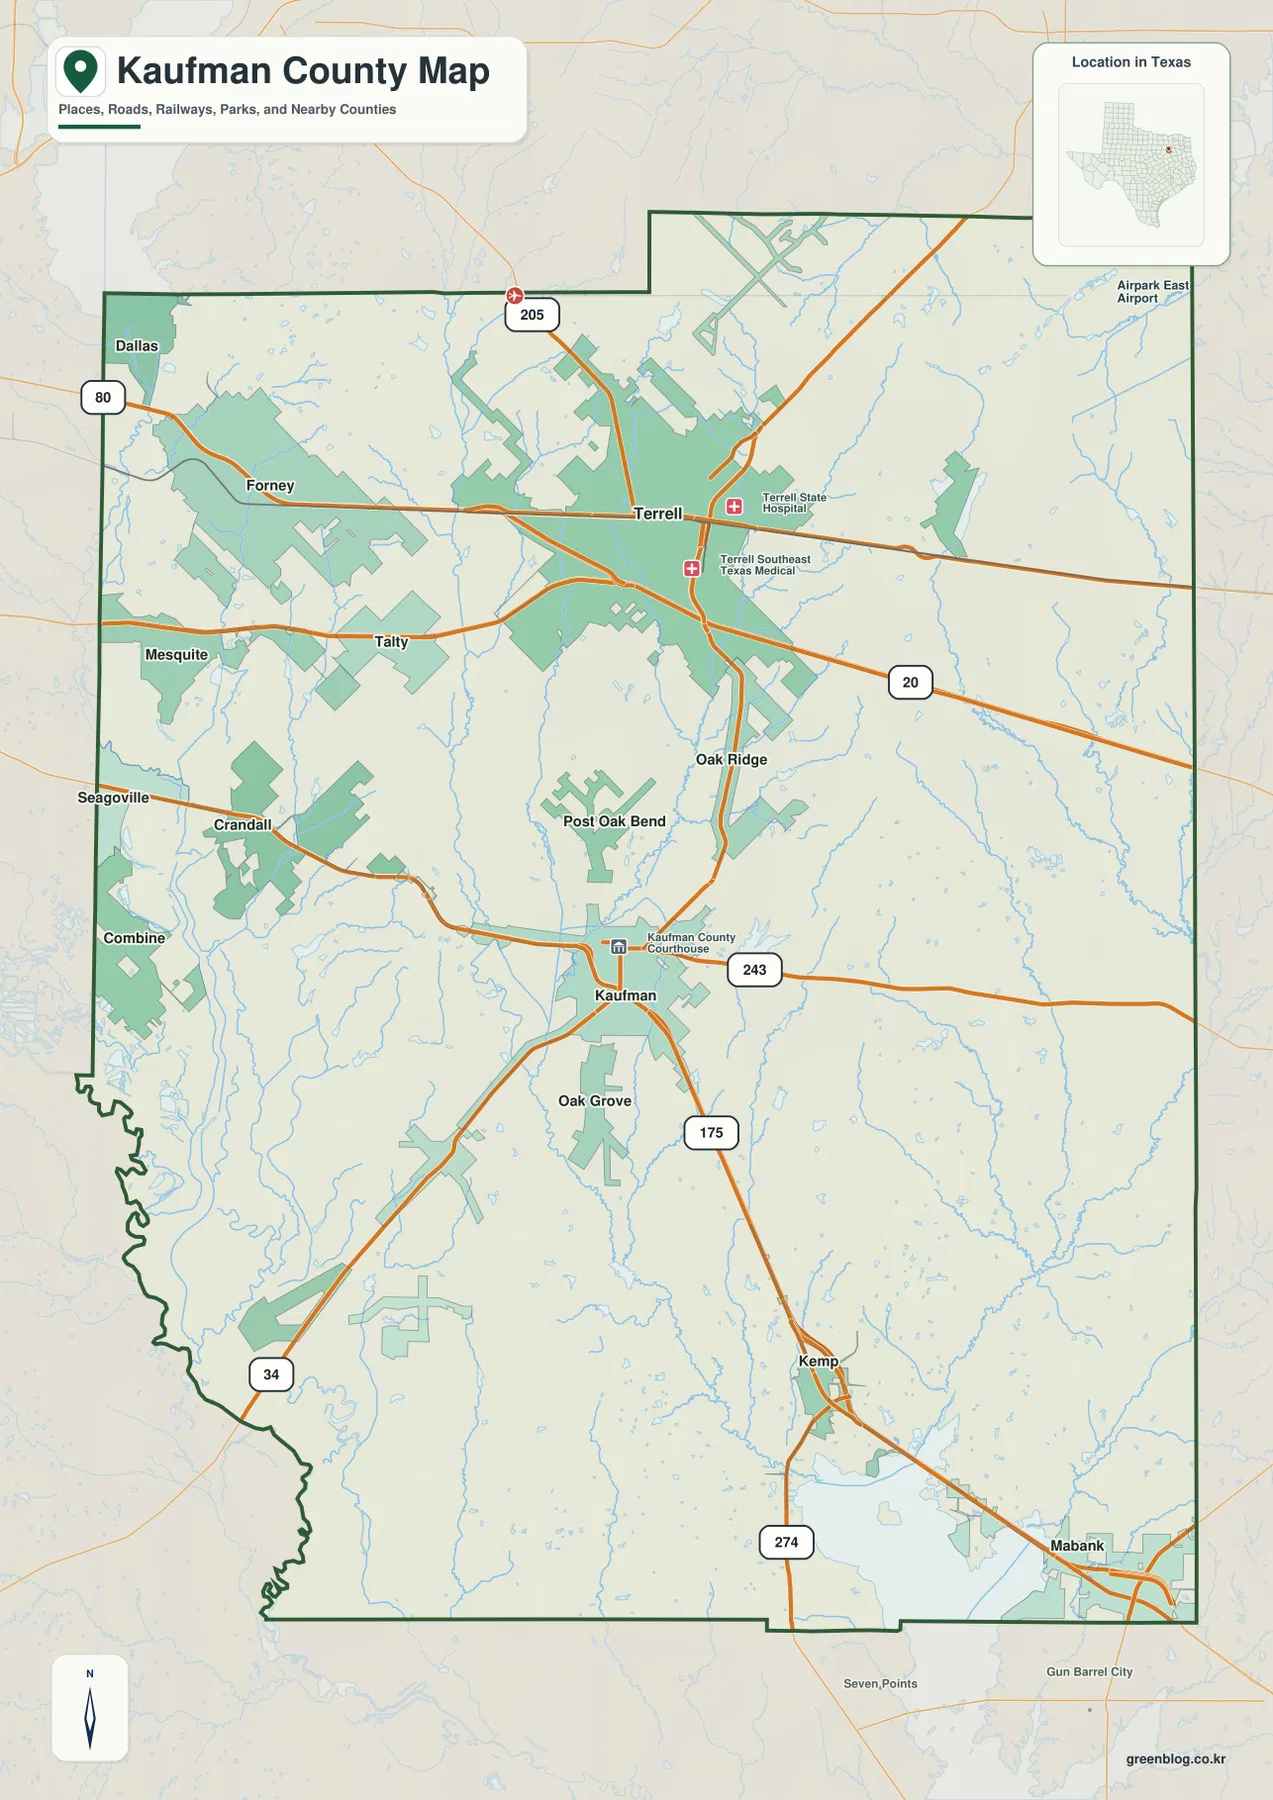
The city version strips away much of the road detail and ranks six labeled cities. The supplied index lists Forney at 31,532, Terrell at 20,366, Kaufman at 8,538, Mabank at 5,187, Crandall at 4,763, and Talty at 2,881. Those values are best treated as the figures printed on this particular map rather than as a substitute for a current population source. Visually, however, they make one point very clear: the largest two entries in the index are both in the northern part of the county, while the administrative center at Kaufman is farther south.
The spacing between the six places is just as useful as the ranking. Forney and Terrell form the northern pair, with Talty shown slightly south of them. Crandall lies farther southwest, Kaufman is near the center-south portion of the mapped area, and Mabank is separated from the others at the southeastern end. A reader who knows only the county name may expect Kaufman to dominate every map, but the city index shows why Forney and Terrell are equally important orientation points for understanding where people and roads are concentrated on the supplied maps.
Interstate 20 and U.S. 175 create two different travel patterns
Interstate 20 is the most obvious northern corridor. It passes through Forney and then Terrell before continuing east, so those two cities can be understood as part of the same broad route even though they are separate local centers. The map also shows an 80 marker entering from the west near Forney and a 205 marker near the upper part of the county. Around Terrell, several roads converge, which makes that city a useful reference point when tracing routes toward the northern and eastern edges.
U.S. 175 serves a different part of the county. It approaches from the Dallas side, passes the Crandall area, reaches Kaufman, and then continues toward the southeast. The 243 marker is shown near Kaufman, and Route 34 runs through the central and southwestern part of the county. Near Kemp, the map labels Route 274 before the road network continues toward Mabank and the southeastern edge. Looking at the highway system this way avoids reducing the county to one east-west line: the northern I-20 corridor and the central U.S. 175 corridor connect different sets of communities.
This distinction is particularly useful when printing the map for route orientation. If the destination is Forney or Terrell, Interstate 20 gives the page an immediate reference line. If the destination is Kaufman, Crandall, Kemp, or the southern part of the county, U.S. 175 and the routes branching from Kaufman are more relevant. The map is not a live navigation product, but these labeled corridors make it easier to understand how the county’s named places relate to one another before consulting current driving directions.
The East Fork Trinity River defines the west, while creeks divide the interior
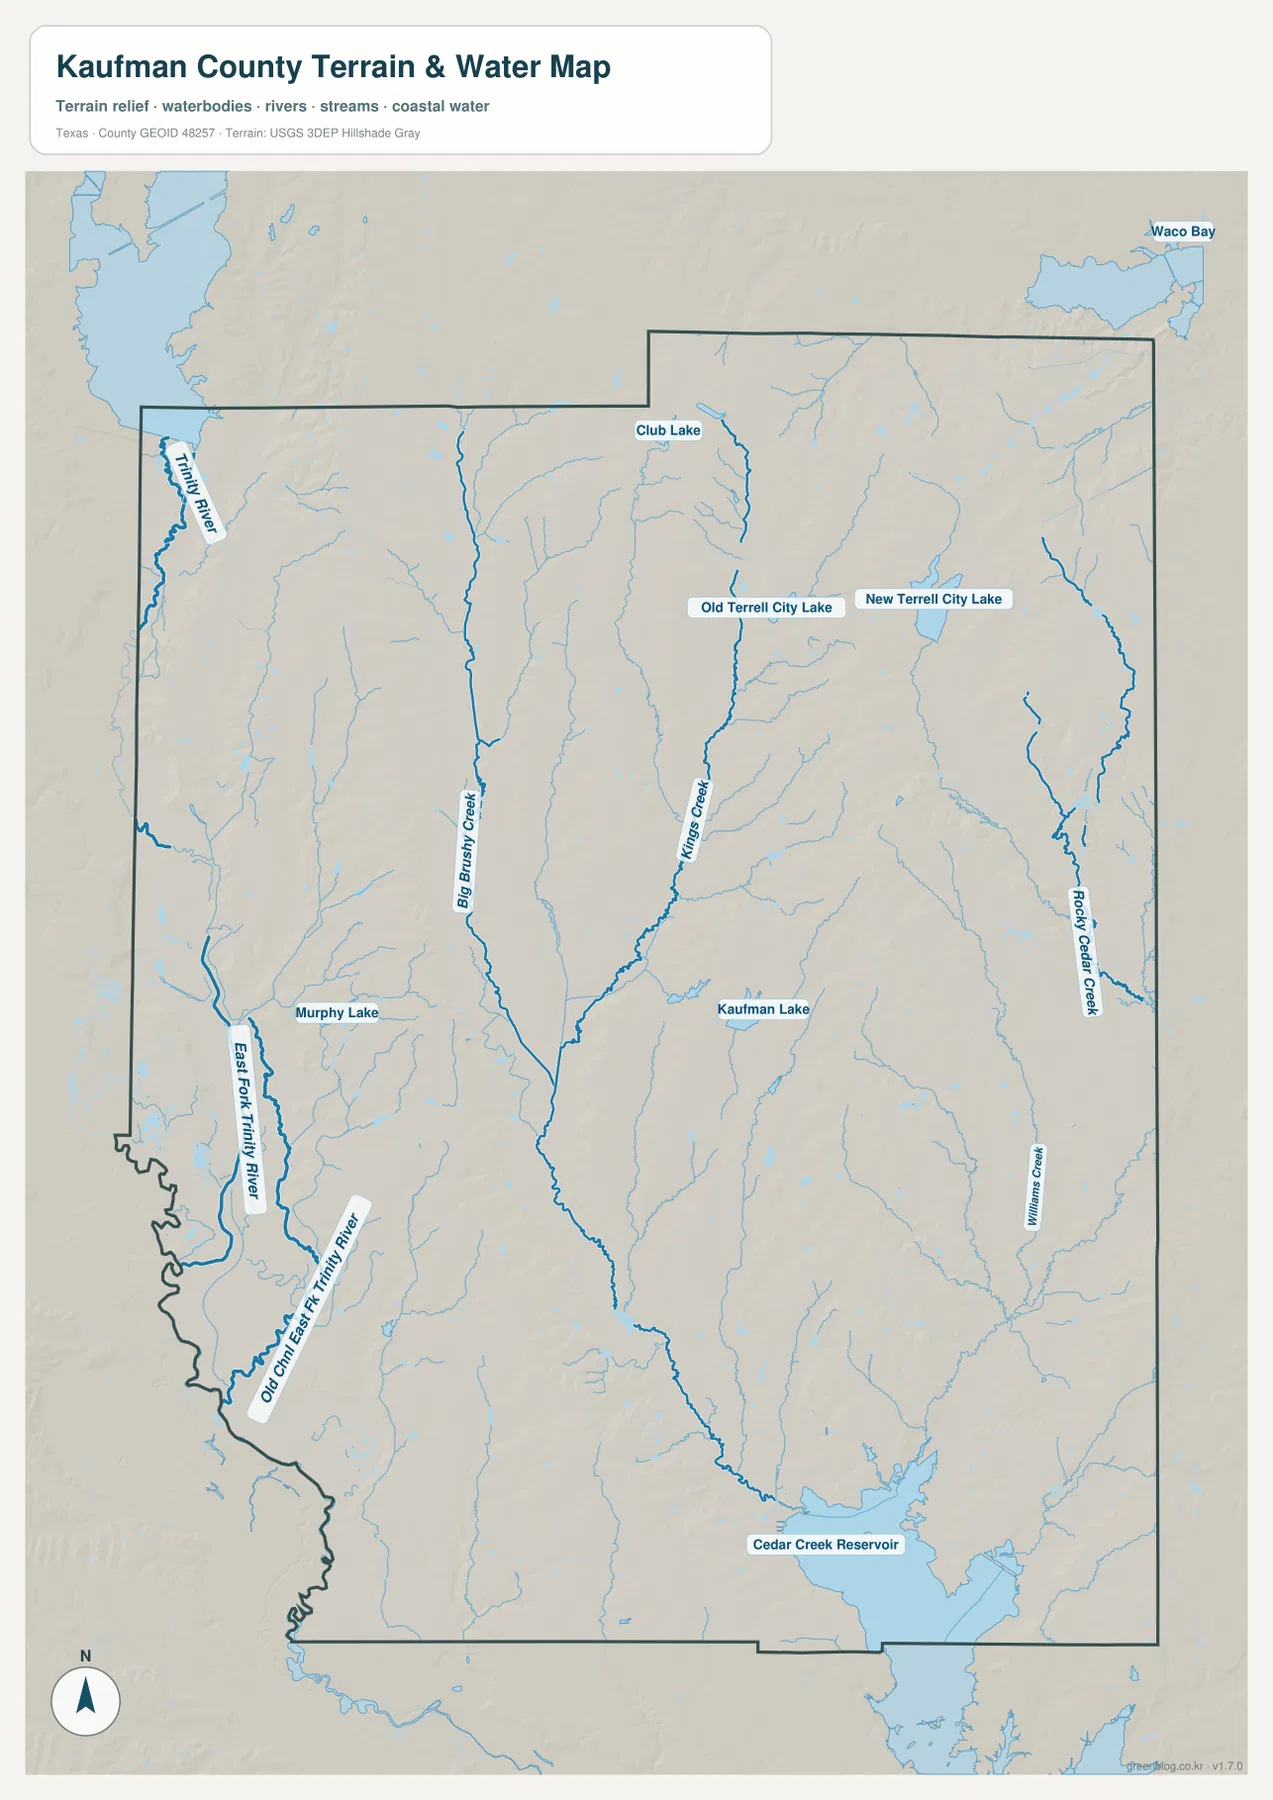
The water map replaces most road information with named channels and lakes. Along the western side, Trinity River and East Fork Trinity River labels follow a prominent winding channel. Near the southwest, the map also labels Old Channel East Fork Trinity River. This river corridor is one of the strongest natural reference features in the package because it runs close to the county edge for a substantial distance. Murphy Lake is also marked nearby, adding a smaller water feature to that western drainage area.
Farther inside the county, Big Brushy Creek runs through the central-western area, while Kings Creek forms a long north-south feature closer to the center-east. Rocky Cedar Creek is prominent along the eastern side, and Williams Creek is labeled farther south. The northern part of the map includes Club Lake, and two separate water bodies near Terrell are identified as Old Terrell City Lake and New Terrell City Lake. Kaufman Lake is labeled closer to the center of the county. These names show why a general highway map alone cannot explain the local geography: numerous creeks and small lakes occupy the spaces between the main towns.
The largest open-water feature on this map is at the southeastern edge, where Cedar Creek Reservoir reaches the county boundary. Its broad blue area contrasts sharply with the narrow creek lines elsewhere. When Mabank is located first on the general county map and then compared with the water map, the relationship between the southeastern city area and Cedar Creek Reservoir becomes much easier to understand. For water-focused research or a classroom exercise, that side-by-side comparison is more informative than trying to extract every detail from a single map.
Higher ridges in the north and northeast contrast with lower western valleys
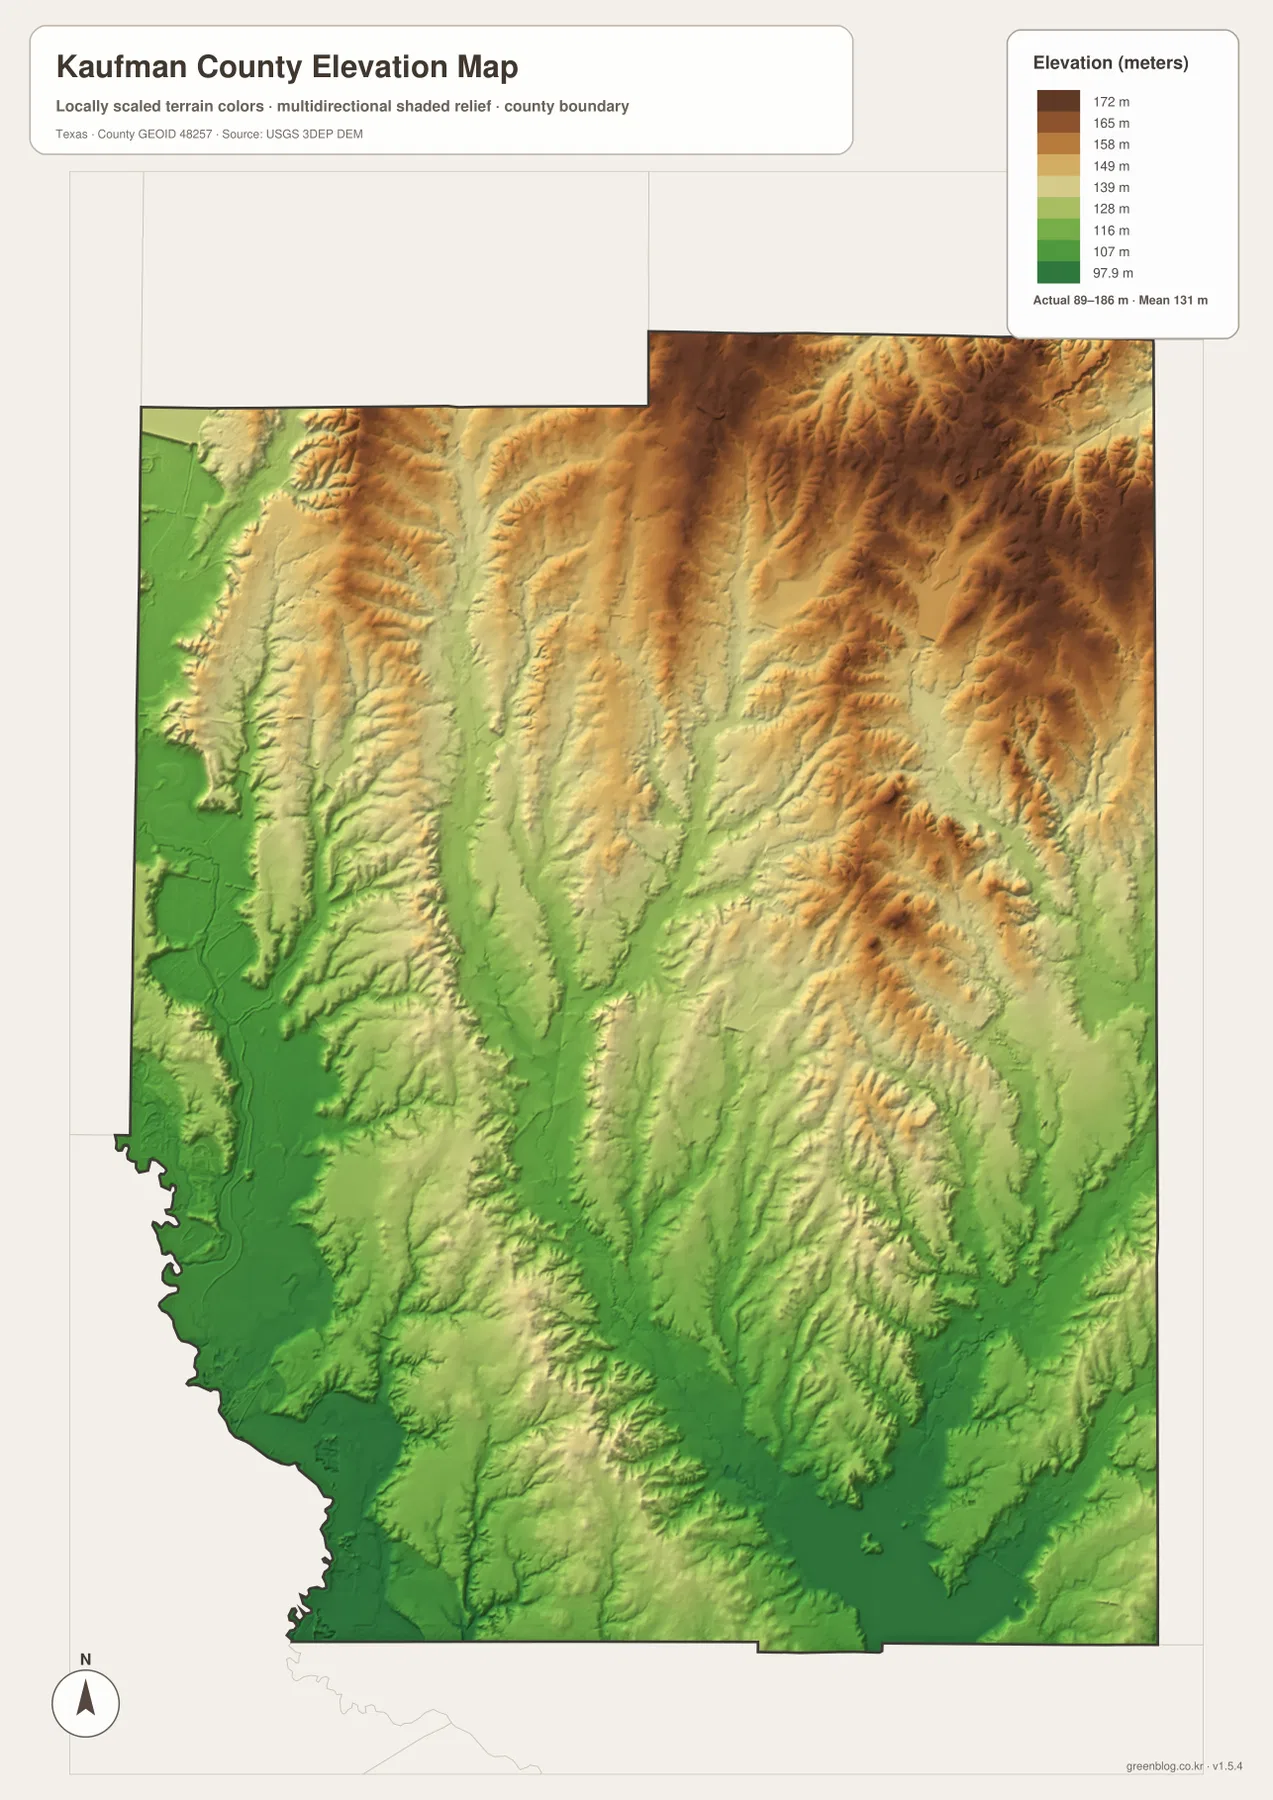
The elevation map uses a local color scale rather than city labels. Its legend reports an actual elevation range of about 89 to 186 meters and a mean of 131 meters. Green marks the lower end of the scale, while tan, orange, and brown indicate higher ground. The most conspicuous higher terrain is across much of the north and northeast, where broad brown ridges are cut by narrow valleys. This relief is difficult to appreciate on the general county map because roads and place names take visual priority there.
The western and southwestern portions contain much broader green areas, and several low corridors extend inward along the drainage network. The center and south are not completely flat; they contain narrow ridges and branching valleys, but the color pattern is generally lower than the darkest northern uplands. Comparing the water map with the elevation map helps explain the shapes. Big Brushy Creek, Kings Creek, and other channels occupy low paths, while higher ground forms elongated ridges between neighboring drainage lines.
The map therefore does not support a simple description such as “the county rises steadily from west to east.” The actual pattern is more varied: a low western river zone, several central valleys, and a complicated set of higher ridges toward the north and northeast. The 131-meter mean is useful as a summary, but the shaded relief reveals much more local variation. These colors are suitable for general geographic reference; they should not be used in place of site-specific surveying, engineering elevations, or current flood information.
Use each map for a different question, or compare the same location across all four
For a first look at the county, the general map is the most efficient choice because it combines towns, major roads, streams, nearby places, and the county outline. The city map is cleaner when the goal is simply to compare Forney, Terrell, Kaufman, Mabank, Crandall, and Talty without a dense road background. If a creek, lake, or river name is the target, the water map is much easier to read because it emphasizes those labels. The elevation map is designed for a different task again: locating higher ridges, lower valleys, and the broad contrast between drainage corridors and uplands.
Using two maps together can answer questions that neither one handles as clearly by itself. For example, locate Terrell and Kaufman on the general map, then switch to the water map to see the creeks between and around those cities. Locate the western edge on the water map, then compare the same area on the elevation version to see how the East Fork Trinity River follows lower terrain. In the southeast, Mabank can be paired with Cedar Creek Reservoir. The city map is also useful as a simplified worksheet before students or readers move on to the denser road and hydrography layers.
The downloadable ZIP contains the A3 high-resolution JPG versions corresponding to the four maps shown on this page. They are more suitable than the smaller web previews for printing, enlarging details, or keeping an offline reference copy. They can support classroom geography, trip preparation, local-history notes, or general county research. Because the maps are static reference material, current road closures, legal property boundaries, land ownership, engineering elevations, and other time-sensitive or legally precise questions should be checked with the responsible official source.
Frequently Asked Questions
Where should I start when reading a Kaufman County map?
Start with Forney and Terrell in the north and trace Interstate 20 between them. Then move south to Kaufman and follow U.S. 175 through the central part of the county. Adding Mabank in the southeast gives you four strong reference points for understanding the county’s overall shape and road pattern.
Which water features stand out most on the Kaufman County water map?
The East Fork Trinity River is the strongest western reference. Big Brushy Creek, Kings Creek, and Rocky Cedar Creek divide the interior, while Cedar Creek Reservoir forms the largest broad water area at the southeastern edge. Several smaller named lakes near Terrell and Kaufman are also included.
What elevation range is shown for Kaufman County?
The supplied elevation map reports an actual range of about 89 to 186 meters and a mean of about 131 meters. Higher ridges are especially noticeable in the north and northeast, while lower terrain is more extensive along the western river zone and several stream valleys.
Sources and Reference Data
- USGS The National Map Viewer — Official U.S. Geological Survey map service for viewing terrain, hydrography, boundaries, and other geographic layers.
- U.S. Census Bureau TIGER/Line Shapefiles — Official geographic files for county boundaries, roads, and related features.
- USGS National Hydrography — Official information about U.S. rivers, streams, lakes, and hydrographic data.
- USGS 3D Elevation Program — Official elevation program information and terrain data resources.
Map File Information
The download ZIP contains four high-resolution A3 JPG files for Kaufman County: the general county map, city map, water map, and elevation map.
- File Type: ZIP containing 4 JPG maps
Related Maps
- Navarro County Texas map
- Rockwall County Texas map
- Van Zandt County Texas map
- Tarrant County Texas map
- Anderson County Texas map
Green Map creates custom-edited map images using open geographic data sources such as geoBoundaries, Natural Earth, OpenStreetMap, and government open data.
These maps are edited visual materials, not raw data files, and are provided for education, documents, presentations, and graphic reference.