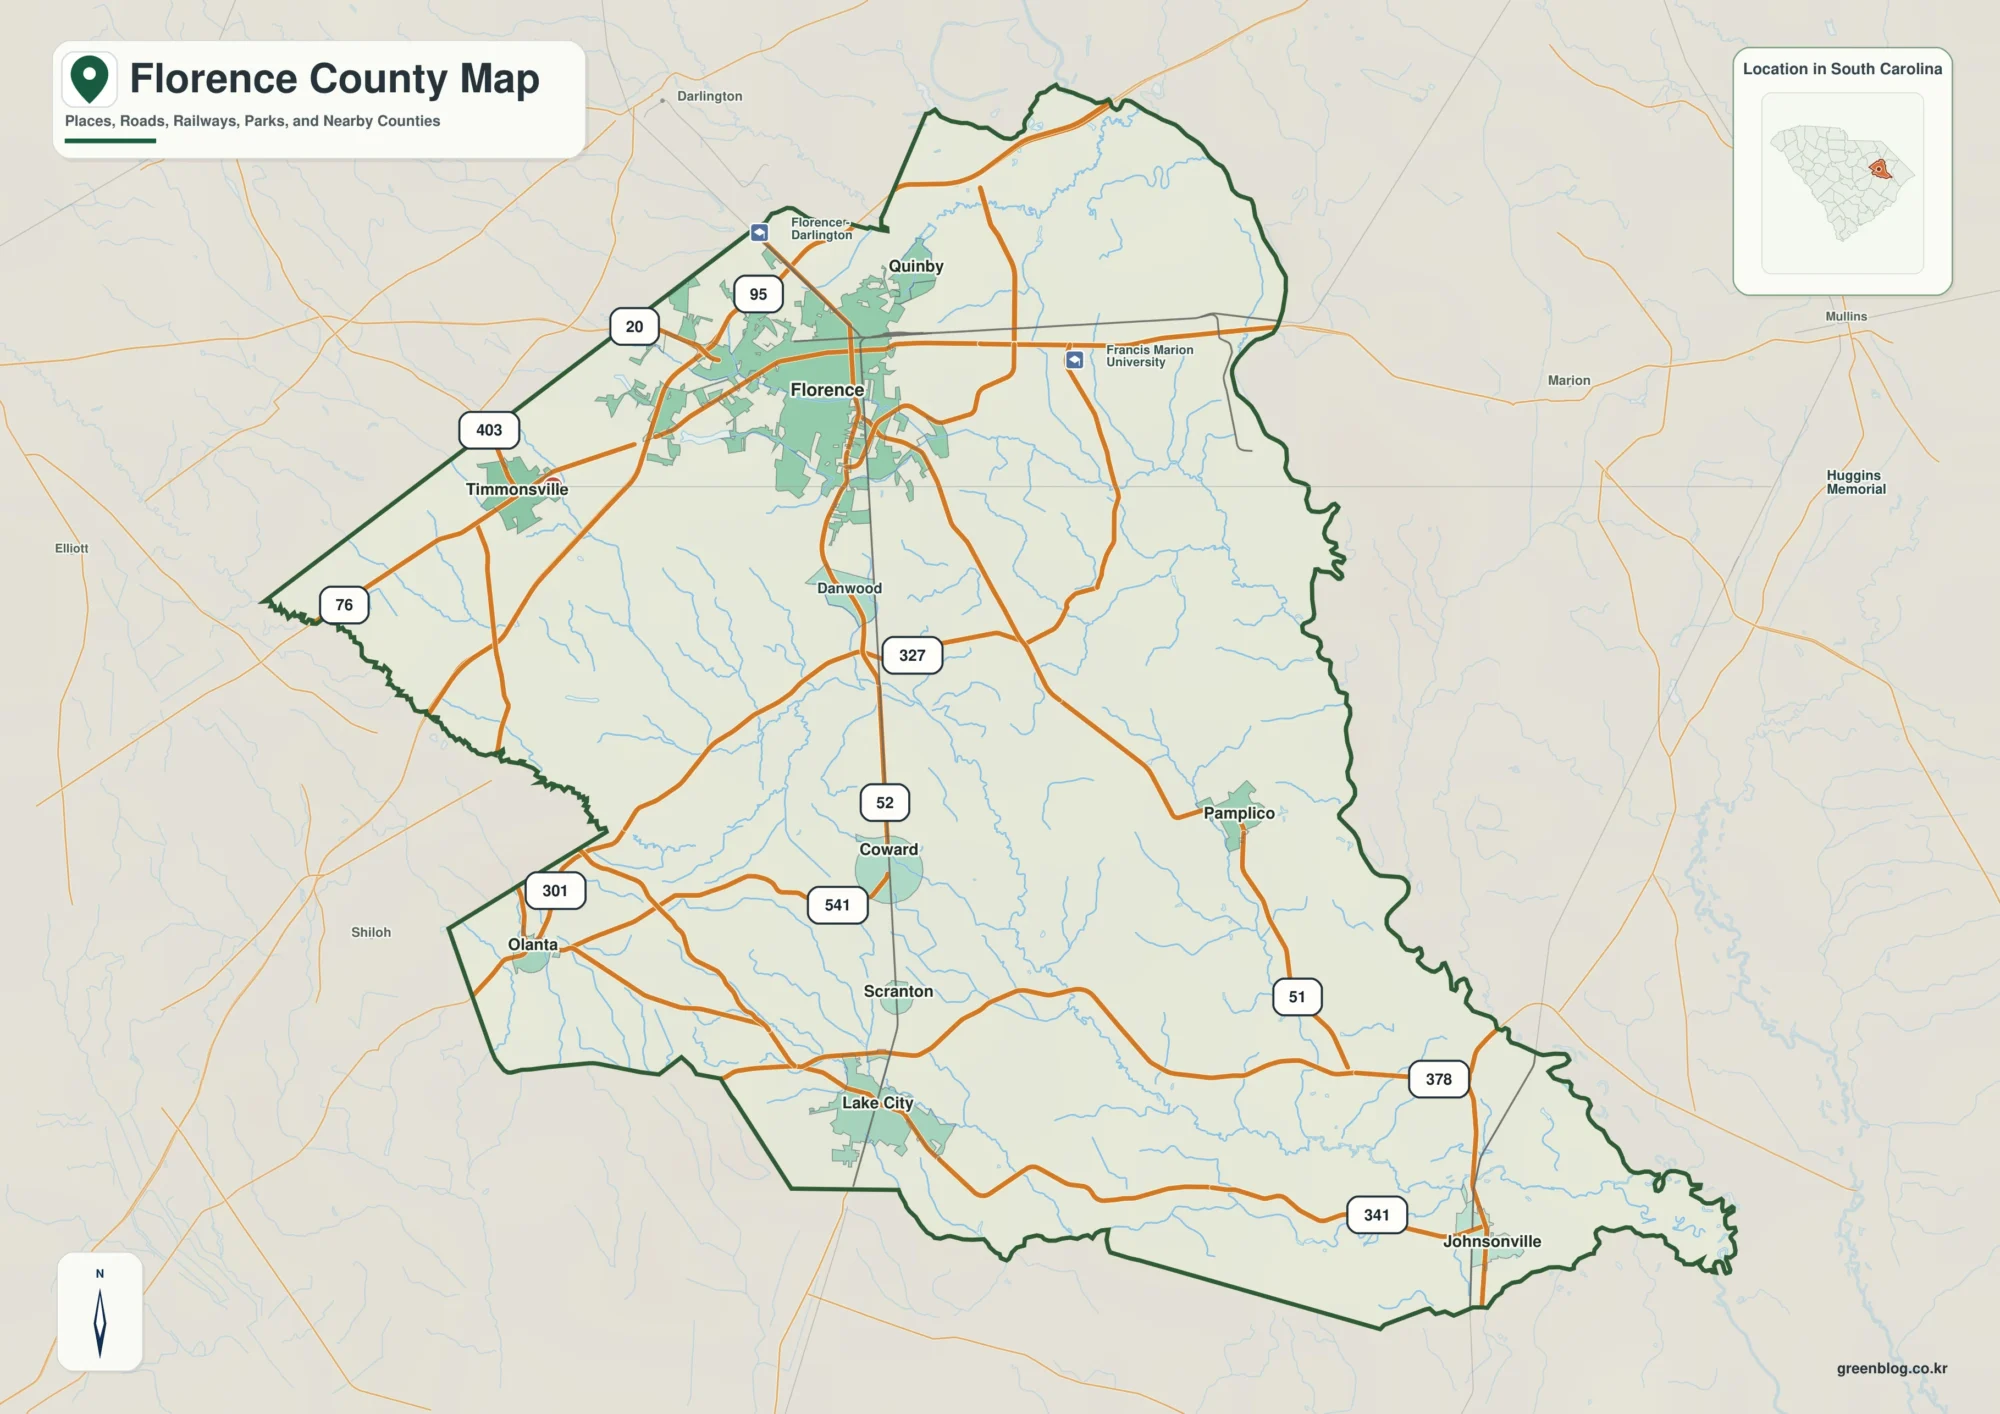
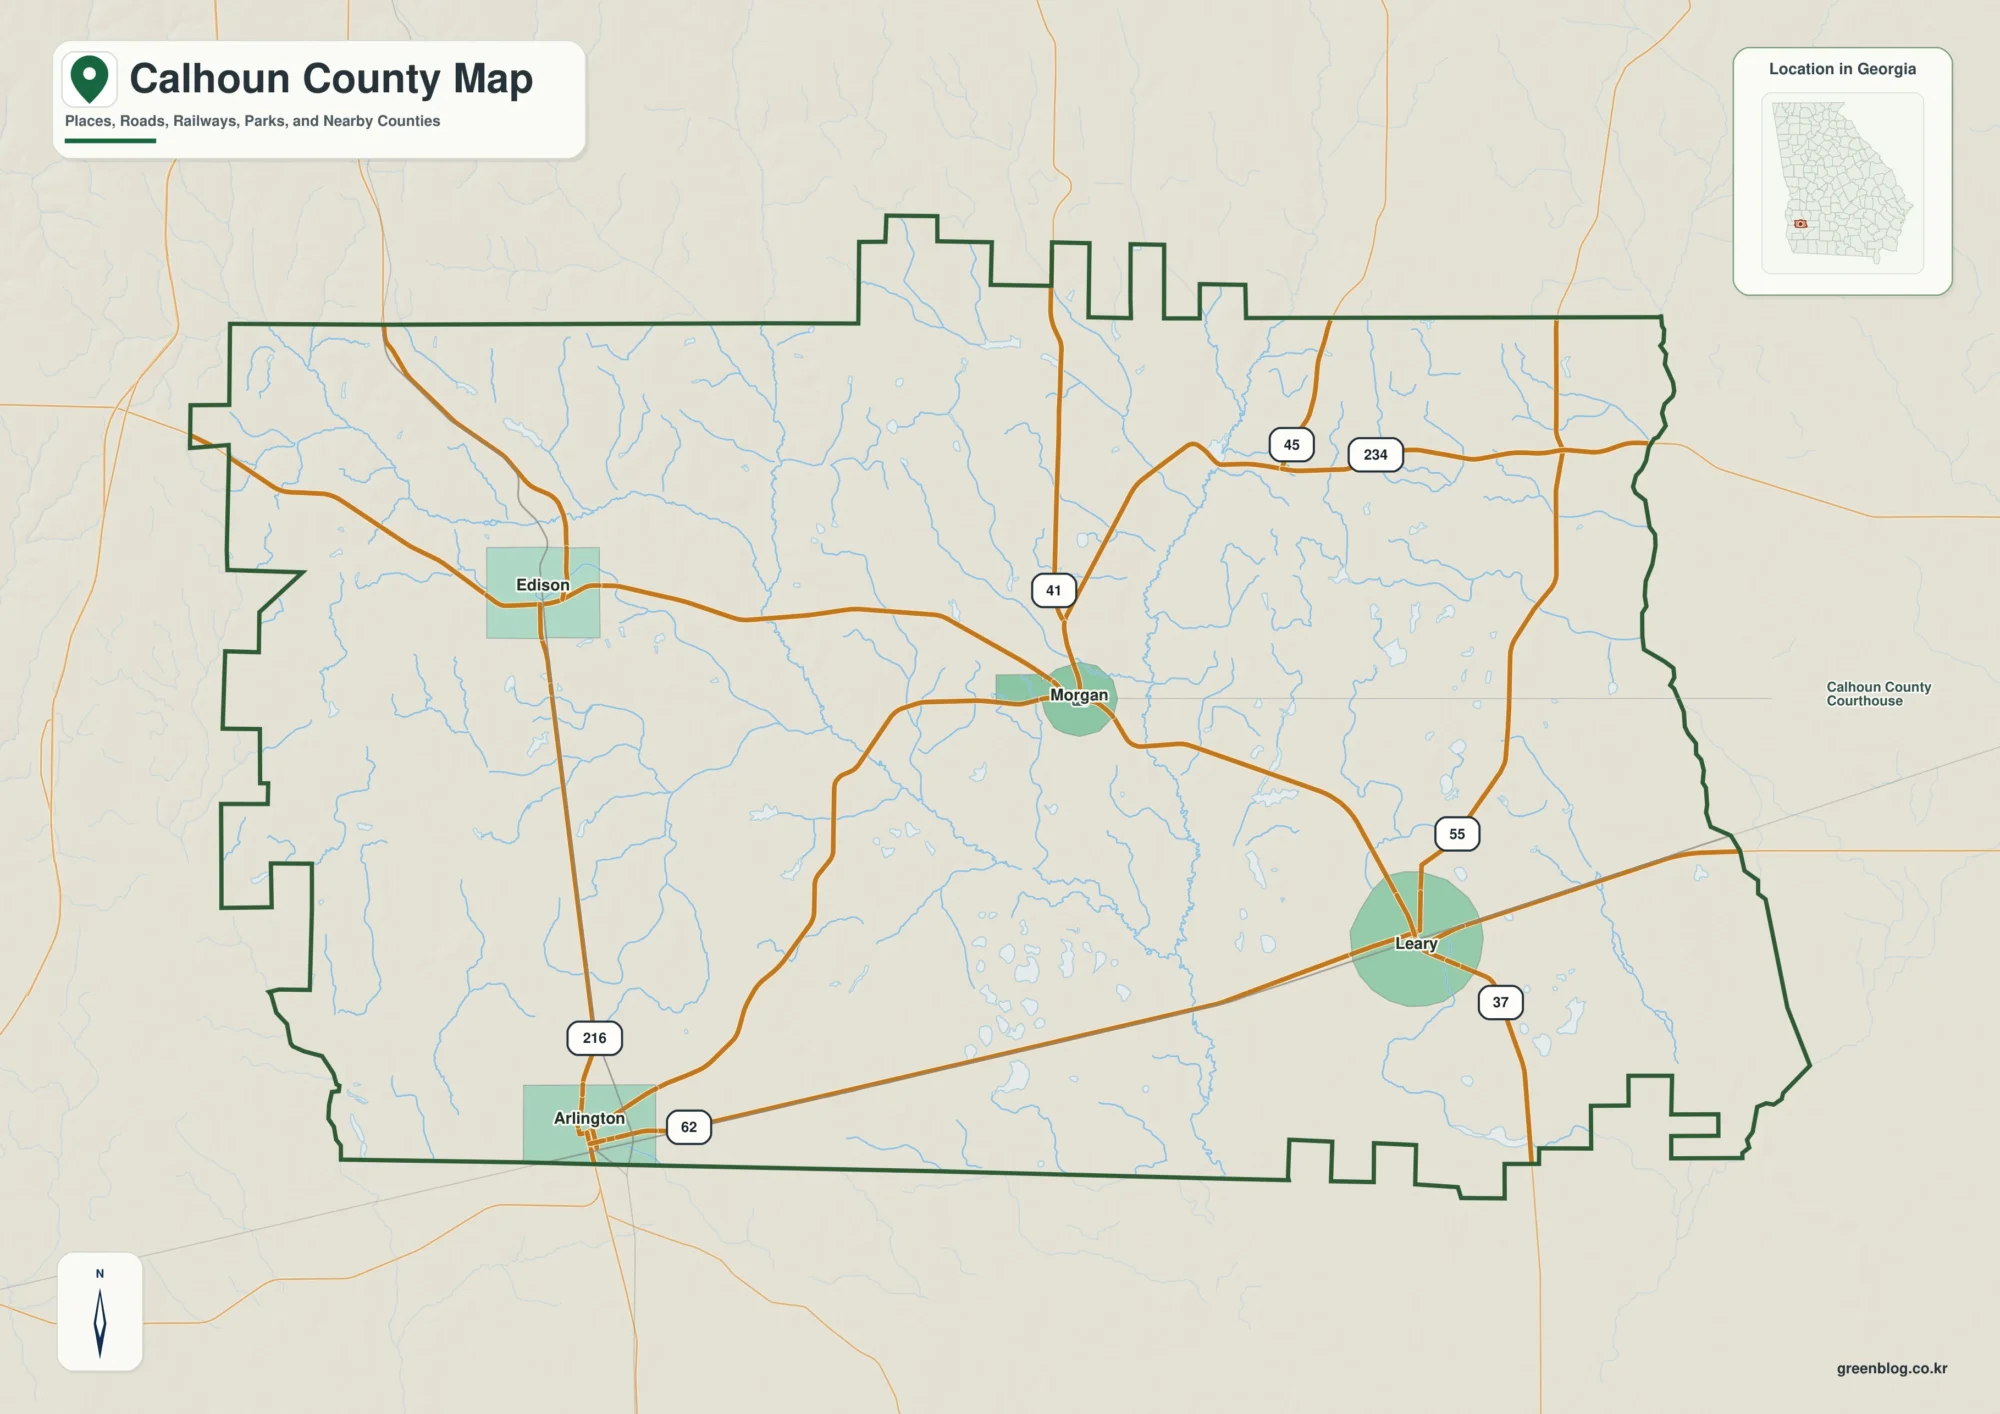
Hardeman County occupies a distinctive part of northwest Texas along the Oklahoma border. Quanah is the main reference point near the middle of the county, while Chillicothe lies farther east along U.S. 287. That east-west spacing is easy to see on the city map, but the water and elevation maps reveal why the county is more varied than a simple road outline suggests. The Red River marks the northern side, the Pease River crosses the southwestern part of the county, and numerous creeks carve smaller valleys between them. You can download the original A3 high-resolution JPG versions of the county, city, water, and elevation maps from the file box on this page.
The four supplied maps are most useful when read together rather than treated as interchangeable images. The county map gives roads, boundaries, and place labels; the city map makes the separation between Quanah and Chillicothe immediately clear. The terrain-and-water map names the Red River, Prairie Dog Town Fork Red River, Pease River, several Groesbeck Creek branches, and smaller streams. The elevation map reports an actual range of about 379 to 565 meters with a mean near 462 meters, showing higher western ground and lower terrain toward the east and along major channels.
Table of Contents
Quanah and Chillicothe Set the County’s Main East–West Scale
The ranked city map highlights only two major city labels, which makes it unusually clear as an orientation map. Quanah is ranked first and sits near the central part of Hardeman County, slightly toward the east, while Chillicothe is ranked second near the eastern side. The space between them matters because it shows that the county’s main population centers are not one continuous urban strip. Once both cities are located, the rest of the map becomes easier to read: west is the broad rural half beyond Quanah, and the Wilbarger County side lies beyond Chillicothe to the east.
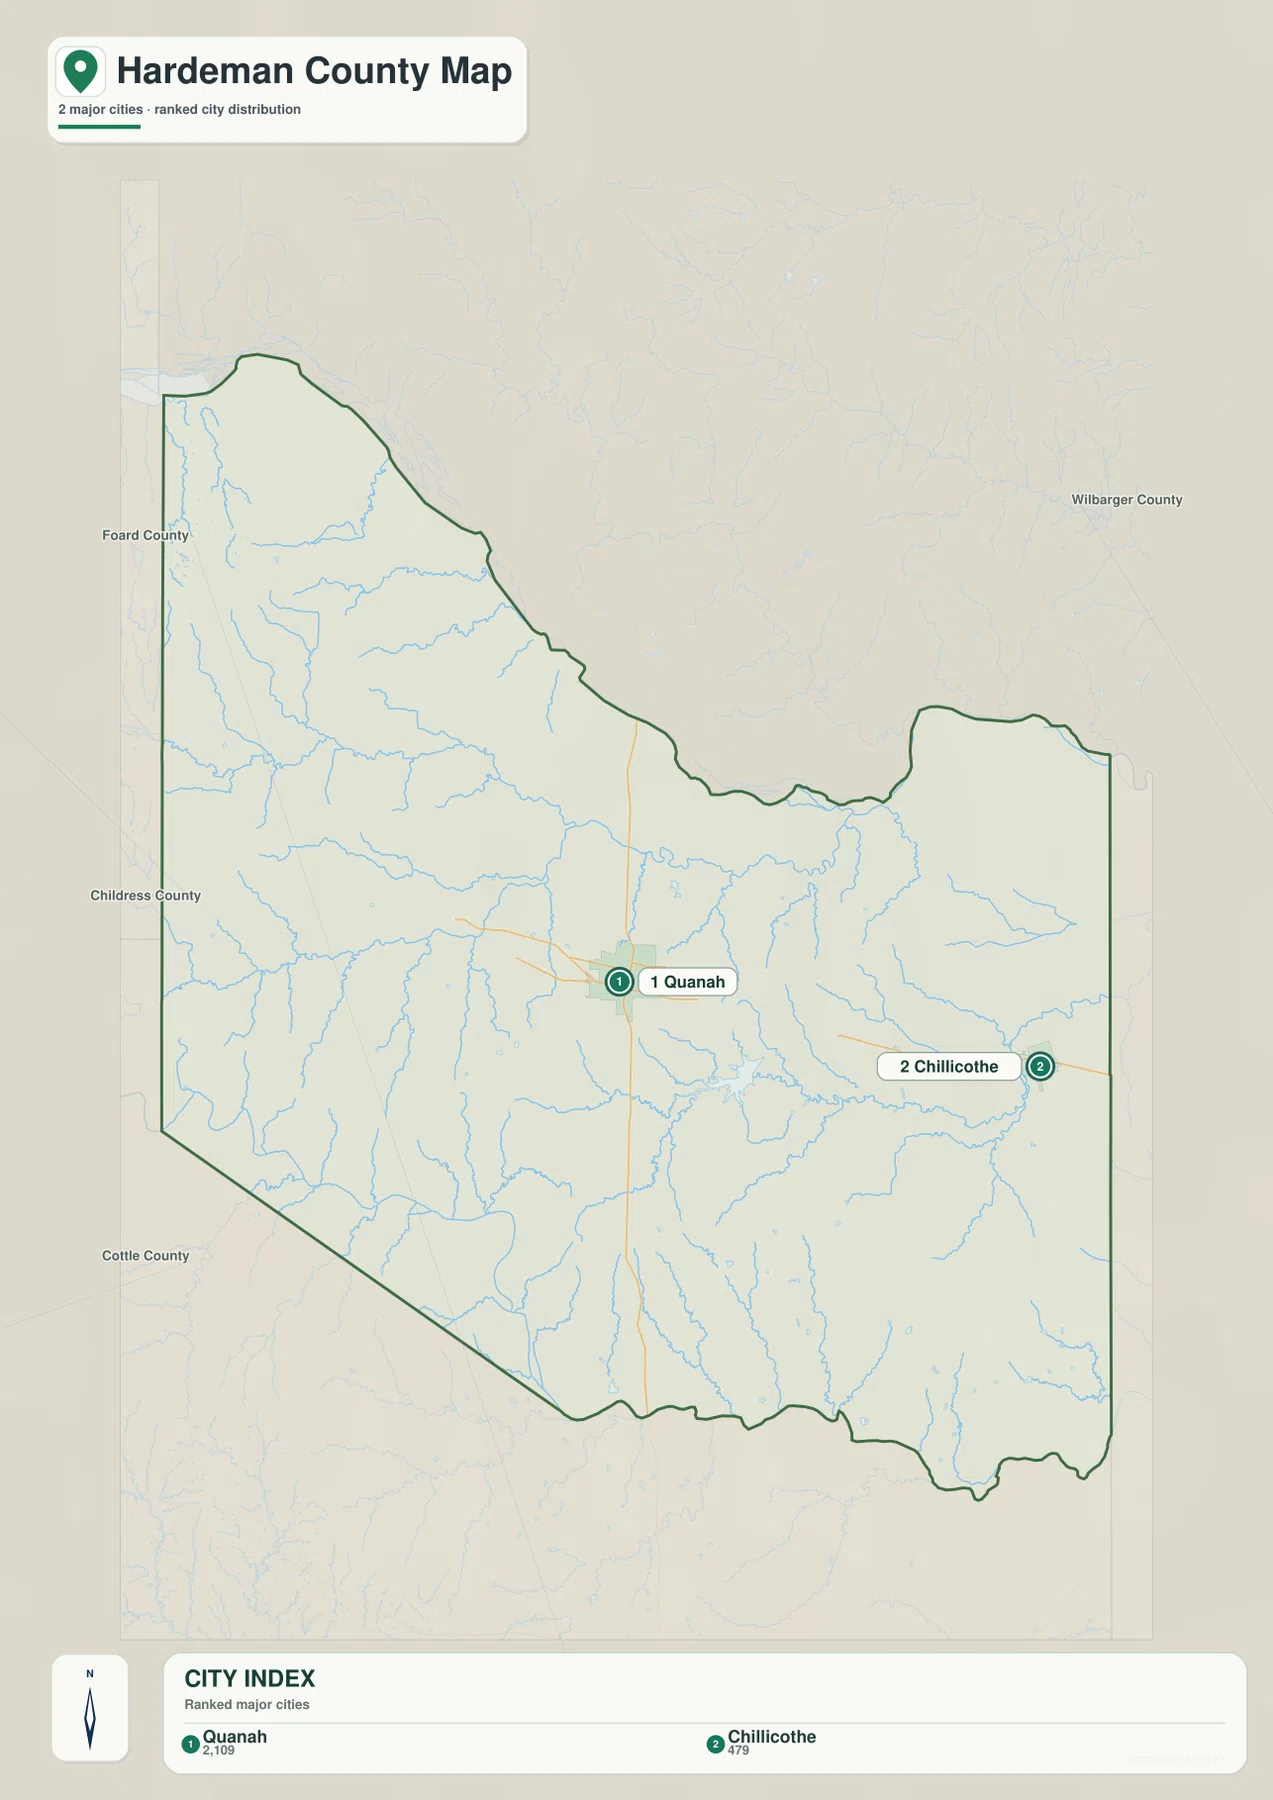
County names around the outside of the city map provide another layer of orientation. Foard, Childress, Cottle, and Wilbarger counties are labeled on the surrounding Texas sides, while Hardeman County’s northern boundary reaches the Oklahoma line. This is useful when following roads beyond the county border because a traveler leaving Quanah or Chillicothe does not stop at the administrative line. The edge labels show which neighboring area lies in each direction without requiring a second statewide map.
U.S. 287 Ties Quanah and Chillicothe Together on the General Map
On the general county map, U.S. 287 is the strongest east-west transportation reference. It passes through Quanah and continues toward Chillicothe, giving the two city markers a direct relationship that is easy to follow at a glance. Other roads cross the county in different directions around Quanah, but U.S. 287 is the clearest line for establishing the basic orientation. Readers looking at a printed copy can find Quanah first, trace the highway east to Chillicothe, and then use the county boundary to judge how much rural land extends in every other direction.
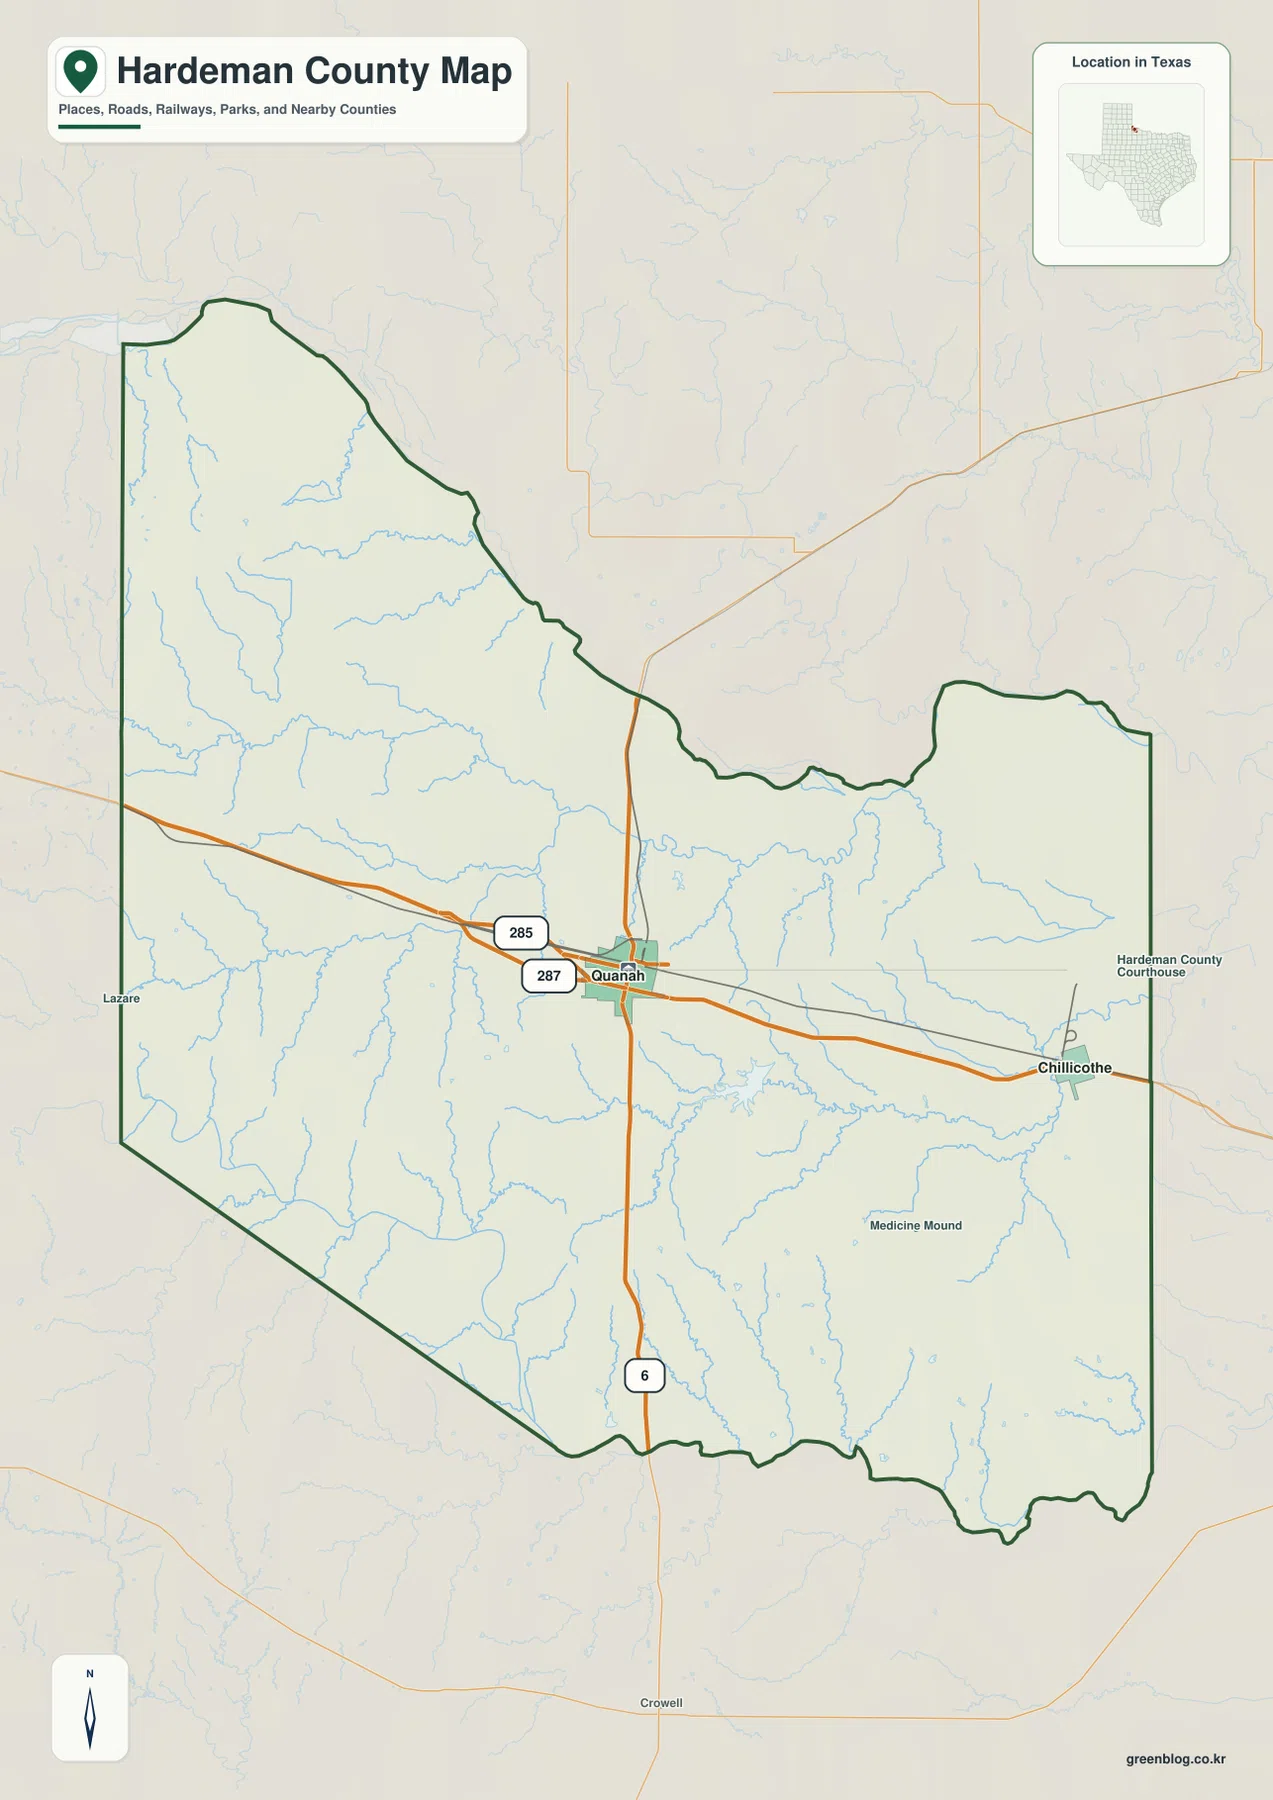
Smaller labels add local context without overwhelming the map. Medicine Mound appears in the southeastern portion of the county, and Lazare is labeled outside the western edge. Blue stream lines are visible beneath the road network, reminding the reader that the highways cross a landscape broken by many shallow and deeper drainage valleys. The map works well for county-scale location questions, but current road conditions, construction, and turn-by-turn travel should still be checked with up-to-date transportation information.
Red River, Pease River, and Groesbeck Creeks Divide the Rolling Terrain
The terrain-and-water map contains much more named hydrography than the general map. Red River is labeled along the northern side, and Prairie Dog Town Fork Red River enters from the east. Across the western and central part of the county, North Groesbeck Creek and South Groesbeck Creek form separate channels, with Groesbeck Creek also labeled nearer the center. Papoose Creek and Brooks Creek occupy the northwestern area. These names are useful because they correspond to valleys that are visible in the shaded terrain rather than appearing as isolated blue lines on a blank background.
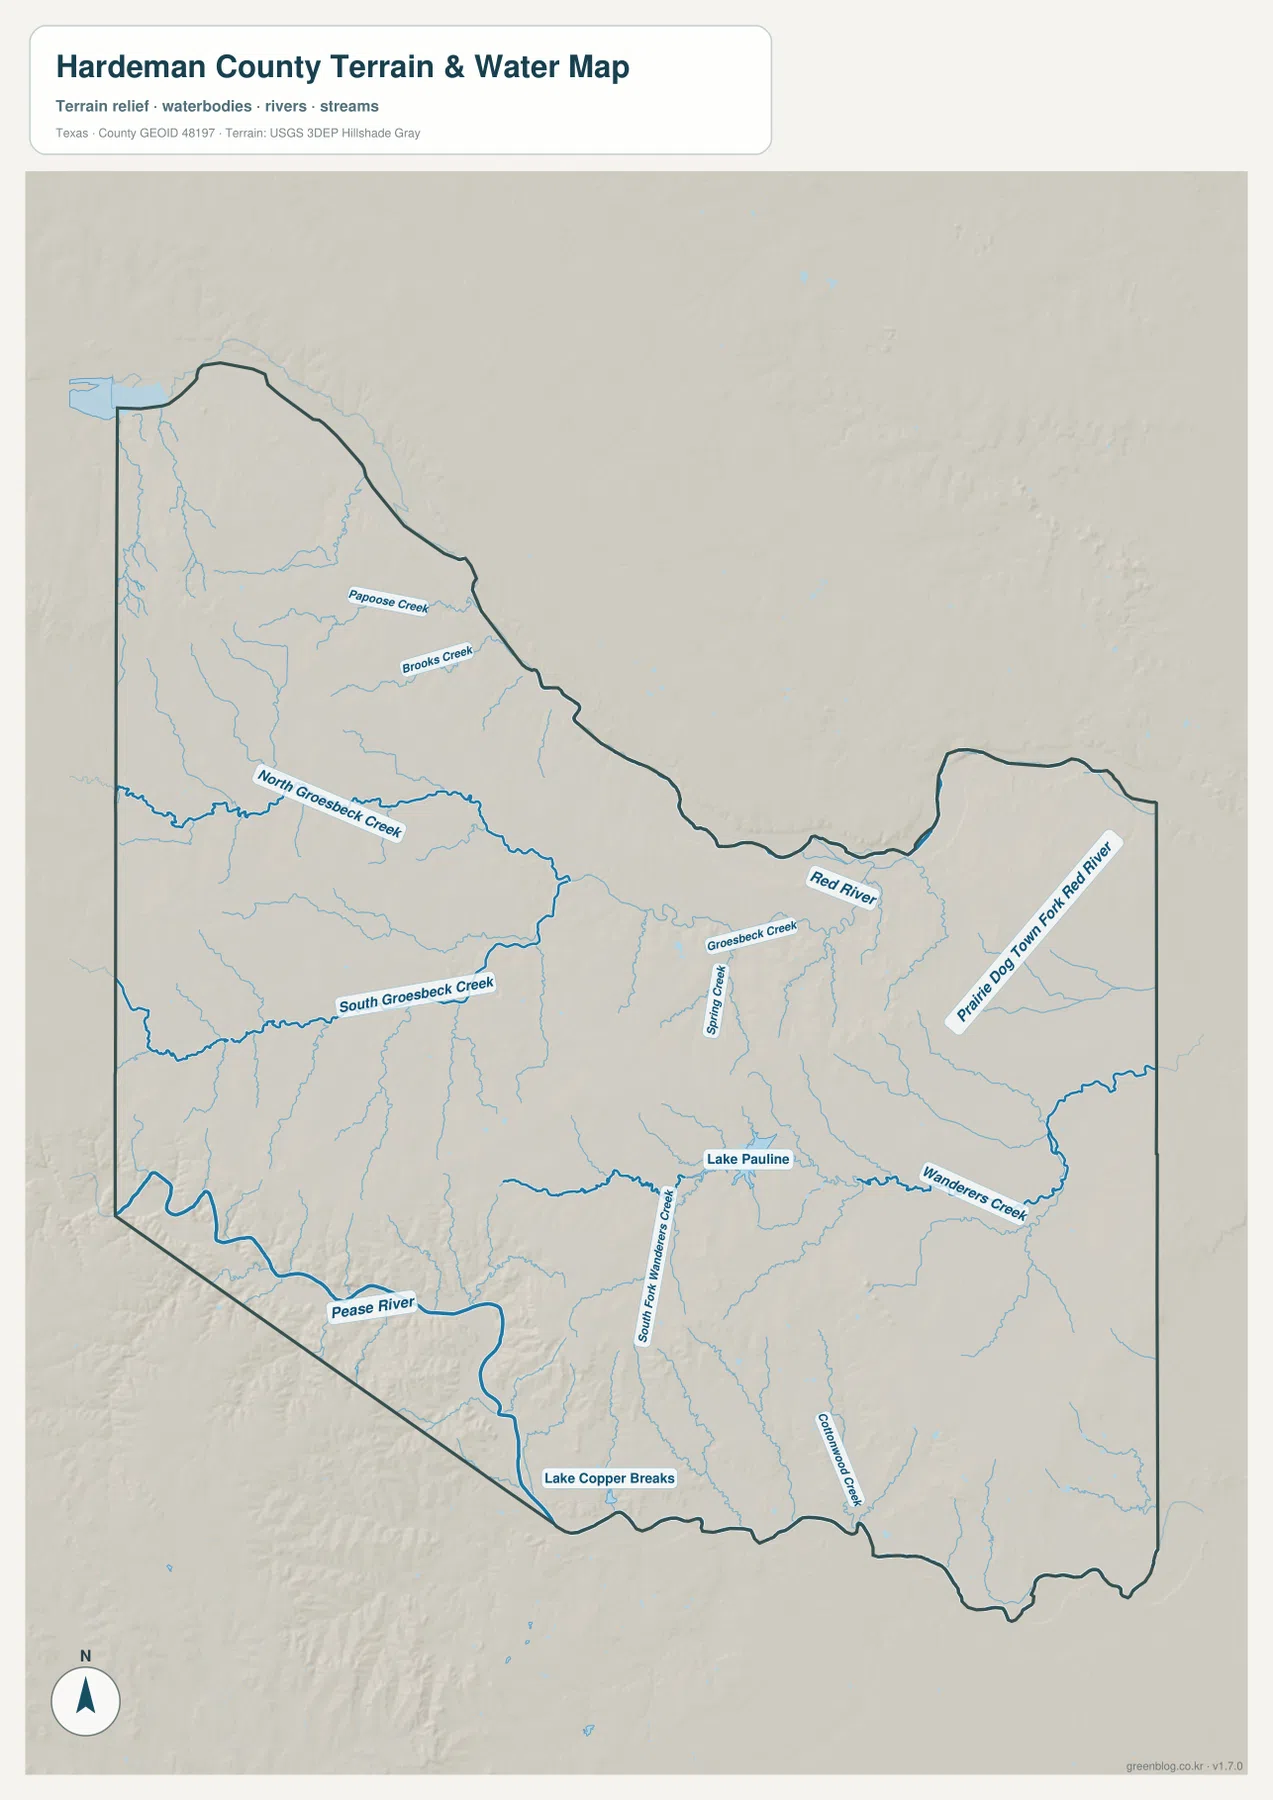
The Pease River is the strongest water feature in the southwest, where it follows a broad low corridor near the county boundary. Lake Pauline is marked farther east in the central-southern area, and Lake Copper Breaks appears close to the southern edge. Wanderers Creek is labeled on the eastern side, adding another separate drainage corridor before the terrain reaches the Wilbarger County direction. Rather than memorizing each stream name, readers can use the map to see how water has divided the county into a network of ridges and valleys. The map is a geographic reference, not a real-time source for water levels, flood conditions, access, or legal boundaries.
Higher Western Ground Gives Way to Lower Eastern Valleys
The elevation map provides a numerical scale for the relief visible on the water map. Its legend lists an actual elevation range of roughly 379 to 565 meters and a mean of about 462 meters. The highest colors cover much of the northwest and extend into other western uplands, while the eastern half contains more green, indicating lower ground. The Red River side and the valley of the Pease River also stand out as lower corridors cut into the surrounding surface.
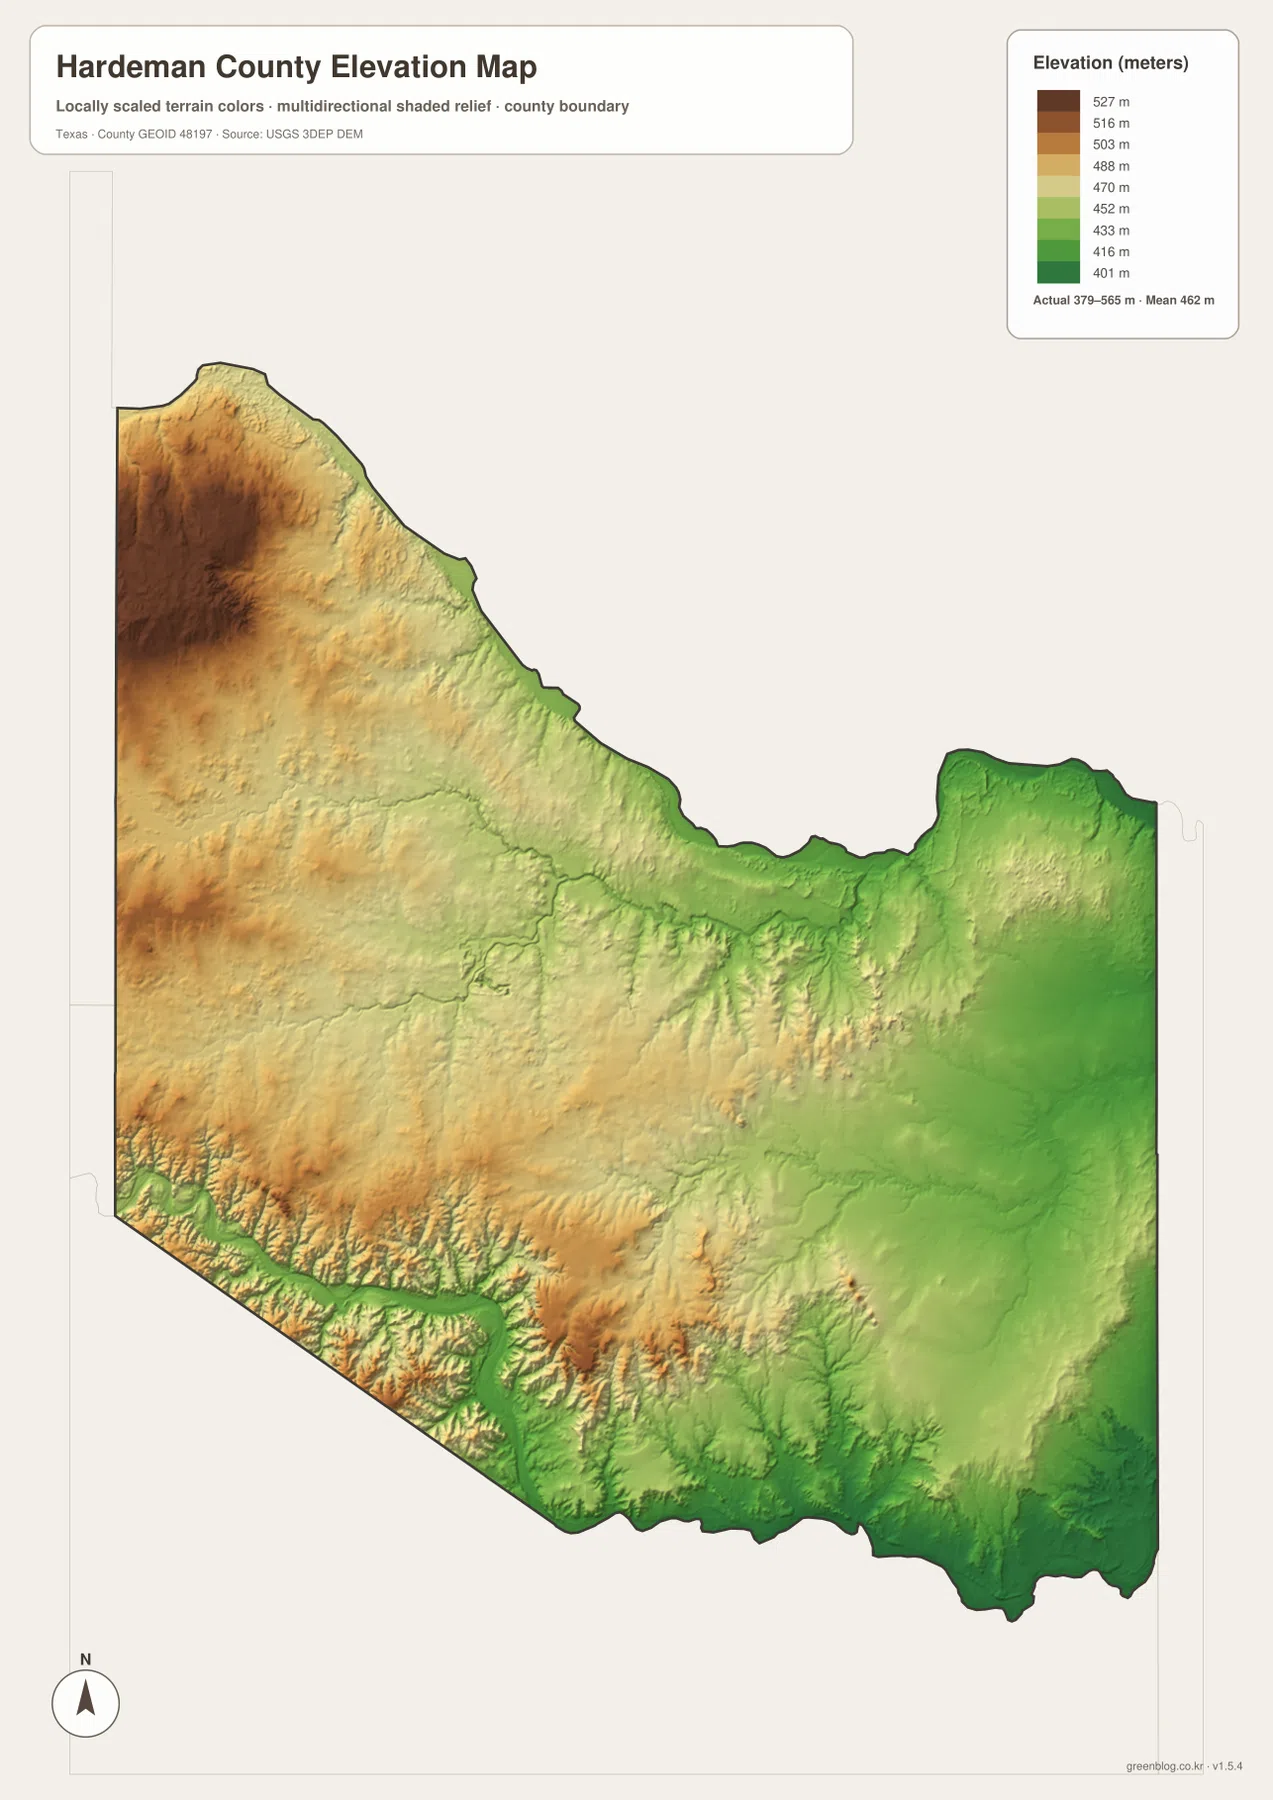
The shaded relief is particularly useful for seeing features that a road map tends to hide. Groesbeck Creek and its branches occupy elongated depressions across the middle of the county, while the Pease River cuts through a more pronounced corridor in the southwest. Narrow tributary valleys branch away from these larger channels, so the landscape is not one smooth slope from west to east. The elevation colors should be read as a county-scale comparison; they are not survey-grade measurements for a parcel, construction site, or engineering project.
Choose the Map That Matches the Question You Need to Answer
Use the city map when the goal is simply to compare Quanah with Chillicothe and understand where Hardeman County sits among its neighbors. The general county map is better when U.S. 287, smaller roads, and the boundary need to be seen together. For named rivers, creeks, lakes, and their relationship to terrain, the water map provides the most detail. The elevation map is the quickest way to compare the higher western ground with the lower eastern and river-cut areas. Looking at the same location on two or more maps often explains the county more clearly than relying on one layer alone.
The WebP versions in the article are convenient for on-screen reference. For printing, classroom use, reports, or offline work, the original JPG files provide a larger A3 format. The ZIP below contains the county map, city map, terrain-and-water map, and elevation map that are actually supplied for this page, so the full set can be kept together or individual files can be used separately.
Frequently Asked Questions
Which cities should I locate first on a Hardeman County map?
Start with Quanah near the central part of the county and Chillicothe farther east. U.S. 287 connects the two city labels, so finding that road and the two cities gives you a simple east-west reference before you begin examining creeks, elevation, or neighboring counties.
Which waterways are most useful for understanding Hardeman County?
The Red River along the north and the Pease River in the southwest are the largest references on the supplied water map. North and South Groesbeck creeks, Prairie Dog Town Fork Red River, and several smaller creeks fill the space between them and help explain the branching valleys visible on the elevation map.
What elevation range is shown on the Hardeman County elevation map?
The legend reports an actual range of about 379 to 565 meters, with a mean near 462 meters. The west and northwest are generally higher, while lower colors become more common toward the east and along the Red River, Pease River, and creek valleys.
Sources and Reference Data
County boundary and base geography can be checked through U.S. Census Bureau TIGER/Line Shapefiles. Named rivers and streams can be compared with USGS National Hydrography, while elevation data are available through the USGS 3D Elevation Program. For an interactive view combining terrain and place references, see USGS The National Map Viewer.
Map File Information
Download one ZIP containing four original A3 high-resolution JPG files for Hardeman County: the county map, city map, terrain-and-water map, and elevation map.
- File Type: JPG
Related Maps
- Wilbarger County Texas map
- Motley County Texas map
- Victoria County Texas map
- Wharton County Texas map
- Wheeler County Texas map
Green Map creates custom-edited map images using open geographic data sources such as geoBoundaries, Natural Earth, OpenStreetMap, and government open data.
These maps are edited visual materials, not raw data files, and are provided for education, documents, presentations, and graphic reference.