A New Hampshire map has to fit two very different patterns onto one tall page: the enormous northern reach of Coos County and a tighter group of counties around the Lakes Region, Merrimack Valley, and short Atlantic coast. The supplied portrait images show all 10 counties, making it possible to compare that north–south contrast without reducing the state to a plain silhouette.
The collection provides a labeled color map, a labeled black-and-white map, and an unlabeled county-boundary version. The color preview measures 1200 × 1785 pixels; the other two measure 1200 × 1784. Their near-identical proportions suit an A3-style portrait page, although the previews themselves do not confirm the dimensions or formats of every file inside the protected ZIP archive.
Each labeled New Hampshire map also supplies regional context. Vermont appears to the west, Maine to the east, Massachusetts to the south, and the Atlantic Ocean beside the southeastern coast. New Hampshire also reaches the Canadian province of Quebec at its northern border, but Canada and Quebec are not labeled in these images. Readers should not interpret the missing northern label as a missing international boundary.
Table of Contents
New Hampshire Map Overview
New Hampshire has 10 active counties: Belknap, Carroll, Cheshire, Coos, Grafton, Hillsborough, Merrimack, Rockingham, Strafford, and Sullivan. The county names are all present on the color and monochrome versions. The U.S. Census Bureau notes that these counties remain active geographic entities, although county government in the state provides only a limited set of services.
Reading the New Hampshire map from north to south begins with Coos, which fills the entire upper section. Grafton occupies the west-central side below it, and Carroll forms the corresponding east-central area. Belknap is comparatively small and wraps around part of the prominent lake shape near the center. That water feature is visible but unlabeled, so the artwork should not be treated as a complete hydrographic reference.
The southern half contains six counties in closer quarters. Sullivan runs along part of the Vermont side; Cheshire occupies the southwest; Hillsborough spans much of the south-central area; Merrimack lies above it; Strafford reaches the eastern side; and Rockingham includes the southeastern coast. The map shows county adjacency clearly, but it does not plot Concord, Manchester, Nashua, Portsmouth, county seats, or any other city locations.
Physical geography helps explain the layout but is not drawn here. The White Mountains and much of the Great North Woods lie in the northern part of the state, the Lakes Region centers on several central counties, and the Seacoast is concentrated in the southeast. Because the supplied images omit terrain, roads, and regional labels, users should add those topics only from a current authoritative source.
Included Map Files
The three body images use the same county geometry and portrait composition but carry different amounts of information. That makes version selection straightforward:
- Color county map: 10 labeled counties in contrasting pastel fills, three neighboring states, and the Atlantic Ocean.
- Black-and-white county map: the same county and regional labels, with boundaries emphasized instead of color.
- Blank-label county map: state and county lines without geographic names or colored county fills.
Choose color for rapid county recognition, monochrome for a labeled document or answer key, and the blank-label version for recall or custom data. None of the three includes a legend, north arrow, distance scale, coordinates, highways, rail lines, elevation shading, county-seat symbols, or municipal boundaries. They are county reference graphics rather than navigation maps.
Color County Map for Regional Comparison
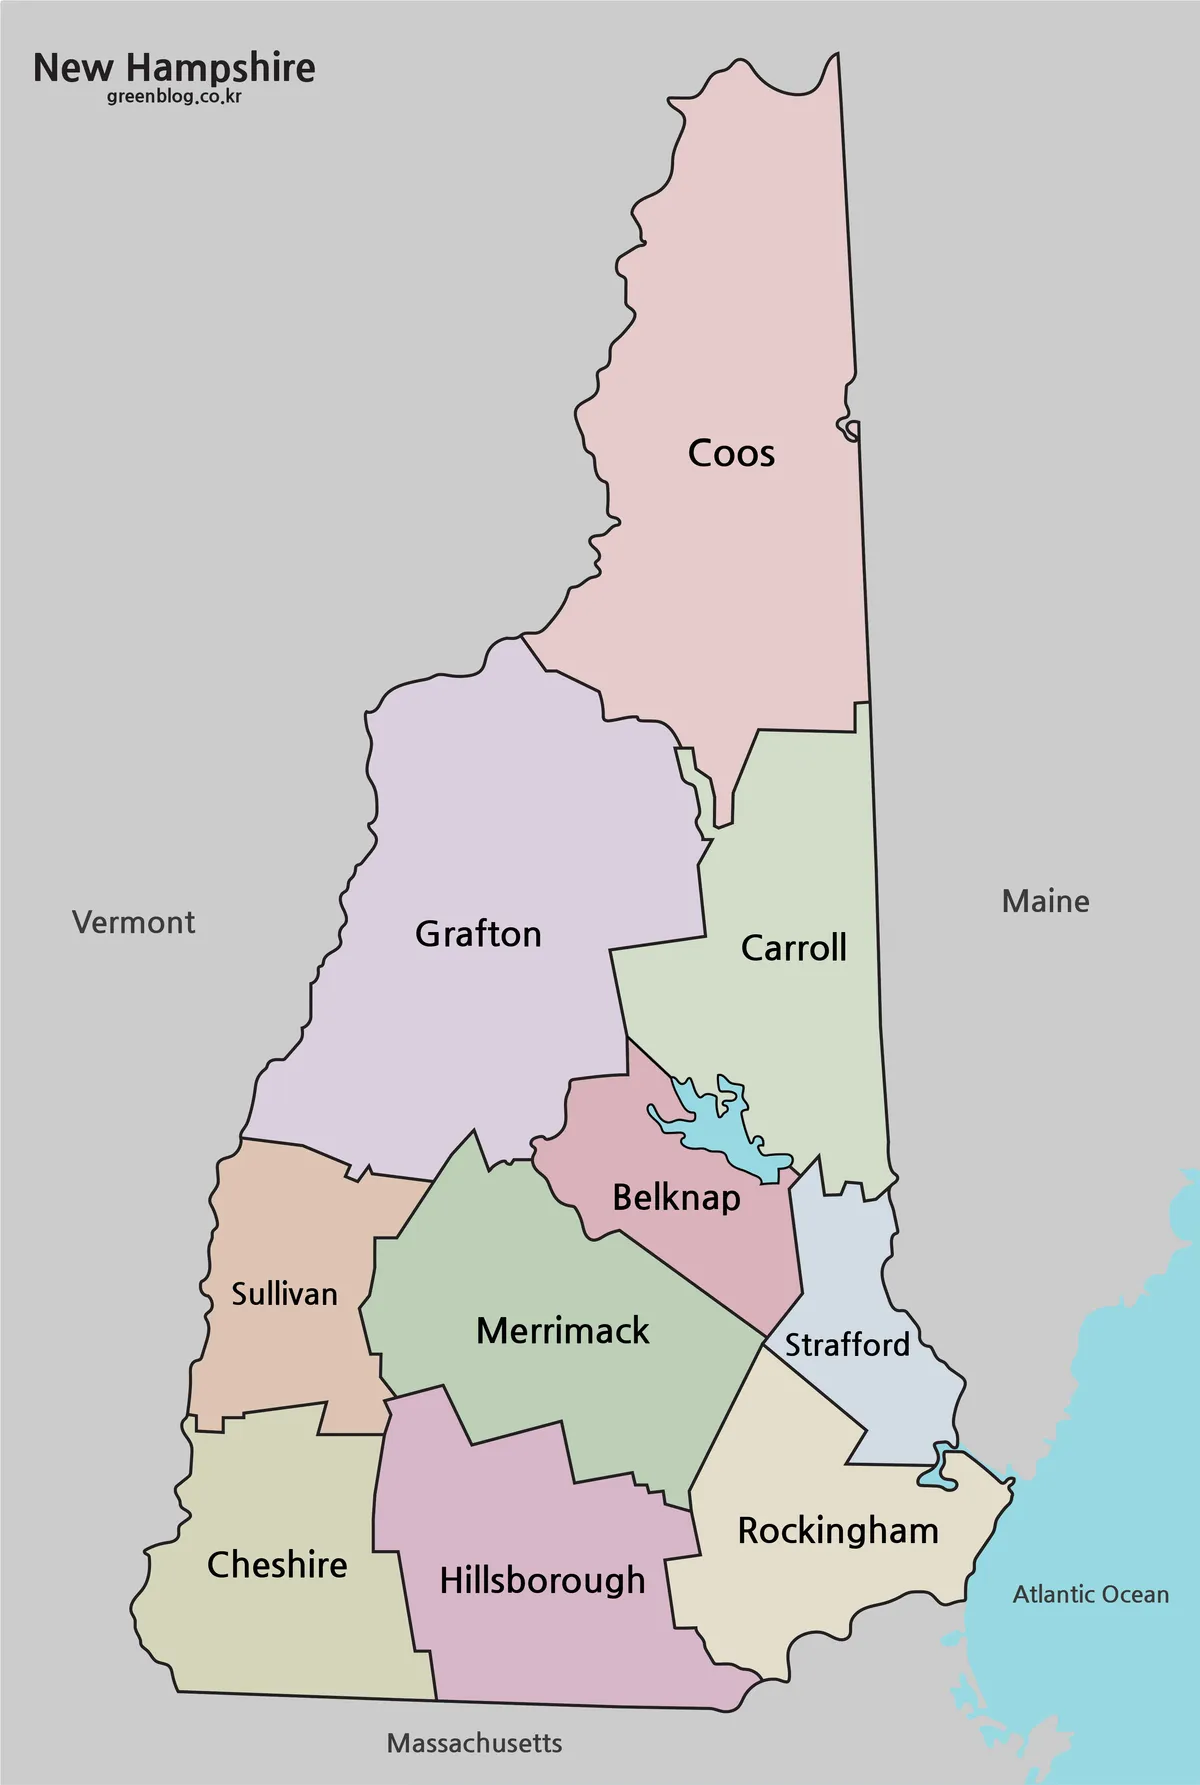
The color image gives every county a separate pastel fill. These colors are categorical only: they distinguish neighboring polygons but do not represent population, land area, election results, elevation, climate, or administrative rank. Coos appears especially dominant because of its real spatial extent on the page, not because its pink fill carries a higher value.
The state’s internal structure is easiest to read where central and southern counties meet. Belknap sits above Merrimack and west of Strafford; Carroll is north of both Belknap and Strafford; and Rockingham reaches the coast below Strafford. In the west, Grafton connects the large northern county to Sullivan, while Cheshire and Hillsborough share the long Massachusetts edge.
Use the color New Hampshire map when a presentation needs quick regional comparison. A teacher can trace the transition from Coos to Grafton and Carroll, identify the compact central counties around the lake shape, and finish with the southern tier. If the fills are replaced with statistical colors, add a legend, cite the dataset and year, and verify that all values use the county level.
The blue water shape near Belknap and Carroll provides helpful visual orientation, as does the blue Atlantic area beside Rockingham. However, the lake is not named, rivers are absent, and the coastline is simplified for context. A lesson about waterways should use a dedicated hydrologic source alongside this county image.
Black and White Printable Version
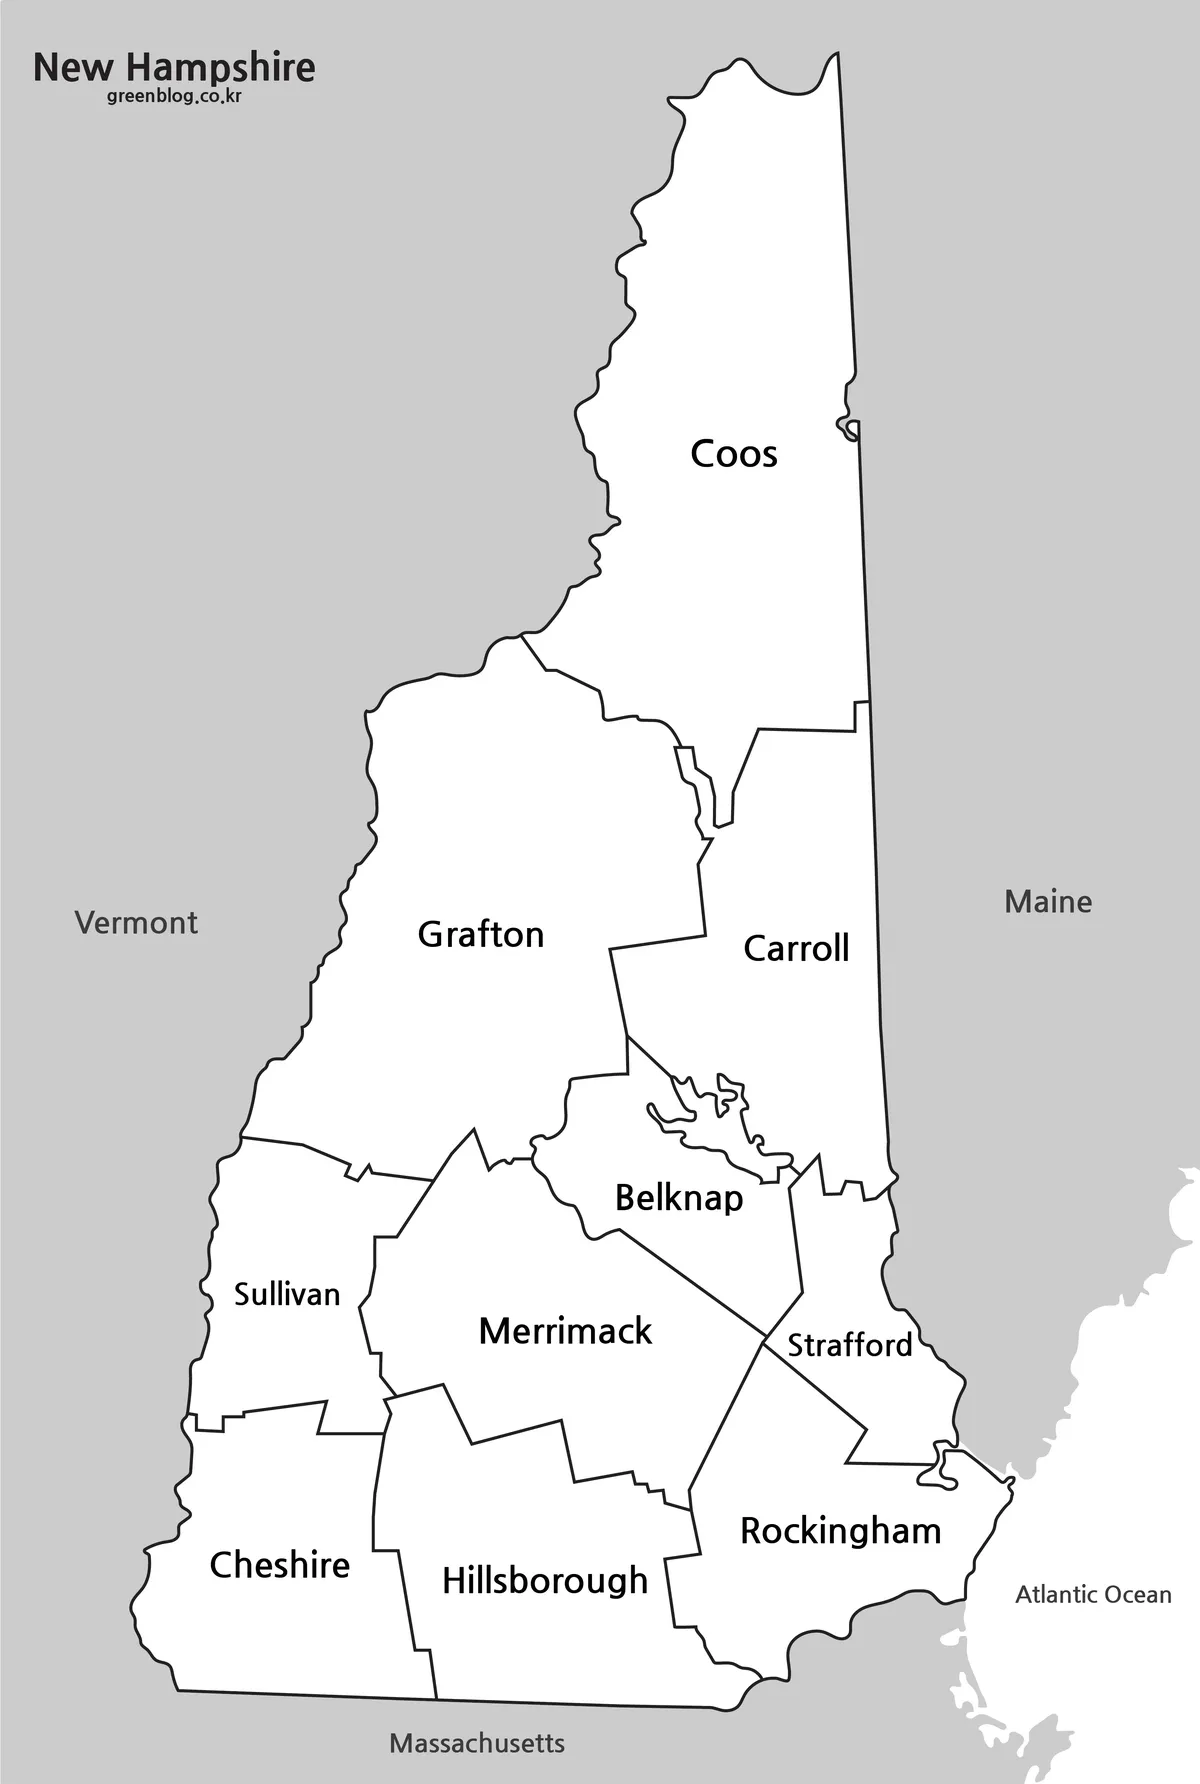
The black-and-white New Hampshire map preserves all 10 county names and the Vermont, Maine, Massachusetts, and Atlantic Ocean labels. County borders remain thick enough to separate the compact southern group without relying on pastel fills. This version is therefore the safer choice for grayscale printing, photocopies, text-heavy reports, and reference sheets that must remain understandable without color.
Monochrome does not turn the map into a blank exercise. Coos, Grafton, Carroll, Belknap, Sullivan, Merrimack, Strafford, Cheshire, Hillsborough, and Rockingham are already named, making the image more suitable as an answer key or reading aid. If learners must supply the county names, use the third version instead.
Preserve the image’s portrait ratio when placing it on a page. Compressing it into a landscape box can make Strafford, Belknap, and Sullivan harder to read and can distort the short southeastern coastline. A full-width portrait figure or a separate page usually provides more reliable label space than a narrow column.
Blank Outline Map for Editing
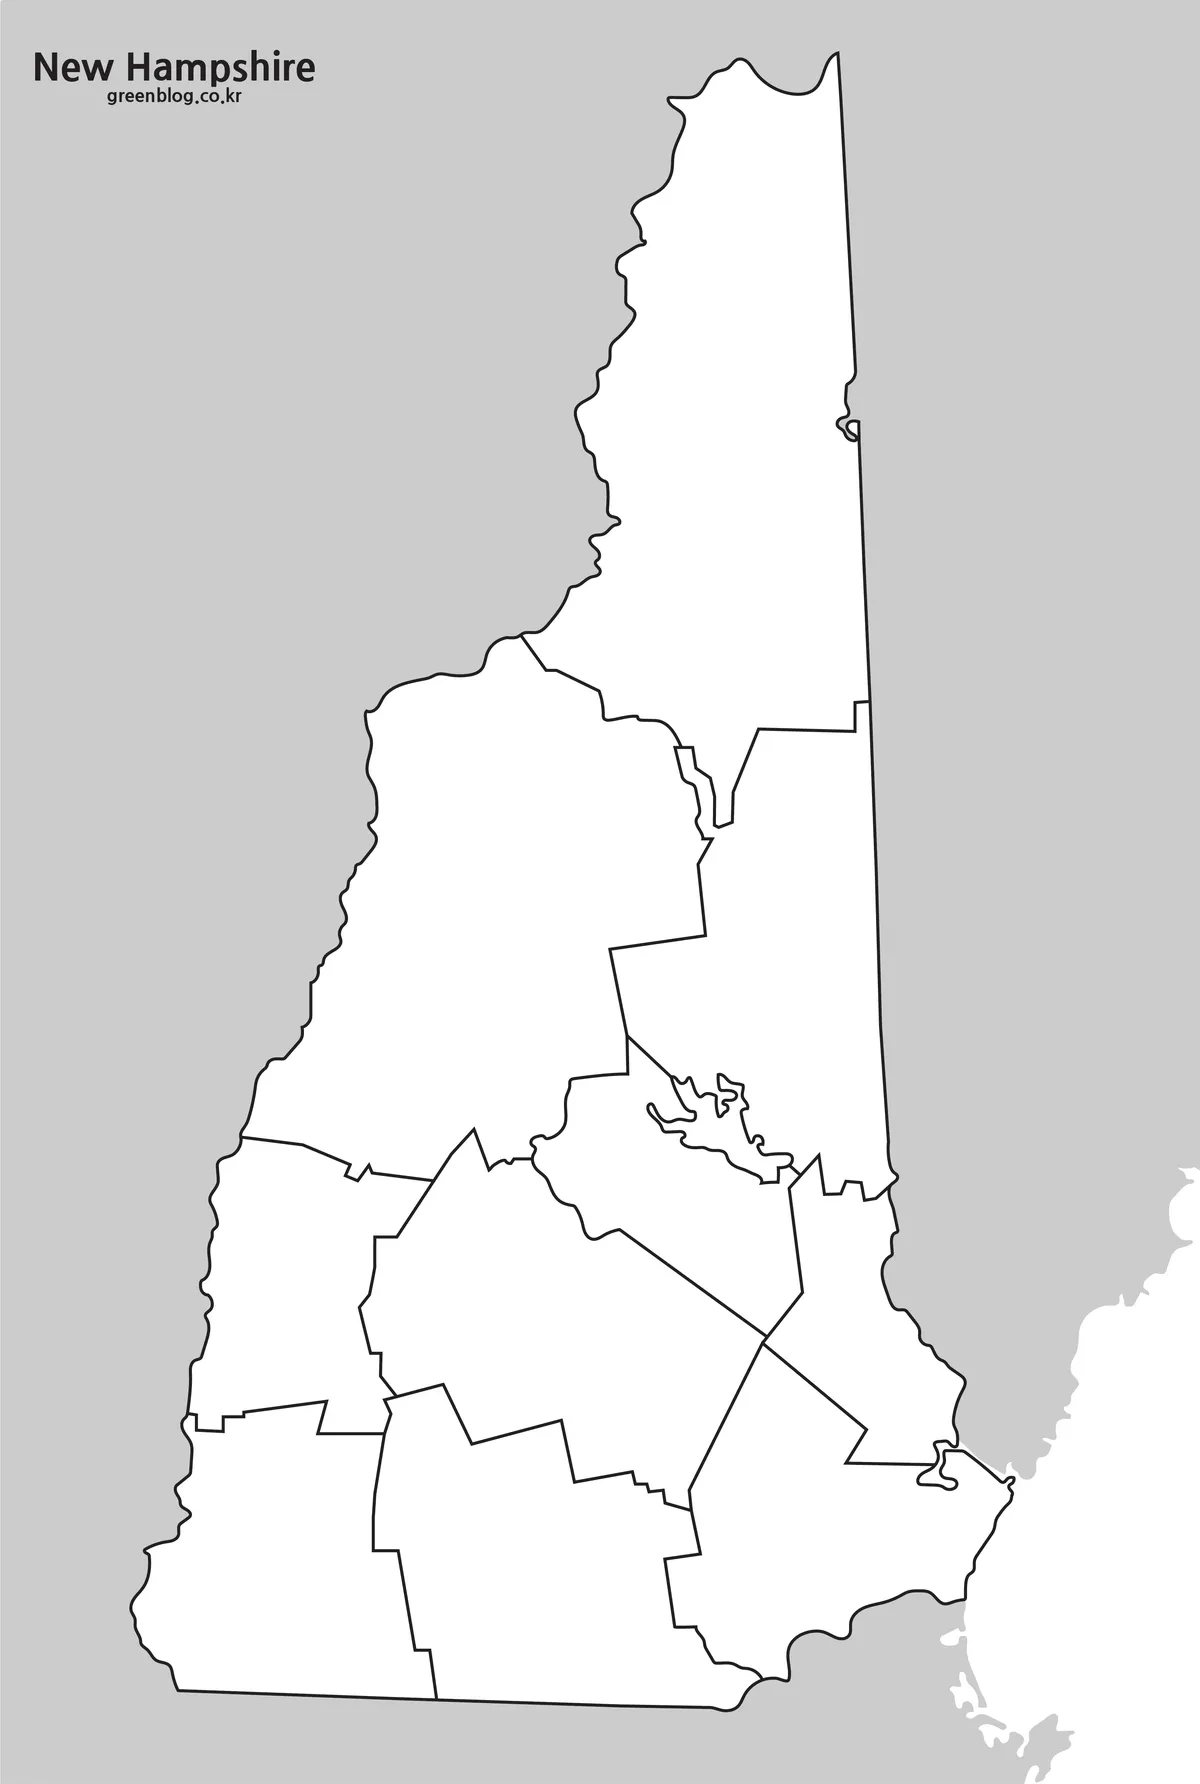
The outline file removes the county names, neighboring-state labels, ocean label, and color fills while retaining all internal county lines. It is an unlabeled county map rather than a pure state silhouette. The central water shape and surrounding coastal context remain in simplified form, giving students a few visual clues even after the text disappears.
A blank New Hampshire map can support county-labeling practice, north-to-south sequencing, regional grouping, or a custom choropleth based on verified county data. Learners can begin with Coos, place Grafton and Carroll below it, identify Belknap around the central lake area, and then complete the six-county southern half. Editors can add city points or routes only after checking their locations elsewhere.
The supplied outline preview has a visible production limitation: its upper-left title is cropped, leaving only the end of “Hampshire,” and the nearby site text is also cut. For a polished presentation, either crop that incomplete header away entirely or use one of the labeled versions. Do not describe this image as a clean title-preserved template without reviewing the visible crop.
This file is a raster image, not a confirmed vector or editable GIS source. Keep an untouched copy before adding information, place annotations on separate layers when possible, and include a legend for any new colors or symbols. Coordinate analysis and legal boundary work require an authoritative geographic dataset rather than this illustration.
How to Use a New Hampshire map
A three-step classroom activity can use the collection efficiently. Display the color map for orientation, provide the monochrome map during discussion, and use the blank-label version for recall. Students can compare the single large northern county with the denser southern pattern, then check which county contains the Atlantic coast and which counties touch Vermont, Maine, or Massachusetts.
For presentations, the New Hampshire map can be divided into northern, central, and southern reading bands. The north centers on Coos; the middle compares Grafton, Carroll, and Belknap; and the south shows the remaining six counties. Keep one complete-state slide before using close crops so the audience can relate each county detail to the overall outline.
Data graphics require an additional verification step. Confirm that every value refers to one of the 10 counties, uses the same date, and does not mix county statistics with city, town, or regional figures. Assign colors according to the data rather than the decorative palette, explain missing values, and test whether the legend remains understandable in grayscale.
The maps may also help introduce New England adjacency. New Hampshire is bracketed by Vermont and Maine, meets Massachusetts along the south, touches Quebec at the unlabeled northern edge, and reaches the Atlantic through Rockingham County. Because the artwork has no roads or travel times, it should orient a regional discussion rather than direct a trip.
Frequently Asked Questions
What does the New Hampshire map include?
The New Hampshire map set includes county-based color, black and white, and outline versions.
Can I print the map in A3 size?
Yes. The map files are prepared for A3-size printing and high-resolution use.
Which version is best for classroom handouts?
The black and white map is usually the best choice for handouts, worksheets, and printed study materials.
Is the outline map good for editing?
Yes. The outline map works well for adding custom colors, county labels, route lines, city markers, or infographic notes.
Does the map show counties?
Yes. The maps are based on New Hampshire county boundaries.
Download Information
Map File Information
This download contains color, black-and-white, and blank-label county maps for state reference, printing, lessons, presentations, and custom annotation.
- Included Versions: Color labeled map, black-and-white labeled map, blank-label county map
- Printable Size: A3-style portrait layout
- File Type: Image files in a ZIP archive
- Intended Use: County reference, classroom worksheets, presentation graphics, and data annotation
Related Maps
Additional Resources
- U.S. Census Bureau: New Hampshire Geographic Areas — review the state’s county count, county status, and the distinction between counties, county subdivisions, towns, and incorporated places.
Green Map creates custom-edited map images using open geographic data sources such as geoBoundaries, Natural Earth, OpenStreetMap, and government open data.
These maps are edited visual materials, not raw data files, and are provided for education, documents, presentations, and graphic reference.